The Spanish State, by means of the Citizenship and Integration Strategy Plans published by the Secretary of State for immigration/emigration (v.g. PECI, 2011/2014), has joined the broader European strategy in proposing a model of interethnic relations built on social interaction and living together tied to the integration paradigm. Intended as mutual adaptation, it proposes a two-way shift that goes beyond peaceful coexistence (Berry, Reference Berry2005). Meanwhile, some national studies have suggested integration is an option widely chosen by the Spanish population, though not always the favorite (Navas et al., Reference Navas, Pumares, Sánchez, García, Rojas, Cuadrado and Fernández2004).
However, several reports published in the European Union and Spain have shown that there is still considerable rejection and prejudice directed at certain outgroups. For example, the latest Amnesty International report (2012) indicates that discrimination against Muslim people is on the rise in Europe as well as Spain. According to that report, 37% of survey respondents believed it is acceptable to expel students from school simply for wearing hijab; the same percentage agreed that protests against the construction of Muslim places of worship should be supported. This opinion appears, too, in a report published by the Spanish Observatory on Racism and Xenophobia (Cea D’Ancona & Vallés, Reference Cea D’Ancona and Vallés Martínez2013), according to which 50% of survey respondents believe “immigrants should be able to maintain only those aspects of their culture and customs that do not annoy other Spanish people,” and 10% believe “they should forget their culture” (p. 153).
Some clear contradictions in the data above call into question the sense and meaning of integration held by members of the majority, and the validity of the preference for integration found not just in Spain, but in other European and North American studies as well (e.g., Dinh & Bond, Reference Dinh and Bond2008). The present study examines – among members of the majority who favor integrating different cultural groups – the variability and potentially differential profiles in terms of three variables that directly relate to this mode of acculturation: prejudice, similarity, and social dominance.
Acculturation and Prejudice
There is a long tradition of research on the acculturation process (Berry, Reference Berry and Berman1990). Its theorization has hinged on two basic questions: the extent to which minority groups want to maintain their culture, and their level of desired contact with the majority group. From the majority’s point of view, acculturation strategies are defined by how much people want minorities to integrate (maintain cultural identity and relationship with majority society), assimilate (abandon original cultural identity and have contact with majority society), be segregated (maintain personal identity and avoid relationship with majority society), or be excluded (eliminating any possibility that the subordinate group can maintain their roots and enter majority society) (Zagefka & Brown, Reference Zagefka and Brown2002). Various studies have confirmed that members of the majority show a preference for integration (Dinh & Bond, Reference Dinh and Bond2008; Piontkowski, Florack, Hoelker, & Obdrzalek, Reference Piontkowski, Florack, Hoelker and Obdrzálek2000; Zagefka & Brown, Reference Zagefka and Brown2002).
Generally speaking, the literature suggests that for host society members, integration is negatively related to prejudice (Kalin & Berry, Reference Kalin and Berry1996). For example, differentiating between subtle and manifest prejudice (Pettigrew & Meertens, Reference Pettigrew and Meertens1995), various studies found that prejudice and integration were negatively related in a native German population (Zick, Wagner, van Dick, & Petzel, Reference Zick, Wagner, van Dick and Petzel2001). In an Italian population, Kosic, Manneti, and Sam (Reference Kosic, Manneti and Sam2005) found that people with low prejudice rated any acculturation strategy deployed by Maghrebian immigrants more positively than more prejudiced individuals did. Navas and her team reported similar findings in Spain (Navas et al., Reference Navas, Pumares, Sánchez, García, Rojas, Cuadrado and Fernández2004): in the host society, low scores on both types of prejudice – subtle and manifest – correlated with integration. Nevertheless, some studies have reported that average scores on subscales evaluating prejudice among people who favor integration, while lower than those of people who prefer other forms of acculturation, were above the midpoint of the scale and thus could be indicative of prejudice (see Kosic et al., Reference Kosic, Manneti and Sam2005; Navas, García, Rojas, Pumares, & Cuadrado, Reference Navas, García, Rojas, Pumares and Cuadrado2006).
Perceived Similarity
Another variable related to integration as a form of acculturation is perceived similarity. This is generally tied to positive appraisals of outgroup members, in both interpersonal and intergroup terms (Hogg, Reference Hogg1992). The underlying logic regarding acculturation orientations is that perceived similarity entails attraction and contact, so it is more closely related to strategies involving those elements (e.g. integration). Looking at different outgroups, several studies have found that perceived similarity was more closely associated with integration, and to a lesser extent with assimilation, segregation, and exclusion (Navas et al., Reference Navas, Pumares, Sánchez, García, Rojas, Cuadrado and Fernández2004; Piontkowski et al., Reference Piontkowski, Florack, Hoelker and Obdrzálek2000).
In summary, high perceived similarity on the part of majority members is associated with integration as the acculturation orientation toward minorities.
Social Dominance
Some studies have begun to connect acculturation research to social dominance theory (Sidanius & Pratto, Reference Sidanius and Pratto1999). This theory, which is based on the notion of social stratification, postulates that all of society is organized around the principle of hierarchical ordering of the groups that comprise it. Thus, group conflict gets downplayed or dismissed thanks to ideologies that justify social inequality. As a consequence, majority groups enjoy privilege or power that enables them to maintain their social position relative to subordinate groups (Pratto, Sidanius, & Levin, Reference Pratto, Sidanius, Levin, Stroebe and Hewstone2006). This system of ideology deploys certain legitimizing myths, which the authors define as a cohesive set of socially accepted values, beliefs, and opinions.
Sidanius and Pratto (Reference Sidanius and Pratto1999) posit that social dominance orientation is the extent to which one accepts hierarchy among social groups and can therefore be a legitimizing stance on intergroup inequality. In that sense, social dominance orientation should be understood as a group attitude (Turner & Reynolds, Reference Turner and Reynolds2003). Various studies have corroborated the relationship between social dominance and attitudes toward outgroups (e.g., Asbrock, Sibley, & Duckitt, Reference Asbrock, Sibley and Duckitt2010; Pratto et al., Reference Pratto, Sidanius, Levin, Stroebe and Hewstone2006). Recently, experimental studies have linked social dominance orientation to acculturation strategies. Altogether, they demonstrate the relation between prejudice, social dominance, and the acculturation preferences of majority members. Thomsen, Green, and Sidanius (Reference Thomsen, Green and Sidanius2008) found that people who scored high on social dominance responded more aggressively toward immigrants they considered inferior (Muslims and Latin Americans) in the experimental condition of assimilation than in the experimental condition of separation. A study of French participants assessing Algerian immigrants (Guimond, de Oliveira, Kamiesjki, & Sidanius, Reference Guimond, de Oliveira, Kamiesjki and Sidanius2010) found that in the integration experimental condition, prejudice was not higher in individuals with high social dominance. However, people with high dominance scores were resistant to assimilation if that entailed a dilution of the status quo and social hierarchy.
In summary, although some studies have found a positive relation between perceived similarity and integration, and a negative one between prejudice and integration, there is no evidence that the latter implies absence of prejudice given participant scores on some of those measures. On the other hand, social dominance research to date has been conducted in college students using experimental design in which integration and assimilation conditions are manipulated without evaluating the expectations of acculturation held by participants. Given the importance of ecological validity in acculturation research, and the importance of precisely determining the relation between integration, which members of the majority defend, and variables traditionally related to it (e.g., prejudice, similarity, and dominance), the present study’s hypothesis was that attitudes would vary among people who favor integration. As a sub-hypothesis, we expect that variability will relate to the type of minority outgroup people are considering integrating. Since the acculturation option majority members choose to employ influences the process of minority acculturation (Tip et al., Reference Tip, Zagefka, González, Brown, Cinnirella and Na2012), we want to be certain integration is related to absence of prejudice, or at least to lower levels of dominance and intermediate levels of similarity.
Method
Participants
A total of 427 non-Gypsy Spanish participants initially filled out the questionnaire used in this study. Of those, 79.6% were residents of municipalities in Campo de Cartagena (mostly Torre Pacheco, San Javier, Los Alcázares, and Fuente Álamo) in Murcia, an autonomous community in Spain. The remaining 20.4% were from other areas of Murcia. To carry out analyses, we retained only 342 (80.1%) questionnaires, from those respondents who selected the pro-integration option in the items tapping expectations about acculturation strategies (see Instruments section). Each participant filled out a questionnaire referring to one of three outgroups with the largest presence in the area: Gypsies, Maghrebians, or Latin Americans. To determine which outgroup each participant’s questionnaire would refer to, the criterion was the highest percentage of outgroup members residing in his or her municipality. Thus, 121 questionnaires were collected about Gypsies, 106 about Maghrebians, and 114 about Latin Americans. The surveys were completed by 230 women and 112 men with an average age of 34 years (SD = 13.5). Of those surveyed, 24% had primary schooling, 23% secondary schooling, and 53% college education.
Instruments
The questionnaire we used includes various measures, of which four were employed in the present study. To make the response format uniform, unless otherwise indicated, all scales were answered on a Likert-type scale ranging from 0 (strongly disagree) to 3 (strongly agree). That way, in keeping with the study’s objectives, we minimized the risk that differences observed could be a consequence or mere artifact of a wide response range, which obviously could have increased variability in the data.
Integration
In keeping with the two-dimensional model of acculturation assessment (maintaining culture/contact), and in order to identify pro-integration participants, we utilized one of the most traditional measures of expectations about acculturation strategies, in this case a version adapted by Ben-Shalom and Horenczyk (Reference Ben-Shalom and Horenczyk2003). Its two questions tap expectations the host society might have about what outgroup members ought to do. The first asks them to choose one of four options, whether they believe: outgroup members should adapt to Spanish culture, but maintain theirs, too (integration); adapt to Spanish culture and distance themselves from theirs (assimilation); maintain their culture without having to adopt ours (segregation); or they need not maintain either culture (exclusion). Addressing contact with the majority group, the second question measures friendship, one of the most reliable indicators (Pettigrew & Tropp, Reference Pettigrew and Tropp2011). Again host society members were asked to choose one of four options, whether they believe outgroup members should be friends with: members of their own cultural group as well as Spanish people (integration); members of their cultural group only (segregation); Spanish people only (assimilation); or they do not need friends in either group (exclusion). Only data from the 342 participants who chose the integration option on both questions were used in our analyses.
Prejudice
To measure prejudice, Pettigrew and Meertens’s scale (Reference Pettigrew and Meertens1995) was utilized, specifically the version validated by Rueda and Navas (Reference Rueda and Navas1996). The scale’s 20 items fall into two subscales (10 manifest prejudice items; 10 subtle prejudice items). High scores indicate greater prejudice. The alpha coefficient for the manifest prejudice subscale was .80 in the group referring to Maghrebians, .79 in the group referring to Gypsies, and .73 in the group referring to Latin Americans. For subtle prejudice, the coefficient was .80 in reference to Maghrebians, .76 in reference to Gypsies, and .66 in reference to Latin Americans.
Perceived intergroup similarity
Five items were used to assess similarity, adapted from Zagefka and Brown (Reference Zagefka and Brown2002). They cover five domains of perceived similarity: culture, religion, style of dress, language, and lifestyle. Sample items include: “¿En qué grado crees que somos semejantes en (…) a los (…)? [How similar do you think we are in (…) to (…) people?]” Coefficients corresponding to the scale’s reliability were adequate: .70 in reference to Maghrebians, .72 in reference to Gypsies, and .76 in reference to Latin Americans. High scores reflect higher perceived similarity.
Social dominance
This variable was measured using Pratto, Sidanius, Stallworth, and Malle’s (Reference Pratto, Sidanius, Stallworth and Malle1994) Social Dominance Orientation Scale, adapted by Martinez, Paterna, Rosa, and Angosto (Reference Martínez, Paterna, Rosa and Angosto2000). The scale consists of 16 items. Sample items include: “Sería bueno que todos los grupos pudieran ser iguales [It would be good if groups could be equal]” and “Los grupos inferiores deben permanecer en su lugar [Inferior groups should stay in their place].” The scale’s reliability was adequate, ranging from .82 in reference to Gypsies and Maghrebians, to .83 in reference to Latin Americans. High scores indicated higher social dominance.
Procedure
The first step in selecting participants was to identify the municipalities in the Comunidad Autónoma de Murcia with the largest number of foreign residents from the outgroups examined in this study. Data from municipal records, obtained by the Spanish Instituto Nacional de Estadística (2013) about immigrants and their nationalities, helped us to identify geographical areas of study. Specifically, the Campo de Cartagena region of Murcia includes four municipalities where immigrants make up more than 22% of the population. In all four, Maghrebians and Latin Americans represent more than 20% of the population, and as high as 50% in the case of Torre Pacheco, and 42% in the case of Fuente Álamo. Meanwhile, the Latin American population was between 19 and 26%. Participants who completed the questionnaire about Gypsies were from the municipalities of Cartagena and San Javier, two local entities with a large Gypsy presence according to information from Fundación Secretariado Gitano (2007). Through nonprobability sampling, people were contacted at home by a member of the research team. We did not apply quotas to participants’ sex or age, but did try to balance the sample in terms of sex. Once consent and prior authorization were obtained, participants filled out the questionnaire voluntarily at home in the presence of the person administering the survey. They received no form of remuneration for participating. The questionnaire’s average completion time was 20 to 35 minutes.
Results
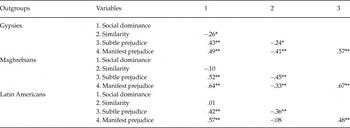
Given our interest in detecting differences in the study’s variables according to outgroup, their results are presented separately. First of all, correlations between the variables for each outgroup (Table 1) were, as expected, moderate and positive between dominance and prejudice in every case, with dominance always more strongly correlated with manifest prejudice than subtle prejudice. Comparing these correlations yielded significant differences only in the case of the Maghrebian outgroup (z = 2.55, p < .01). As for the relationship between dominance and perceived similarity, the only significant, negative correlation was found in reference to the Gypsy outgroup (r = –.26, p < .05). As anticipated, the correlations between perceived similarity and the prejudice subscales were negative for all outgroups. The difference in correlation between similarity and subtle vs. manifest prejudice was significant when participants were referring to the Gypsy (z = –3.83, p < .001) and Maghrebian outgroups (z = –2.59, p < .001).
Correlations between variables for each outgroup

*p < .05, **p < .001.
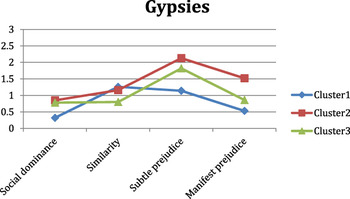
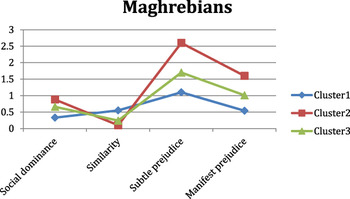
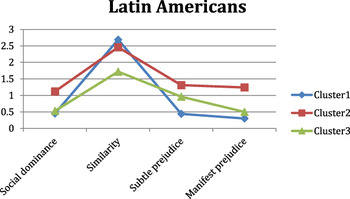
To test the hypothesis of heterogeneity among participants who preferred acculturation through integration, cluster analysis was applied because of its usefulness in examining groupings. In that analysis, Ward’s hierarchical agglomerative procedure was used, along with squared Euclidean distance, since a) the number of participants for each outgroup was under 200; and b) in identifying the correct number of clusters, it yields better results than other hierarchical algorithms. The criteria used to identify clusters were as follows: (a) pseudo-F statistic and Root Mean Square Standard Deviation (RMSSTD), (b) conceptual structure and its fit to prior theory, and (c) no redundant clusters (Dunn index) Footnote 1 . Following those criteria and utilizing participant averages on the variables we measured, results suggested two possible solutions, with two- and three-cluster solutions, respectively. We ultimately chose the latter because in two of the three outgroups, it had the highest Dunn indexes and the lowest values of RMSSTD. The three-cluster solution also yielded better indicators of clear difference between clusters and accounted for a higher percentage of explained variance (see Figures 1, 2, and 3).
Means for Gypsies by cluster.

Means for Maghrebians by clsuter.

Means for Latin Americans by cluster.

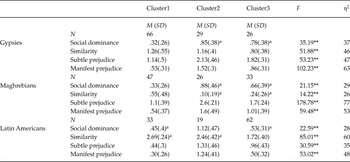
Further support for the three-cluster solution was found in subsequent ANOVAs, and in eta 2 values (see Table 2).
Means and Standard Deviations for each Outgroup and Cluster

Note: Response range from 0 to 3; a = no difference between means.
** p < .001.
First of all, examining F values, the four variables utilized were enough to differentiate between clusters. For two of the three outgroups, the prejudice variable yielded the highest values of F and effect size, verifying that attitudinal variability was a differentiating factor between clusters. Conversely, for participants referring to Latin Americans, perceived similarity had the biggest effect size (eta 2 = .60).
Given that similar clusters appeared in participants referring to Gypsies and Maghrebians, we will describe those first. In both cases, the clusters were mainly characterized by significant differences in subtle and manifest prejudice. Looking at the averages on those subscales (see Table 2), we found that Cluster 1 included participants who scored low on both subscales – egalitarians in Pettigrew and Meertens’s words (Reference Pettigrew and Meertens1995). However, in reference to both outgroups, Cluster 2 participants scored high on both subscales, while Cluster 3 participants scored high only on subtle prejudice. This variation is directly related to the criteria established to differentiate between bigoted and subtly prejudiced people, respectively. With respect to Latin American immigrants, here too, statistically significant differences were found in scores on all variables. However, as Table 2 shows, prejudice scores were so low they could not be considered to indicate prejudicial attitude.
Regarding perceived similarity, significant differences were observed between all clusters in reference to the Gypsy minority. For that outgroup, the cluster exhibiting subtle and not manifest prejudice showed the lowest perceived similarity. For the Maghrebian outgroup, Cluster 1 differed from the other two. As for the Latin American outgroup, differences appeared between Cluster 3 and the other two, that is, those who showed intermediate levels of prejudice. In summary, lower perceived similarity was always found in the group that scored highest on subtle prejudice and lowest on manifest prejudice.
Shifting our attention to social dominance orientation, it was in reference to Gypsies and Maghrebians that significant differences were found between those we may consider prejudiced (Clusters 2 and 3) versus unprejudiced (Cluster 1). Referring to Latin Americans on the other hand, the differences appeared between those who scored high on both prejudice subscales (Cluster 2), only on subtle prejudice (Cluster 3), and neither (Cluster 1).
Finally, we should mention an important piece of data supporting the variability hypothesis we proposed. Indices of effect size greater than or equal to .8 indicate large effect size. That d value corresponds to an eta 2 value greater than or equal to .14. Here we found values ranging from .26 to .77. Keeping significance levels in mind, this clearly indicates we must not underestimate these variables’ relevance in explaining the heterogeneity observed in pro-integration attitudes.
Discussion
This study shows that among members of the majority, preference for integration as an acculturation option encompasses very heterogeneous attitudes toward outgroups, and does not necessarily imply absence of prejudice. These data support the variability hypothesis proposed at the outset of this study. Furthermore, as recent literature has suggested, we found evidence that the type of outgroup being integrated must be taken into consideration. For years in Europe, there has seemed to be an order of preferences for particular outgroups related to perceived similarity (Hagendoorn, Reference Hagendoorn, Hunyady, Hamilton and Anh1999); this was clear in our results. Prejudice scores were highest in reference to the Maghrebian group, with Gypsies in the middle and Latin Americans viewed more positively. These results are consistent with previous findings that called attention to Westerners’ Islamophobic tendencies (Kunst, Sam, & Ulleberg, Reference Kunst, Sam and Ulleberg2013).
The interpretative coherence of the clusters found in the present study supports the assertion that just because members of the majority are in favor of acculturation through integration, they do not necessarily lack prejudice. That finding is consistent with results of other studies in Spain (Navas et al., Reference Navas, García, Rojas, Pumares and Cuadrado2006) and Italy (Kosic et al., Reference Kosic, Manneti and Sam2005) that called attention to the interaction between forms of acculturation and prejudice levels. The present study adds to the equation how similarity and social dominance relate to integration. Conceptualizing people as subtly prejudiced means they tend to maximize the differences they perceive from outgroups (Pettigrew & Meertens, Reference Pettigrew and Meertens1995), as in the case of Maghrebians and Gypsies in the present study. Similarly, our most prejudiced participants scored highest on social dominance, suggesting that they want to maintain the status quo, and are against changing the social hierarchy. Similarly, we want to emphasize that people who scored highest on prejudice against Latin Americans, despite perceiving them as very similar, were more strongly social dominance oriented. A likely explanation for that is they believe the Latin American presence could alter the existing social stratification.
In a way, taken altogether, these results could be interpreted as paradoxical: integration was the form of acculturation preferred by most host society members, with 80% of survey respondents selecting that option, but that does not necessarily mean they were unprejudiced. One explanation for that result has to do with methodology. Following Rudmin and Ahmadzadeh’s logic (Reference Rudmin and Ahmadzadeh2001), we might say that from the perspective of host society members, integration gets represented as a concession. In measuring integration from the majority group’s perspective, it has been, and remains, common to ask about the desirability or pleasantness of what they want outgroup members to do, or about the expectations and perceptions they hold toward them. Never has the question been posed to the majority group in terms of what they, personally, are willing to do to promote integration, and if they consider it possible and/or beneficial. As Rudmin (Reference Rudmin2003) suggests, criticism of Berry’s model, high integration-assimilation correlations, and high integration-separation correlations all indicate we need to use alternate procedures to assess acculturation. Moreover, we must ask ourselves if it is possible to maintain two or more cultural models that could be considered contradictory. It is not a question of maintaining cultural norms in certain private spheres, but to what extent they shape public life, and how the majority accepts them. For instance, the French state is cracking down on public displays of religious symbols in schools; that could be interpreted as a form of assimilation, or an appropriate means of ensuring coexistence. What Moghaddam (Reference Moghaddam2008) posits about multiculturalism could be interpreted along those lines.
Whether using a bidimensional (e.g. maintaining culture/contact) or multidimensional model (spheres of close contact or formal contact), or a model with dichotomous or polytomous response, evaluation of integration ultimately gets computed as a value reflecting what members of the majority want/hope/expect minority members to do (Matera, Stefanile, & Brown, Reference Matera, Stefanile and Brown2012). Some studies have reported changing acculturation preferences in connection to different domains (Navas et al., Reference Navas, Pumares, Sánchez, García, Rojas, Cuadrado and Fernández2004), but we believe that does not invalidate our comment.
In addition to that challenge, it is important to consider that such proposals do not ask participants to respond with what they are willing to do. Since other people are the object of the action, it is possible that in their condition as majority members, being pro-integration is related to a certain degree of social desirability, especially when it is supported by public policy, as another study suggested (Kosic et al., Reference Kosic, Manneti and Sam2005). Even considering that integration may be viewed as “politically correct,” a plausible, perhaps better explanation for the hypothesis of attitudinal heterogeneity is that items have been formulated and evaluated in a way that does not involve the majority group in the process of minority integration.
This study’s limitations, connected to sample size and geographic area in which it was conducted, could be rectified through more extensive studies of other outgroups and in other territories. The role of cultural and political context can be a determining factor in intergroup relations, and acculturation studies have revealed differences according to country and the groups being studied (Bourhis, Montaruli, El-Geledi, Harvey, & Barrette, Reference Bourhis, Montaruli, El-Geledi, Harvey and Barrette2010). These data, collected from Spanish rural participants with more limited intergroup relations than in other European countries and no major interethnic conflict, might vary or show different nuances if one of those features changed.
To gain a clear understanding of what integration means for the majority population, qualitative research may be of great help. It would furthermore be interesting to apply a quasi-experimental research design incorporating vignettes into behavior assessment. Moreover, using different procedures, we believe it is necessary to assess the behaviors that majority members display to facilitate the integration of outgroups, a policy they reportedly favor. To what extent prejudice and integration may be compatible is something that needs further explanation. And if integration is defined as a two-way process, we must identify what changes members of the majority initiate, and to which they are receptive.