

Introduction
A number of studies have described the physiological, energeticReference Hoyt and Taylor1–Reference Wickler, Hoyt, Cogger and Hirscbein4 and kinematic responsesReference Wickler, Hoyt, Cogger and Hirscbein4–Reference Hoyt, Wickler and Cogger6 of horses to exercise on level and positive gradients; however, published studies describing the response of horses to exercise on negative gradients are scantReference Hoyt, Wickler and Garcia7, despite the fact that many horses compete over variable terrain. An objective, though a largely theoretically based, model to calculate the oxygen cost of transport (COTpath in ml O2 kg− 1 m− 1 path) for running on positive and negative gradients (from − 30 to +30%) has previously been providedReference Schroter and Marlin8; however, greater experimental data, particularly from negative gradients, are required before the model can fully be evaluated. During locomotion on positive gradients, energetic costs are increased in a wide range of species when compared with level gradientsReference Eaton, Evans, Hodgson and Rose2, Reference Wickler, Hoyt, Cogger and Hirscbein4, Reference Margaria, Cerretelli, Aghemo and Sassi9–Reference Pivarnik and Sherman13 and are decreased on negative gradientsReference Margaria, Cerretelli, Aghemo and Sassi9, Reference Raab, Eng and Waschler11–Reference Minetti and Ardigo14. In humans, walking or running down progressively steeper slopes results in the energy cost decreasing to a minimum, after which further decrements in gradient lead to increases in energy cost. A widely held view is that this minimum cost occurs at around − 10% gradientReference Margaria, Cerretelli, Aghemo and Sassi9, Reference Minetti, Ardigo and Saibene15; however, this may be influenced by the particular gait characteristics and running speed of an individualReference Wanta, Nagle and Webb16. It is not known whether quadrupeds such as the horse also reach a minimum energy cost of locomotion at comparable negative gradients or how this energy cost relates to locomotion strategy at different speeds. Numerous studies in a range of species have shown that, generally, the total energetic cost of transport per unit distance is a constant, which is independent of speed, but which falls with increasing bodyweightReference Taylor, Schmidt-Nielson and Raab17, Reference Taylor18. A curvilinear relationship between speed and cost of transport has been previously demonstratedReference Hoyt and Taylor1). More recently, Wickler et al. Reference Wickler, Hoyt, Cogger and Hirscbein4 have reported that the speed that produces the minimum cost of transport is also the ‘preferred speed’ when horses on the flat are allowed to freely select the trotting speed. Both step length and time of contact appear to influence metabolic costs of locomotionReference Kram and Taylor19, Reference Taylor20 and change with speedReference Hoyt, Wickler and Cogger6. Furthermore, changes in stride frequency (SF) can increase the economics of running in humans when stride rate shifts from the preferred rateReference Cavanagh and Williams21. The duration of the stance phase of the stride explains most of the speed-related and size-related differences in the metabolic cost of locomotion, since all the force necessary to support the animal's body weight must be generated during the period when the foot is in contact with the ground. Moreover, Kram and TaylorReference Kram and Taylor19 and Roberts et al. Reference Cavanagh and Williams22 have provided convincing evidence that the metabolic cost of locomotion is largely determined by the rate at which force must be generated by the muscles that support the body during the stance phase.
In this study, it was not possible to measure oxygen consumption (VO2) directly; however, it is well documented that heart rate (HR) is linearly related to submaximal work effort or locomotory speed in horsesReference Schroter, Baylis and Marlin3, Reference Lindholm and Saltin23, Reference Thomas and Fregin24. VO2 is also linearly related to speedReference Hoyt and Taylor1, Reference Taylor, Schmidt-Nielson and Raab17, Reference Gottlieb-Vedi, Essen-Gustavsson, Persson, Persson, Lindolm and Jeffcott25 and HRReference Eaton, Evans, Hodgson and Rose2. HR has been considered a useful indicator of VO2Reference Eaton, Evans, Hodgson and Rose2, Reference Schroter, Baylis and Marlin3 and was therefore used in this study to give an estimate of the net transport cost.
The purpose of this study was to describe the HR, estimated net transport cost and stride characteristics of horses exercising at walk and trot on positive and negative gradients.
Materials and methods
Animals and study design
Five clinically sound horses (three Thoroughbreds, one Warmblood and one Lipizzaner) with mean ± SD mass of 517 ± 42 kg (range: 486–587 kg) and mean age (10 ± 4 years; range: 5–13 years) were trained to walk and trot on − 6, − 3, 0, 3 and 6% gradients on a high-speed treadmill (SÄTO I, SÄTO AB, Sweden) over a 3-month period prior to data collection. Following a standardized warm-up, (20 min walk on a horse walker and 4 min at 1.9 m s− 1, 2 min at 3.5 m s− 1 and 2 min at 1.9 m s− 1 at 0% on the treadmill), horses exercised at walk (1.9 m s− 1) and trot (3.5 m s− 1) for 3 min on the treadmill set at − 6, − 3, 0, 3 and 6% in a random order. One horse, the Lipizzaner, exercised at 1.6 and 3.0 m s− 1 in walk and trot, respectively. This adjustment in speed was made based on estimated Froude numbers as the Lipizzaner was smaller in size than the Thoroughbreds and Warmblood.
Measurements and analysis
HR data were recorded at 5-s intervals during the last minute of each treatment (i.e. speed per incline combination) using a Polar S610i Plus monitor and coded T52H transmitter (Bodycare Products, Warwickshire, UK). A HR-based estimate of net transport cost (COT; assuming the linear relationship between HR and VO2) was used. All horses had similar morning resting HR (35 ± 1 beat min− 1); therefore, estimated COT was determined as:

Kinematic data of forelimb and hindlimb motion characteristics (SF; stride length (SL); duty factor (DF)– defined as the percentage of time the limb is in contact with the ground during one stride cycle) were collected over a 10-s period during the last minute of each treatment. Data were obtained using a six-camera Pro-Reflex system (Qualisys, Sweden) at 120 Hz, and six strides per horse per treatment were analysed.
Statistical analysis
A multifactor univariate ANOVA with Tukey's post hoc tests was used to analyse data. Where individual horses behaved differently to each other, and further analysis was required within gradients, matched paired t-tests were used to compare variables (between walk and trot, and between forelimbs and hindlimbs). Pearson's correlation was used to analyse the differences in HR and COT data from walk to trot. P < 0.05 was considered statistically significant. All protocols and procedures were approved by the University of Bristol's Ethics Committee.
Results
Heart rate
Compared with level exercise, HR increased at both 3 and 6% by a mean of 13 and 21 bpm in walk, and by 19 and 32 bpm in trot, respectively (P < 0.001). At negative gradients, HR decreased by a mean of 9 and 14 bpm at walk, and by 12 and 17 bpm at trot for − 3 and − 6% gradients, respectively (P < 0.001; Fig. 1). Differences in HR response between individual horses and between gaits were evident at the different gradients (P < 0.001). Post hoc tests confirmed that all gradients produced significantly different HR (P < 0.001), with HR increasing from negative to positive gradients.
Heart rate ± SD (beats min− 1) during walk and trot at positive, level and negative gradients

Estimated net transport cost
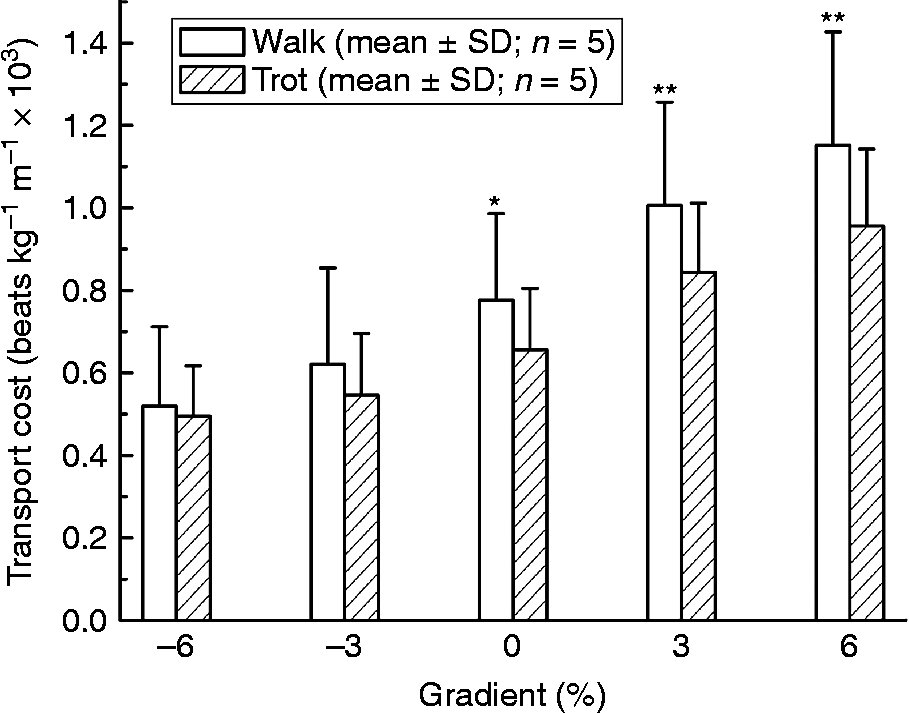
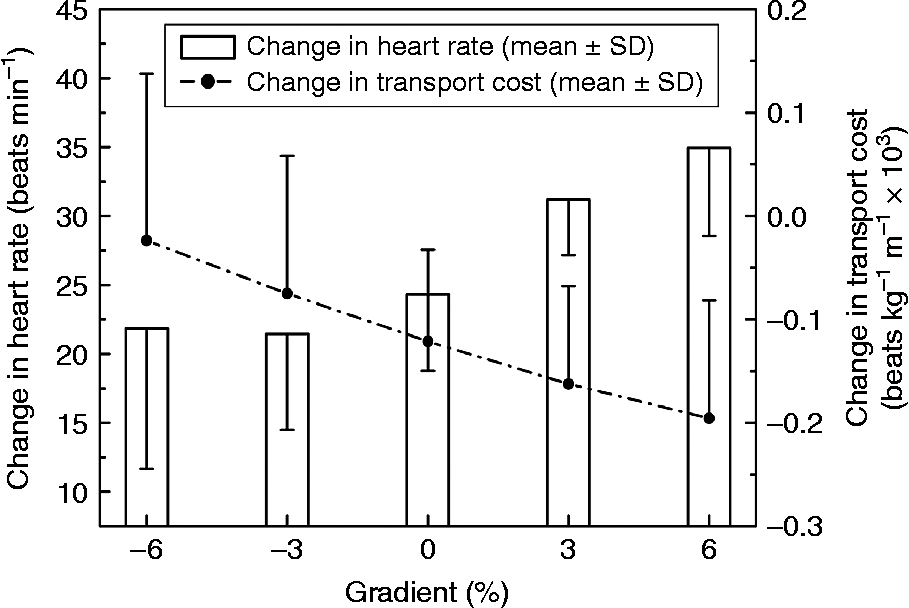
COT was significantly influenced by both gradient (P < 0.001) and gait (P < 0.05; Fig. 2). At walk, COT increased by a mean of 30 and 48% at 3 and 6% gradients, and by 29 and 46% at trot compared with level exercise, respectively (P < 0.001). At negative gradients, COT decreased by 20 and 33% at walk, and by 17 and 24% at trot for − 3 and − 6% gradients, respectively (P < 0.001) compared to level exercise. No differences in the COT were seen between − 3 and − 6% (P>0.05); however, the negative gradients were significantly lower than the corresponding positive gradients (P < 0.01 and 0.001, respectively). COT was lower at trot compared with walk at 3, 6 (P < 0.01) and 0% (P < 0.05); however, these differences became less pronounced at the negative gradients (P>0.05). Changes in HR and COT from walk to trot are shown in Fig. 3. Smaller differences in both HR and COT were seen at negative compared with positive gradients (P < 0.05).
Net transport cost ± SD (beats kg− 1 m− 1 × 10³) during walk and trot at positive, level and negative gradients. * (P < 0.05) ** (P < 0.01) walk significantly different to trot

Change in heart rate ± SD (beats min− 1) and transport cost ± SD (beats kg− 1 m− 1 × 10³) between walk and trot at positive, level and negative gradients

Stride characteristics
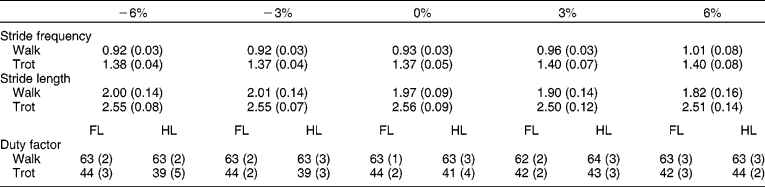
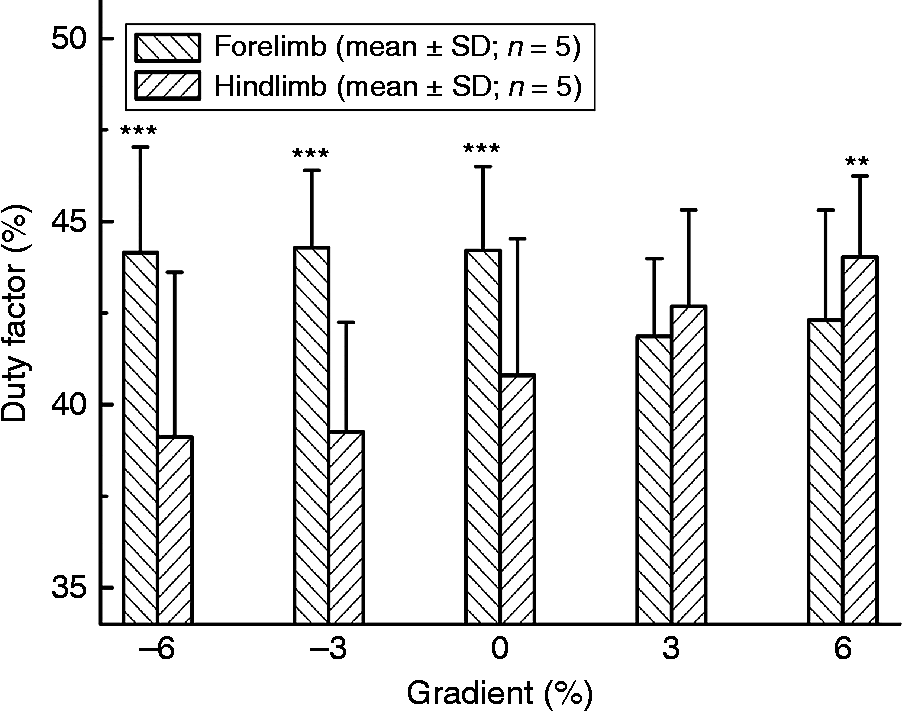
Temporal and linear kinematics of horses exercising in walk and trot on positive, level and negative gradients are shown in Table 1. Gradient and horse significantly influenced SF and SL in walk and trot (P < 0.001). SF was lower and SL was longer at negative compared with positive gradients (P < 0.001) in both gaits. Gradient and horse significantly influenced DF in walk and trot (P < 0.001). For the forelimbs and hindlimbs, DF at walk was not significantly different across gradients (P>0.05). At trot, DF in the forelimbs was significantly (P < 0.001) greater on the negative gradients, and DF in the hindlimbs was significantly (P < 0.001) greater on the positive gradients (Fig. 4).
Mean±SD of stride frequency (stride s−1), stride length (m) and duty factor (%) during walk and trot at positive, level and negative gradients (n=5); FL, forelimb; HL, hindlimb

Duty factor ± SD (%) during trot at positive, level and negative gradients. ** (P < 0.01), *** (P < 0.001) forelimb significantly different to hindlimb

Discussion
While the present study utilized a small number of horses of varied breeds and sizes, primarily due to restricted horse availability at the research facility, all horses showed a similar response to the negative gradients tested. Further investigations over a wider range of negative gradients with a larger sample size are required to establish whether the differences identified between negative and level gradients in the present study are maintained, diminished or amplified at steeper negative grades.
HR and estimated COT
Compared with level exercise, HR increased at positive and decreased at negative gradients in walk and trot. The increase in HR at the combination of speeds and positive grades reported here is within the range previously reported for the horseReference Eaton, Evans, Hodgson and Rose2, Reference Thornton, Pagan, Persson, Gillespie and Robinson26–Reference Sexton and Erickson28 and reflects the increased workload of raising the body mass vertically as well as horizontally. In the present study, it was not possible to measure oxygen consumption (VO2) directly; however, Eaton et al. Reference Eaton, Evans, Hodgson and Rose2 demonstrated that HR is linearly related to VO2 over a wide range of speeds and that this relationship is independent of incline. HR has therefore been considered a useful indicator of the rate of VO2Reference Eaton, Evans, Hodgson and Rose2, Reference Schroter, Baylis and Marlin3. The validity of using HR as an indicator of workload at exercise intensities lower than 120–150 bpm (typically walk and trot) is known to be susceptible to the effects of excitement superimposed on the effects of exercise. However, the variance in HR in the present study is similar at all gradients, and there was no evidence to suggest that horses showed increased levels of excitement or anxiety at any of the negative or positive gradients tested. In addition, all horses had been extensively acclimated to the experimental conditions, and HR traces of individuals did not suggest signs of excitement. Furthermore, the changes in HR with gradient were mechanistically consistent with predicted changes.
The observed decrease in HR when exercising on negative gradients has, to our knowledge, not been previously reported in the horse, although it was predicted in the modelling paper by Schroter and MarlinReference Schroter and Marlin8. However, this apparent reduction in workload does agree with reports in the dogReference Raab, Eng and Waschler11 and manReference Pivarnik and Sherman13, Reference Wanta, Nagle and Webb16, Reference Minetti, Moia, Roi, Susta and Ferretti29, Reference Robergs, Wagner and Skemp30. In dogs, oxygen consumption was reduced by 22 and 31%, when running down a 7.4 and 11.8% gradient relative to the levelReference Raab, Eng and Waschler11, respectively, and Hoyt et al. Reference Hoyt, Wickler and Garcia7 reported a 42–49% reduction in oxygen consumption (VO2) in the horse when trotting down a 10% slope (neither study reported HR measurements).
The downhill reduction in VO2 observed in the horse is particularly significant when it is compared with the consequences of trotting uphill on a 10% slope, where oxygen consumption increases around 2.5 times above that for trotting on the flatReference Eaton, Evans, Hodgson and Rose2, Reference Wickler, Hoyt, Cogger and Hirscbein4. In humans running on a treadmill, HR and oxygen consumption have both been reported to be reduced by 19 (24 bpm) and 34%, respectively, on a 10% decline, when running at 3.08 m s− 1Reference Minetti, Moia, Roi, Susta and Ferretti29 and are similar to the reductions (in HR) seen in the present study. While reduced HR and VO2 suggest a reduced metabolic demand, it has also been suggested by Delp et al. Reference Delp, Duan, Ray and Armstrong31 that lower HR during downhill exercise could also indicate that sympathetic outflow is lower during eccentric contractions. The reduced HR observed may also be related to an increase in stroke volume if venous return is facilitated by downhill locomotion, though it is also possible that the work of the caudal muscles is reduced on downhill gradients, particularly in trot, as evidenced by an increased DF in the forelimbs on the downhill grades compared with the uphill grades.
Workload can also be expressed in terms of COT, which represents the net energy cost per kilogram per metre travelled. Generally, COT is found to be a constant that is independent of speed and can also be reliably deduced from HR (beats kg− 1 m− 1 × 10³)Reference Schroter, Baylis and Marlin3. In the present study, COT was significantly influenced by both gradient and gait. At walk, COT increased by 30 and 48% at 3 and 6% gradients, and by 29 and 46% at trot, respectively, compared with level exercise. The changes in COT with positive gradients were similar to other reports in horsesReference Eaton, Evans, Hodgson and Rose2, Reference Thornton, Pagan, Persson, Gillespie and Robinson26, Reference Hiraga, Kai, Kubo, Yamaya and Erickson27 and, like HR, reflect the increased workload associated with raising the body vertically in addition to horizontally. The observed increase in workload could be due either to the recruitment of a greater proportion of the total muscle mass or recruitment of the same mass of muscle over a longer duty cycle. Our findings do indicate that the DF is increased in the hindlimbs on positive gradients (see below) and this, in addition to previous cardiovascularReference McDonough, Kindig, Hildreth, Behnke, Erickson and Poole32, EMGReference Robert, Valette and Denoix33 and kinematicReference Kai, Hiraga, Kubo and Tokurik34, Reference Sloet van Oldruitenborgh-Oosterbaan, Barneveld and Schamhardt35 findings in the horse, adds further support to the suggestion that the hindlimbs must work harder and over a greater proportion of the duty cycle during work on positive gradients. At negative gradients, COT decreased by 20 and 33% at walk, and by 17 and 24% at trot for − 3 and − 6% gradients, respectively, compared with level. The magnitude of these differences is in accordance with the findings of Hoyt et al. Reference Hoyt, Wickler and Garcia7, who found greater reductions (42% at 2.25 m s− 1 and 49% at 4 m s− 1) at the steeper gradient of − 10%. Hoyt et al. Reference Hoyt, Wickler and Garcia7 reported a COT of 0.057 ml O2 kg− 1 m− 1 when trotting at 3.5 m s− 1. Using the equation from Eaton et al. Reference Eaton, Evans, Hodgson and Rose2 [VO2 (ml min− 1 kg− 1) = 0.833 × HR (beats per min) − 54.7 in five horses (mean weight 492 kg)], our predicted COT (based on VO2) at 3.5 m s− 1 at − 6% can be calculated as 0.065 ml O2 kg− 1 m− 1. While the mean weight of horses in the present study was higher (517 kg) than that used in the Eaton et al. Reference Eaton, Evans, Hodgson and Rose2 equation, and hence there will be some error in our predicted COT, the value does support the suggestion that COT does decrease as the gradient becomes more negative. The decreased downhill COT and HR observed in the present study might result from a decrease in the volume of active muscle, since eccentric muscle activity that characterizes downhill exercise permits the muscle to produce the same peak forces with a smaller muscle mass characterized by EMG activityReference Gillis and Biewener36, Reference Gabaldon, Nelson and Roberts37. Therefore, increased eccentric muscle activity during downhill exercise is associated with an increase in relative metabolic efficiency. Further support for a reduced metabolic demand is also evidenced by reduced muscle blood flow to the hindlimb muscles during downhill exerciseReference Delp, Duan, Ray and Armstrong31. Reduced muscle blood flow has previously been reported to be a good estimate of muscle metabolic demandsReference Marsh, Ellerby, Carr, Henry and Buchanan38, and McDonough et al. Reference McDonough, Kindig, Hildreth, Behnke, Erickson and Poole32 reported changes in metabolism consistent with increased hindlimb muscle blood flow during uphill exercise in horses.
No differences in the COT were seen between 0, − 3 and − 6%; however, the COT for the negative gradients was significantly lower than for the corresponding positive gradients. This is an agreement with human studies that found minimal differences between treadmill gradients between − 5 and − 10%. Pivarnik and ShermanReference Pivarnik and Sherman13, monitored human runners on gradients from − 10 to +10% and found that the changes in gradient at downhill grades evoked less response than changes in gradient at positive grades. Previous studies in humans have investigated ΔVO2 between equally incremented workloads and suggest that when ΔVO2 is not constant but, rather, a function of exercise intensity, it is an indication of decreased efficiency. In the present study, changes in HR (ΔHR) and COT (ΔCOT) from walk to trot were much smaller between level and negative gradients compared with positive. This finding might be interpreted in two ways. The first perspective could indicate a greater economy of movement when walking or trotting at negative grades compared with level. Conversely, it could be that, despite decreases in workload as treadmill grade becomes more negative, metabolic and cardiovascular demands remain the same. The second perspective would appear to be supported by studies that have examined muscular efficiency.
COT was lower at trot compared with walk at 3, 6 (P < 0.01) and 0% (P < 0.05), and this was not unexpected in the light of earlier workReference Hoyt and Taylor1, Reference Wickler, Hoyt, Cogger and Hirscbein4). Walk has a very narrow range of optimally efficient speeds compared with trot and canterReference Hoyt and Taylor1, and on positive gradients both speed and grade appear to influence the economy of locomotionReference Eaton, Evans, Hodgson and Rose2, Reference Raab, Eng and Waschler11, Reference Hiraga, Kai, Kubo, Yamaya and Erickson27. However, these differences became less pronounced at the negative gradients. The metabolic advantage of faster speeds or gaits, indicated by COT, appears to diminish as the gradient becomes more negative, presumably reflecting increased energy demands associated with balance and braking on progressively negative slopes. This would mean that the energy used to resist gravity on a downhill slope is increasing proportionally, more than the cost of horizontal work is decreasing.
It was unclear from the results of the present study whether the minimum COT had been reached at − 6%. Previous studies in humans have suggested that the minimum COT would occur around − 10%, and this may be the case in the horse; however, it is quite probable that the minimum COT varies between individuals, as demonstrated in humansReference Wanta, Nagle and Webb16.
Stride characteristics
SF was reduced and SL increased at negative compared with positive gradients in walk and trot. There was a trend for SF to be increased at positive grades compared with level, as had been reported previouslyReference Barrey, Galloux, Valette, Auvinet and Wolter39; however, no differences were seen between negative and level grades. Previous studies in manReference Minetti and Ardigo14 and horsesReference Hoyt, Wickler and Garcia7 have also reported reduced SF at negative gradients; however, in the study by Hoyt et al. Reference Hoyt, Wickler and Garcia7, SF at − 10% was significantly lower than at 0%. It is probable that the gentle negative grades used in the present study were not sufficient to induce significant changes in locomotion compared with level; however, differences between positive and negative gradients are of interest. Hoyt et al. Reference Hoyt, Wickler and Garcia7 suggested that the lower SF observed when trotting on an decline may indicate that time of contact is increased, and that this in turn could decrease metabolic costs by decreasing the rate of force applicationReference Kram and Taylor19.
Our HR, COT and kinematics data appear to support this theory, but do suggest that forelimbs and hindlimbs are operating differently on negative and positive gradients, as evidenced by the changes in DF. At trot, DF in the forelimbs was significantly greater on the negative gradients, and DF in the hindlimbs was significantly greater on the positive gradients. Previous equine studies on positive gradients also suggest that the mechanics of the forelimbs and hindlimbs are different and speed dependent, though comparable evidence regarding negative gradients is limited. Hoyt et al. (2002) demonstrated that when trotting up an incline, the hindlimb undergoes a greater range of motion than the forelimb because of increased retraction resulting from increased extension of the coxofemoral joint. On positive gradients, increased hyperextensionReference Sloet van Oldruitenborgh-Oosterbaan, Barneveld and Schamhardt35 and stance durationReference Hiraga, Kai, Kubo, Yamaya and Erickson27, Reference Robert, Valette and Denoix33, Reference Sloet van Oldruitenborgh-Oosterbaan, Barneveld and Schamhardt35 of the hindlimb compared with the forelimb have been reported, suggesting that the hindlimbs carry more weight and provide greater propulsion.
Recent ground reaction force data in horses demonstrated that trotting up an incline was produced through increased propulsive and vertical force of the hindlimb, while force decreased for the forelimbReference Dutto, Hoyt, Cogger and Wickler40. Both DF and time of contact were different between the limbs, in agreement with the present study, though it is interesting to note that Dutto and co-workersReference Dutto, Hoyt, Cogger and Wickler40 found that, despite differences in temporal and force measures, the horse maintained a consistent distribution of weight. If the differences in the mechanics of forelimbs and hindlimbs on positive gradients (compared with level) relate to the generation of force and the requirement for increased positive work, it is highly probable that the differences we have found in basic stride characteristics are reflective of different kinetics and increased negative work associated with exercise on downhill slopes; preliminary kinetic data of horses trotting on a − 10% decline support this view (Schreiber, personal communication).
Conclusion
Data suggest that metabolic demand reduces from positive to negative gradients, and that trot is more efficient than walk at all gradients. However, the metabolic advantage of faster speeds per gaits as estimated by COT diminishes as the gradient becomes more negative, reflecting the increased energy demands associated with maintaining balance and increased braking forces on negative slopes. While more detailed analysis of locomotion is required, changes in basic stride characteristics suggest that horses use different strategies when travelling up or down slopes and these in turn may be responsible for the observed changes in HR and COT.
Acknowledgements
The authors wish to thank the equine technicians, in particular Fiona Steel, at Bristol University and Hartpury College Equine Veterinary and Therapy Centre, for their assistance with horses and treadmill exercise. In addition, we wish to thank Lucy Dumbell, Hartpury College, UWE, for her assistance with statistical analysis.