Introduction
Blackleg disease of potato plants and tubers is caused by different bacterial pathogens belonging to the genera Pectobacterium and Dickeya, formerly Erwinia species (Charkowski, Reference Charkowski2015). In Scotland, the disease is largely caused by Pectobacterium atrosepticum (Pba), via contaminated seed tubers (Perombelon, Reference Pérombelon2002). Worldwide, blackleg disease is a major contributor to the loss of potato crops, and in some countries is the main cause of seed tuber failure and downgrading, e.g. in the Netherlands, strict tolerances for certification have led to direct losses of up to €30 M annually (Toth et al., Reference Toth, Van Der Wolf, Saddler, Lojkowska, Hélias, Pirhonen and Elphinstone2011). Unlike infections by fungi, oomycetes and insects, there are no chemical treatments for these pathogens, and breeding for disease resistance has been minimal, making it necessary to control disease through crop inspections and certification of the resulting seed potatoes (Czajkowski et al., Reference Czajkowski, Perombelon, van Veen and van der Wolf2011). Crop inspection requires a person(s) to walk through potato fields and visually identify and record plants showing signs of disease. However, this is very time consuming, it increases the chance of damage to the crop canopy, disease plants can be difficult to identify (especially if symptoms are not yet developed or in the early stages), and their spatial distribution is difficult to assess. The latter, which is currently not carried out, would be particularly useful in modelling disease spread (Skelsey et al., Reference Skelsey, Elphinstone, Saddler, Wale and Toth2016). The outcome of a crop inspection is central to certification and determines the overall grade (and therefore the price) of a seed crop, and allows growers to make decisions regarding the best way to store and subsequently sell the crop, as well as manage it in future generations.
Remote sensing using UAVs offers an opportunity to overcome many of the limitations in crop inspection and as they have already been used in studies covering a wide range of crops (Zhang & Kovacs, Reference Zhang and Kovacs2012; Shahbazi et al., Reference Shahbazi, Théau and Ménard2014), including canopy damage (Zhou et al., Reference Zhou, Pavek, Shelton, Holden and Sankaran2016) and disease detection in potatoes (Suigiura et al., Reference Sugiura, Tsuda, Tamiya, Itoh, Nishiwaki, Murakami and Nuske2016), so they could help to reduce the impacts of this economically important disease. UAVs equipped with COTS digital cameras are typically used and can be effective sensors when assessing green vegetation using vegetation indexes (Rasmussen et al., Reference Rasmussen, Ntakos, Nielsen, Svensgaard, Poulsen and Christensen2016) and due to their excellent spatial resolution (<5 cm per pixel) and price point, are more likely to be adopted for precision agriculture applications compared to more expensive traditional aerial platforms and satellites (Zhang & Kovacs, Reference Zhang and Kovacs2012).
The ability to remotely sense a scene at very high spatial resolutions allows the detection of features such as plant emergence (a potential indicator of disease if delayed), which in turn means that analysis can be conducted at the individual plant level as opposed to the drill or plot level, allowing much finer analysis which is more akin to how traditional crop inspection is carried out. This paper investigates the effectiveness of using a UAV with dual COTS cameras, in order to identify the onset of disease within a trial crop of potatoes. It shows the initial results from a single set of data that was collected as part of a larger project conducted over the 2016 growing season.
Materials and methods
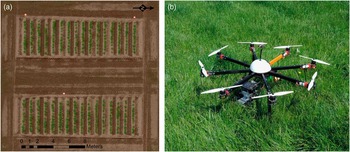
The trial plots used for this experiment were located to the west of Perth, Scotland and were part of a set of varied trial plots designed to show either different potato varieties or treatments as part the Potatoes in Practise 2016 display to the public that is held every year (http://www.hutton.ac.uk/events/potatoes-practice-2016). Planting occurred on 5/5/2016 and the trial was composed of 2 plots of 16 drills, each drill containing 12 tubers that had all been exposed to blackleg (Pectobacterium atrosepticum) bacteria in order to demonstrate best practise tuber storage and haulm destruction methods (Figure 1a). A visual assessment (ground truth) was carried out on 14/7/2016 to show the presence or absence of disease for each emerged plant and detailed the disease symptoms displayed at that time.
(a) The trial plot layout on 21/6/2016; (b) The custom built Vulcan multi-rotor UAV.

Aerial data acquisition
Aerial data was acquired in 2016 on May 27th (pre-emergence), June 2nd, 7th, 13th, 21st and 26th, July 6th, 11th, 19th and 29th., at varying times of the day and environmental conditions (bright sunlight~overcast). Data was acquired using a pre-programed automatic flight at 35 m above ground level (AGL) in order to give data at 1 cm ground sampling distance (GSD). The imagery collected had an expected image overlap of 62% and side overlap of 87% and georectification of imagery was assisted by the placement of nine ground control points (GCP) surveyed using a Piksi (Swift Navigation, San Francisco, USA) real-time kinematic global positioning system (GPS) with an expected accuracy of ±13 cm. The UAV used was a custom built multi-rotor utilising eight rotors controlled via a 3DR Pixhawk autopilot running Arducopter (v3.2.1) firmware (3D Robotics, Berkeley, USA). The autopilot has an inbuilt inertial measurement unit, barometer, magnetometer and an external GPS for navigation. This was housed in a 1 m diameter Vulcan octocopter frame (VulcanUAV, Mitcheldean, UK, Figure 1b) and powered by two 14.8 V, 10,000 mAh lithium polymer batteries to give flight endurance of 14 minutes whilst carrying the dual camera payload of ~320 g.
Camera system
The camera system comprised of two Canon A2200 (Canon, Tokyo, Japan) COTS cameras, one un-modified (RGB) and one modified to sense NIR wavelengths of light in its blue channel due to the removal of its internal NIR filter and the addition of an acrylic 585 nm long pass filter (Knight Optical, Harrietsham, UK). The spectral sensitivity of the cameras was tested to identify their spectral characteristics (Berra et al., Reference Berra, Gibson-Poole, MacArthur, Gaulton and Hamilton2015) and used the Canon hack development kit modified firmware (v1.2; http://chdk.wikia.com/wiki/CHDK) and the KAP UAV exposure control script (v3.1; http://chdk.wikia.com/wiki/KAP_UAV_Exposure_Control_Script) to enable RAW imagery to be acquired when commanded via the autopilot, allowing shutter speed and ISO to vary within a specified range (1/200~1/2000 s and 200~400 ISO respectively). The internal neutral density filter was not used, the aperture (f 2.8) and zoom level (default) were fixed with focus set to infinity and the white balance was calibrated against a grey card before each flight to give good visual results.
Image processing
The RGB and NIR RAW imagery was initially processed using CHDKPTP (http://chdk.wikia.com/wiki/PTP_Extension) to remove hot pixels and then processed using a custom script in ImageJ (v1.49k; Schindelin et al., 2012) that converted each image to a 16 bit linear tagged image file format (TIFF) file (white balance set to 1, no gamma correction) using DCRAW (v9.25; Coffin, Reference Coffin2016), which utilised a dark image of the same ISO and shutter speed in order to reduce dark current signal noise. Each image was the smoothed using ImageJs despeckle filter to further remove noise before PTLens (v9.0; Niemann, Reference Niemann2016) was used to correct lens distortion and crop each image to reduce the worst areas of vignetting. The RGB RAW imagery was processed a second time to produce a better visual set of data (VIS) in 16 bit TIFF format (gamma corrected, white balance as set for each flight, utilised highlight recovery options) and sharpened using ImageJs sharpen filter. The TIFF files were geotagged using the GPS information from the UAVs flight log and all three sets of data were then processed using Agisoft Photoscan (v1.2.5; Agisoft LLC, St. Petersburg, Russia), using high settings with mild depth filtering to produce a georeferenced orthomosaic for each dataset (RGB, NIR and VIS) plus a digital surface model (DSM) derived from the RGB dataset.
Manual image analysis method
ArcGIS (v10; ESRI, Redlands, USA) was used to assess the data in both true and false colour. For each date, a plant emergence point was added if the assessor was satisfied it was valid (not noise) and that plant was then marked as diseased at a later date if the assessor believed that signs of disease were showing (discolouration, canopy loss or stunting). The assessor could go back in time through the data but not forward beyond the date they were currently investigating.
Automatic emergence analysis
A region of interest (ROI) was created across the top of each drill from a 15 cm buffer of a line drawn along the centre of each drill that covered each point of planting. A normalised difference vegetation index (NDVI; Rouse et al., 1974) layer was created and thresholded manually for each date to delineate vegetation from soil. A model was formed in ArcGIS that created vegetation and soil polygons from the NDVI layer of the date being processed, clipped to the ROI. Any vegetation polygons not classed as vegetation in the following sensing date were erased (as these were most likely invalid), before the centre of each remaining vegetation polygon was marked as an emergence point. A buffer of 2 cm per day (between the current and following date) was then applied to the remaining vegetation polygons to simulate the growth of that plants canopy between sensing dates. Each subsequent date was processed using the same method, except that any new emergence points were ignored if they were within the vegetation buffer of the previous sensing date (as these were most likely the same plant). This process was repeated until no new emergence points were discovered across all of the drills.
Automatic disease detection
The data for each date was classified using the OBIA software InterImage (v1.43; Camargo et al., Reference Camargo, Almeida, Costa, Feitosa, Oliveira, Heipke and Ferreira2012), using the NDVI thresholds already set and utilising the TA_Arithmetic operator to denote vegetation (=>NDVI threshold), areas of shadow (Red+Green+Blue+NIR\4<=2000) and potato flowers (<NDVI threshold, Brightness=>15,000). Vegetation and potato flowers were combined and shadows removed to give the total vegetation for each sensing date. All of the emergence points previously detected were buffered by 7.5 cm in order to create emergence point regions of interest (eROI) and as each eROI could contain more than one emergence point, the centre of each eROI was marked as the location of a plant. Plant regions of interest (pROI) were then created by delineating an area around each plant point using Thiessen polygons, clipped to a maximum of 60 cm from each plant point (pROI are essentially the growing space allocated to each plant). Another model was built in ArcGIS that identified the change in vegetation within each pROI between successive sensing dates and the total vegetation cover within each eROI for each sensing date. A plant was marked as diseased if it showed a reduction of 6% or more within its pROI between successive dates, or if it showed a change greater than −6% but less than 12% in its pROI and its eROI showed less than 99.9% cover (a possible indicator of the breakup of the canopy).
Results
Measures of accuracy for detecting emergence and disease used error matrices to produce Kappa coefficient values that consider the actual agreement between classes whilst taking into consideration the possibility of agreement by chance, with values of 0.85 or higher being considered as an effective level of accuracy (Foody, Reference Foody2002).
Emergence
The ground truth conducted on the 14/7/2016 identified two extra plants (left over tubers had been planted) and one non-emerged plant (potentially caused by early black leg infection), giving an expected 385 emerged plants. Three hundred and eighty-five emerged plants were detected using both methods however two cases of non-emergence and three extra plants were discovered. From the manual method, 69% of the plants had emerged by the 2/6/2016 and all plants had emerged by the 13/6/2016. The automatic method differed slightly as it identified 13 plants at an earlier date and 7 later (the last on the 21/6/2016) but the emergence identification per date accuracy was high, with a TA of 95%, and K of 0.88.
Disease detection
As the emergence analysis detected anomalies with the ground truth and remotely sensed data that extended beyond the ground truth date, it was decided to show accuracies of disease detection against both the original (GT) and an amended ground truth (AGT) that accounted for the emergence anomalies and plants that showed obvious signs of disease on the 19/7/2016. By the 14/7/2016 the ground truth had identified 85 diseased plants, which rose to 98 after the amendments for the 19/7/2016, with both the manual method (MAN) identifying 80 and the automatic method (AUTO) identifying 75 by the 19/7/2016 (all excluding the cases of non-emergence). Disease detection accuracies for both methods can be seen in Table 1, but when comparing GT vs MAN, 14 plants were false positives and 19 diseased plants were missed, however there were 0 false positives and 18 missed diseased plants when comparing AGT vs MAN. The comparison between GT vs AUTO revealed 20 false positives and 30 missed diseased plants, which changed to 10 false positives and 33 missed plants when comparing AGT vs AUTO.
Disease detection accuracy of manual (MAN) and automatic (AUTO) methods versus original (GT) and amended ground truth (AGT), showing expected number of diseased plants (E), observed number of diseased plants (O), correctly identified diseased plants (C), Producers (PA), Users (UA) and Total accuracy (TA), along with Kappa statistic

As the remotely sensed data extended until the 29/7/2016, comparisons were also made to determine how well the automatic method compared to the manual (with the manual method effectively being the ground truth). When looking simply at the presence of diseased plants by the 29/7/2016, 18 false positives were detected and 29 diseased plants missed, with UA 83%, PA 75%, TA 88% and K 0.70. However, when looking at the presence of diseased plants per date the accuracy diminishes (TA 79%, K 0.57) as the automatic method tends to not detect disease until the date following manual method detection.
Discussion
From the emergence results it can be seen that a simple automatic method based on a detection threshold can prove effective, however in this trial the tubers had been placed by hand and so were well spaced, plus weed control had been effective with practically no non-potato vegetation present within the emergence period. Spacing of tubers and weed control are important factors to ensure effective growth within the crop (Bussan et al., Reference Bussan, Mitchell, Copas and Drilias2007), but less optimal conditions in these factors may decrease the effectiveness of automatic detection. When visually assessing the imagery for emergence and diseased plants, the high resolution and ability to quickly view before and after images of the same drill aided the assessor and allowed judgements to be made with a good level of accuracy that would likely improve as the assessor became more experienced. However this would likely be a tedious over a much larger number of plots and is still not as effective as performing a ground assessment especially as only damage to the canopy can be detected, which are often symptoms shown in the later stages of disease such as blackleg (Czajkowski et al., Reference Czajkowski, Perombelon, van Veen and van der Wolf2011).
The automatic method for disease detection needs to be improved before it could be said that it could be truly useful, and one major area that was missing was the use of the DSM to show the heights of vegetation within each drill. Issues were encountered when trying to process the DSM into height data (too much variance) that could have been due to not using enough GCPs or the accuracy of the Piksi GPS not being sufficient. If it had been good enough to use then it may well have improved the accuracy of the automatic method as a loss in canopy height could also indicate the presence of disease. Height data could also help discriminate between two connected potato plant canopies and may be a more effective method than delineating hard boundaries using Thiessen polygons, especially as some of the missed diseased plants were due to their neighbours spreading into the pROI of a diseased plant, confusing the analysis. The operator used as part of the OBIA of the drills is essentially just thresholding the data and so barely used the potential power of analysis that is available. This route was taken as the model is to be further tested and improved against data from different trials that had been collected at the same time, where the presence of weeds poses a significant challenge compared to this trial.
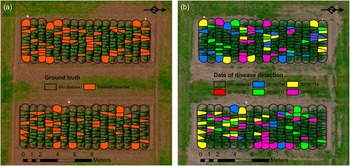
Data collection using a UAV is fairly swift compared to visually inspecting a crop on the ground and ideally surveys should be carried out regularly, especially to capture the emergence period before canopy closure. However processing does take time and in this case the use of RAW imagery made for lengthier processing. RAW was preferred as it allows much more flexibility in how an image is reproduced, allowing linear transformations that are more applicable for quantitative analysis and much better highlight recovery for visual analysis (Verhoeven, 2010). Ideally surveys should be conducted on days with stable ambient light conditions (Rasmussen et al., Reference Rasmussen, Ntakos, Nielsen, Svensgaard, Poulsen and Christensen2016) however this is not always possible if trying to collect data regularly, meaning some datasets might be of lesser quality but still more useful than not having any data at all. The datasets were manually thresholded as efforts to normalise brightness across datasets was not satisfactory so the use of automatic thresholding, as demonstrated by Rabatel et al. (Reference Rabatel, Gorretta and Labbé2014), will be investigated in the future to see if it can separate potato canopy from the soil effectively. As can be seen in Figure 2 (a, b), being able to visualise the spread of the disease over time within drills could be advantageous in understanding the start and spread of disease within a drill and its neighbours (Skelsey et al., Reference Skelsey, Elphinstone, Saddler, Wale and Toth2016) and having image data covering the entire growing period allows for cross referencing with ground based data, potentially improving trials analysis.
(a) Disease detected from the ground truth (14/7/2016); (b) Disease detected per date until 29/7/2016 using the manual assessment method.

Conclusions
Visual analysis of UAV derived aerial imagery using COTS digital cameras is an effective method of detecting disease but not the specific infection. Automated analysis could help flag up potential points of disease but are not yet sensitive enough to be completely relied upon.
Acknowledgments
S Gibson-Poole would like to thank Scotland’s Rural College for funding his PhD.