1 Introduction
During the recent debate on the fiscal sustainability of the United States Social Security system, pundits and researchers alike devoted significant time discussing the role of risk in system reform proposals and in retirement behavior in general. While this focus is certainly warranted, the discussion often missed important differences in risk across observable characteristics and, most importantly, across the earnings distribution. In this paper, we examine two Social Security policy proposals that would impact workers across the lifetime earnings distribution differently. We link both of these possible system changes to supplemental financial data to explore overall risk at different points in the lifetime earnings distribution. We also use survey data to show that workers in the lowest quintile are probably less willing to tolerate risk than others in the distribution.
In the first of two policy proposals, we introduce a minimum benefit to all qualified beneficiaries at the bottom of the earnings distribution. This minimum benefit insures that all workers will have at least some minimum level of benefits in their retirement years, regardless of their past or current financial situation. The second policy proposal we evaluate introduces individual accounts to the traditional Social Security system. These accounts are designed to give each worker an individual account with which to control investment of part of their payroll taxes in stocks and bonds. Yet, as with any proposal that hopes to provide higher returns, higher risk is inherent, and workers at different points in the lifetime earnings distribution will be able to tolerate such risk differently. In some ways, these two policies represent two core philosophies of the Social Security system. The minimum benefit proposal targets greater financial security for those at the bottom of the distribution. The individual account proposal, however, embraces the philosophy that workers should have more direct control over their own Social Security finances; the individual accounts therefore, are more likely to help those at the top of the earnings distribution. Both policy proposals are designed with sustainable solvency in mind and are constructed so that the ratio of the Social Security trust fund to annual outlays (the trust fund ratio) is stable by the end of the projection period.
To estimate Social Security system finances, we use a microsimulation model that generates individual demographic and economic characteristics for a representative sample of the US population. This microsimulation model allows us to generate earnings histories and future streams of benefits for each worker in the simulated economy and to examine how low-earning Americans will fare in retirement. Further, by simulating the model using Monte Carlo methods, we are able to assess the level of risk in the existing system and under the two proposals.
The microsimulation model is also capable of estimating system finances stochastically, enabling us to build confidence intervals around median estimates. Such distributional capabilities enable us to demonstrate both uncertainty in the projections and differences in risk that workers would face upon retirement. Using Survey of Consumer Finance data, we quantify the total potential retirement funds available to beneficiaries at both ends of the earnings distribution and show how these proposals affect the level of risk faced by both.
This analysis adds to the existing literature on changes to the Social Security system and assessments of risk by using a large microsimulation model in conjunction with survey data on preferences for risk.Footnote 1 Few are able to simulate the sort of demographic and economic trends available in the microsimulation model; the analysis thus assesses the potential tradeoffs between distributional outcomes under these two proposals and the tolerance for risk at different points in the earnings distribution.
There exists a long literature that evaluates the risk associated with savings behavior, especially as it relates to retirement and Social Security. A number of papers in this area focus on the introduction of individual accounts to the Social Security system and the flurry of political action in 2005 highlighted many of these ideas. At the time, some of the proposals incorporated minimum benefits, benefit guarantees, or combinations of a variety of items (Diamond and Orszag, Reference Diamond and Orszag2004; Pozen, Reference Pozen2005; MacGuineas, Reference MacGuineas2005; Liebman et al., Reference Liebman, MacGuineas and Samwick2005); some focused on Social Security Disability Insurance (Autor and Duggan, Reference Autor and Duggan2006) or the Supplemental Security Insurance program (McGarry, Reference McGarry, Martin and Jeffrey2002); still others examined proposals that would modify behavior affecting system inputs, such as trends in work and earnings behavior (Butrica et al., Reference Butrica, Smith and Steuerle2006; Steuerle, Reference Steuerle2005) or spousal and survivor benefits (Holden, Reference Holden, Olivia, Robert and Howard1999). There is also a wide variety in the proposed type of individual account: some proposals – the Kolbe–Stenholm Twenty-First Century Retirement Security Act (Kolbe and Stenholm, Reference Kolbe and Stenholm2002) and the 2001 President's Commission to Strengthen Social Security, for example – would direct a portion of the existing Social Security tax towards an account held in the worker's name (a ‘carve-out’). Others have suggested individual accounts that add to the traditional benefit structure, with contributions that are either voluntary or mandatory (Feldstein and Liebman, Reference Feldstein, Liebman, Martin and Jeffrey2002; Tanner, Reference Tanner2004). Still other researchers have examined the combination of individual accounts with benefit guarantees, benefit floors, or hybrid plans (Congressional Budget Office, 2006c; Sununu, Reference Sununu2005; Biggs et al., Reference Biggs, Burdick and Smetters2006).
Finally, there exists a body of research on the distributional impacts of Social Security and proposed changes to the system. Coronado et al. (Reference Coronado, Fullerton and Glass2000) examine the progressivity of the system by using lifetime earnings histories from the Panel of Study of Income Dynamics, and by introducing different features to the system (such as different measures of income or discount rates) they show that the current system does a poor job of redistributing funds from rich to poor. Liebman (Reference Liebman, Martin and Jeffrey2002), on the other hand, uses the Survey of Income and Program Participation to analyze the progressivity of the Social Security system by simulating behavior for the 1925–29 birth cohort; he finds evidence of a progressive system in some measures but a regressive system in others. Further, he shows the nearly 20% of people in the top lifetime income quintile receive benefits that are greater than the average in the lowest lifetime income quintile. Recent research (Congressional Budget Office, 2006b) has further demonstrated the progressivity of the system, largely driven by disabled-worker and auxiliary benefits.
There are perhaps two central points of contention in the debate over individual accounts. The first involves the very nature of the system and how it should go about serving the retirement needs of working Americans. Should Social Security be a form of insurance, redistribution, or investment? The second question is whether Social Security benefits would be higher were they invested in the stock market. The issue here is risk: investments that yield higher returns are inherently going to have higher levels of risk. The nature of that risk is difficult to quantify, and research continues to investigate the premium associated with investing in equities (Zeldes, Reference Zeldes1989), the nature of investing in individual accounts (Munnell and Sass, 2006), and the potential transition costs of moving from the existing system to one with accounts (Feldstein and Samwick, Reference Feldstein, Samwick and Martin1998). Individual account opponents point to these risks as reasons not to add such accounts and maintain the traditional system. Proponents, however, argue that such a policy change enables workers to have greater control over their Social Security taxes and treat them as investments. While both sides debate potential risks and returns from individual accounts, it is important to note that the existing system also has risk: uncertain demographics, earnings histories and worker behavior makes projections of the system difficult to quantify precisely. As such, our estimates utilize the stochastic feature of our model to measure the level of uncertainty inherent in Social Security projections (Congressional Budget Office, 2005b; Harris et al., Reference Harris, Sabelhaus and Simpson2005).
The paper begins with a description of the model and the distributional measures of benefits. This is followed by a specific description of the minimum benefit and individual account proposals and an evaluation of the long-run solvency. The fourth section evaluates the range of potential benefit levels and how these benefits fit into a larger picture of total retirement funds.
2 Modeling Social Security
To project Social Security outcomes over the next 100 years, we use a microsimulation model that projects demographic features such as marital status, childbearing, education, mortality, health, and disability. The model also includes modeling of individual economic behaviors such as labor force participation rates, hours worked, full-time or part-time status, benefit claiming behavior, and earnings (see Congressional Budget Office, 2006a). One advantage of the model is that it creates a lengthy series of demographic and economic information for each worker and beneficiary. Thus, it can accommodate significant micro variation and uncertainty from year to year and scenario to scenario (see also Sabelhaus and Topoleski, Reference Sabelhaus and Topoleski2006; Congressional Budget Office, 2005a). Using this variation and uncertainty, we are able to model each process stochastically: the model uses 500 Monte Carlo simulations to generate probability distributions for a set of demographic and economic outcomes (Congressional Budget Office, 2005b).
The stochastic model integrates elements from the microeconomic and macroeconomic components of the model. The main stochastic variables include disability incidence and termination, real wage growth, unemployment, inflation, and mortality. These elements feed into the individual demographic and economic outcomes, such as marital status, disability status, and earnings, to generate individual Social Security benefits and taxes, as well as overall system finances.Footnote 2
Distributional measures of benefits
The root data file for the microsimulation model is the Social Security Administration's Continuous Work History Sample (CWHS), a one-in-one-hundred sample covering every Social Security number ever issued. While the CWHS provides a more accurate picture of earnings than other public data sets, it lacks comprehensive demographic information on the worker, a problem overcome by using various imputation and calibration processes using data from the Social Security Administration, the March Current Population Survey, the Survey of Income and Program Participation and a number of other sources (see Congressional Budget Office, 2006a). The process of matching demographic information to administrative earnings records generates annual earnings, taxes paid, and benefit information for each individual in the model over each person's lifespan.
To compare the change in benefits of the current system to those under the individual account and minimum benefit proposals, we measure the lifetime stream of benefits received by the individual, including any benefits received as a spouse or survivor.Footnote 3 Lifetime benefits reflect the individual's total receipt from the system and are a function of lifetime earnings, longevity and age of initial claim. The measure also captures potential phased-in changes in policy proposals – a tax cut or benefit enhancement that is slowly introduced over a ten- or 15-year span will not be fully captured by benefits measured at a single point in time.Footnote 4 Using the stochastic feature of the model, we also build an 80% confidence interval (by reporting the 10th and 90th percentile points) around the median estimate. Such distributional outcomes are an improvement over many analyses of the Social Security system, which rely on a ‘representative worker’ in a more general framework.
Other retirement finances
To place the microsimulation estimates in a broader context, we use pension data from the Survey of Consumer Finances (SCF) to construct a picture of total available retirement funds. The SCF is a triennial survey of roughly 4,000 households recording a wide array of income, wealth, pension, and balance sheet information. Like other survey data, the SCF is subject to non-response bias and missing data issues; however, it is also known to do a good job of capturing the upper tail of the wealth distribution (Poterba and Samwick, 1997). For purposes of this exercise, we combine all six available SCF files (1989, 1992, 1995, 1998, 2001, and 2004) and place people into ten-year birth cohorts. Four measures of retirement funds are used in the analysis: the cash value of life insurance; other pensions (e.g., defined benefit plans); thrift pension plans, such as 401(k)s, 403(b)s and cash-balance plans; and IRAs, including Keoghs.Footnote 5 Each variable is deflated to 2006 dollars using the Consumer Price Index for Urban Wage Earners and Clerical workers (CPI-W) (as in the microsimulation model) and then, using a 3% real discount rate, is converted to the future value when the respondent turns 65. Mathematically

where the p subscript refers to each of the four pension variables. Using these four variables paints an admittedly limited picture of total retirement funds as we do not include other forms of savings such as checking and savings accounts, mutual fund or stock holdings, nor do we include possible earnings from work during retirement. We also do not include other non-monetary forms of compensation retirees may hold such as retiree health insurance, or measures of wealth such as housing. Given findings in other strands of literature of the distribution of such sources of retiree income and wealth, we suspect that these additional sources would further exacerbate the findings demonstrated below. Furthermore, given our variable selections, the distribution of funds does reflect those found elsewhere (Social Security Administration, 2004) and demonstrates the importance of looking at least at some other forms of available retirement savings.
3 Long-run solvency of Social Security
In order to compare the individual account and minimum benefit proposals to the existing system and address the projected future insolvency of the Social Security system, we first determine whether each is sustainably solvent; that is, we determine whether the trust fund ratio – the ratio of the trust fund balance to annual outlays – is flat at the end of the 100-year projection period (Lee and Yamagata, Reference Lee and Yamagata2003). Having established that each proposal is sustainably solvent under this definition, we can compare the different impacts on a level playing field.
Introducing individual accounts to the Social Security system
The projected path of the current Social Security system will result in an insolvent system in about 40 years. This baseline environment can be evaluated in two ways: first, as ‘scheduled’ benefits, where benefits are paid in full regardless of the current state of the trust fund. When the trust fund is empty, benefits would be paid by revenues from outside the Social Security system or by additional borrowing. Under the second interpretation, equal benefit cuts are applied to all beneficiaries when the trust fund falls to zero; this is the ‘payable’ benefits scenario. In this case – a scenario that is by definition sustainably solvent – benefits are cut by 21% when the trust fund is exhausted around 2050.Footnote 6, Footnote 7
In the first of our two policies – the minimum benefit proposal – low earning workers (who have worked for at least 20 years) receive a phased-in increase to their Primary Insurance Amount (PIA) equal to 40.4%. The phase-in begins in 2009 and is fully in place by 2018.Footnote 8 The increase is designed to give these workers a minimum benefit that is equal to 140% of the (real-dollar value) poverty line. Additionally, benefits are indexed for longevity to account for longer life expectancies.Footnote 9 In addition to these two benefit adjustments, all workers receive a one-time benefit cut of 19% in 2013 in order to make the system sustainably solvent.Footnote 10
The second policy proposal adds individual accounts (SSIAs) to the traditional Social Security system. Under this plan, SSIAs would be created in 2013, and workers born after 1958 (hence, only affecting those currently under 55) would have 2% of their payroll taxes diverted into the accounts; benefits would then be offset with a notional account. The notional account is an accounting device: a ‘mirror’ deposit is made in the individual's notional account and, for our purposes, is also assumed to grow at the same Treasury rate. Thus, the individual's actual benefit equals the scheduled (traditional) benefit plus an annuity from the individual account minus an annuity from the notional account. Additionally, benefits are indexed for longevity to account for longer life expectancies.
In order to make the system sustainably solvent under the SSIA plan, the individual accounts are accompanied by a one-time, across-the-board benefit cut of 15% in 2013. The SSIAs are assumed to be invested in a custom portfolio of 50% equities, 30% corporate bonds, and 20% Treasury bonds. For simplicity, these SSIAs have been constructed with the following characteristics: the 2% of diverted payroll taxes is applied equally to all payroll up to the taxable maximum; workers are not allowed to make additional voluntary contributions to the accounts; there are no allowances for early withdrawals from the accounts; and all account distributions would be taxed as if they were traditional Social Security benefits.Footnote 11 Workers will recoup some (or all) of this cut in the traditional benefit with proceeds from their individual accounts.
Social Security trust fund ratios
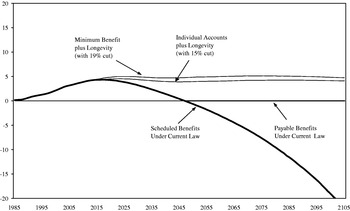
We rely on the ratio of the Social Security trust fund to annual outlays to assess the overall fiscal sustainability of the system. The bold line in Figure 1 shows the path of the trust fund under the existing system, and is projected to rise from about 3.3 in 2006 to a peak of 4.4 in 2017. As workers from the baby boom generation retire and draw benefits from the trust fund, the ratio falls steadily, eventually reaching zero in the middle of the century. Under the payable benefits scenario, where only those funds that exist in the trust fund are paid to beneficiaries, the trust fund ratio is flat over the latter half of the projection period, necessarily making it sustainably solvent.
Social Security Trust Fund Ratios, 1985–2105

Trust fund ratios for the two policy proposals are also shown in Figure 1. The proposal that introduces a minimum benefit (with longevity) plus a one-time 19% benefit cut generates a trust fund ratio that continues to increase after the hump under the payable scenario, but is then flat over most of the period at just under 5. The trust fund ratio for the individual accounts plan declines at the introduction of the plan in 2013 as money is moved out of the trust fund into individual accounts. The ratio then declines between 2013 and 2045 before rising slightly over the latter half of the decade, ultimately stabilizing at about 4. The relative positions of the three trust fund ratios demonstrate the sensitivity of the Social Security system to different types of changes and are illustrative of the benefit cuts necessary to put the system on a sustainably solvent path.
4 Assessing the impact of Social Security reforms on low earners
Having established that both the minimum benefit and the SSIA policy proposal are sustainably solvent, this section evaluates the lifetime benefits received for the lowest and highest lifetime earnings quintile by ten-year birth cohort. We focus on stochastic model results in order to demonstrate the sensitivity of the projections to future uncertainty and the differences in the estimates for workers in different parts in the earnings distribution. The lifetime benefit measures are then compared to pension data from the Survey of Consumer Finances to assess the overall distribution of retirement funds for retirees at the top and bottom of the distribution.
Lifetime benefits
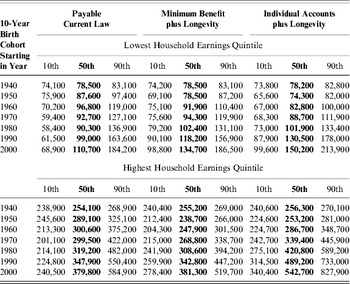
Under the existing system, lifetime benefits for low earning workers slowly increase between the 1940s, 1950s, and 1960s birth cohorts (Table 1). When the trust fund exhausts and benefit cuts are required, lifetime benefits fall beginning with the 1970s birth cohort. Such declines are less pronounced at the top of the distribution where benefits decline only slightly between the 1960s and 1970s cohorts. The rise in lifetime benefits for the last two cohorts under consideration (the 1990s and 2000s) – at both ends of the distribution – reflects higher real earnings and improved longevity.
Lifetime Benefits for Workers in the Lowest and Highest Lifetime Earnings Quintiles, by Birth Cohort with Confidence Intervals

In running the model stochastically, we are also able to estimate the 10th and 90th percentiles of the lifetime benefits for each cohort. The range of values shows significant uncertainty in the projection of lifetime benefits and illustrates the potential risk that is inherent even in the existing system. Obviously, the level of uncertainty grows as a greater portion of each cohort is projected; for example, the range of benefits for low earners in the 2000s cohort spans $115,000 compared to a $9,000 difference for the 1940s cohort where there is less uncertainty in demographics, earnings, and retirement estimates. Further, this range is larger for beneficiaries at the top of the distribution than for those at the bottom, although on a percentage basis the ranges are approximately the same at both points of the distribution.Footnote 12
The minimum benefit proposal would directly affect low-earning workers and even with a longevity index and a sustainably solvent 19% benefit cut, serves to increase benefits for low earning workers relative to the current system. Under the minimum benefit proposal, benefits are lower for the 1950s and 1960s birth cohorts – these beneficiaries are generally hit hardest by the one-time benefit cut and do not have enough time remaining in retirement to fully realize the minimum benefit enhancement. In more recent birth cohorts, however, benefits under the minimum benefit plan are higher than under the current system.
While lifetime benefits for those at the bottom of the distribution increase under the minimum benefit proposal, benefits fall for almost every cohort at the top of the distribution. This implies that the one-time benefit cut at trust fund exhaustion has a large impact on these workers. In fact, while on average the ratio of lifetime benefits between the top and bottom of the distribution is about 3.3 under the payable scenario, the same calculation shows a smaller 2.9 ratio of under the minimum benefit proposal. This shift demonstrates how the minimum benefit proposal makes the system slightly more progressive in nature by raising benefits at the bottom and decreasing benefits at the top. At the same time, the uncertainty in the system is lowered under the minimum benefit proposal (the 10th percentile is higher and the 90th percentile lower for both points and nearly all birth cohorts) because the benefit cuts effectively decrease the size of the system and hence lower the level of uncertainty in the projections.
The individual account proposal generates significantly larger differences in lifetime benefits relative to the payable scenario. The combination of a 2% SSIA benefit carve-out and the one-time benefit cut in 2013 results in a large decline in lifetime benefits for earlier cohorts (prior to 1980) because these workers receive the full benefit cuts over the 2013–2028 period but receive a relatively small annuity from their SSIAs. Later cohorts – those born after 1980 – appear better off than previous cohorts because the relative benefit cut is smaller and they have also begun to receive benefits from their SSIAs. Later cohorts in the higher lifetime earnings quintiles receive much larger benefits than workers in other parts of the distribution, receiving 34% higher benefits under the SSIA proposal than in the payable scenario. Lifetime benefits for workers in the lowest earnings quintile meanwhile, receive total benefits that are 18% higher than in the payable scenario.
The addition of individual accounts to the existing structure introduces a level of uncertainty to lifetime benefits that is not uniform across the distribution. As an example, take those born between 2000 and 2009: the gap between the 90th and 10th percentile values for the bottom quintile is $115,300 in the current system and $114,300 with SSIAs. At the top of the distribution, however, the same gaps are $344,400 and $487,500. The ratio of the two – 3.0 and 4.3 – further demonstrates the unequal treatment of risk and uncertainty between the two earnings quintiles. Thus, while SSIAs could yield significant gains to beneficiaries at both ends of the distribution, the range of benefits – and hence the additional risk inherent in the SSIAs – is significantly larger for those at the top of the distribution than for those at the bottom.
Distribution of retirement funds
Having shown that lifetime benefits are significantly higher for those at the top of the lifetime earnings distribution (under any of the proposals), this section looks at the entire distribution of retirement funds available to workers upon retirement. We combine the lifetime benefit estimates from the microsimulation model with pension and savings data from the Survey of Consumer Finances (SCF) to demonstrate how the disparate levels in lifetime Social Security benefits are only part of the overall story of differences in retirement funds across the earnings distribution.
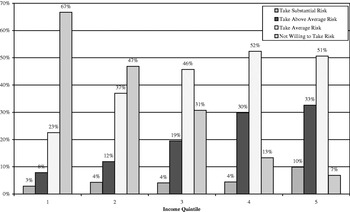
It is interesting to note that the level of financial risk workers are willing to face is clearly a function of the worker's place in the income distribution. In Figure 2, we tabulate, by income quintile, the level of risk workers report taking with their investments from the 2004 SCF.Footnote 13 Over two-thirds of respondents in the bottom income quintile report that they are unwilling to take any financial risk; only 3% of low-income respondents report taking substantial risk. The distribution of risk basically reverses as one moves up the income distribution: 10% of respondents in the top quintile report taking substantial risk with their investments, while only 7% report taking no risk at all.
Amount of Financial Risk, by Income Quintile

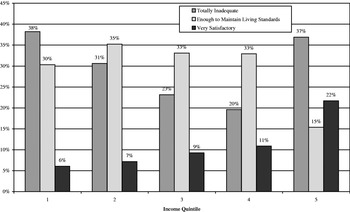
The level of risk workers are willing to face is also demonstrated in Figure 3 where we tabulate how workers view the adequacy of Social Security benefits and pensions.Footnote 14 The results are similar to those found in Figure 2: workers at the bottom of the distribution are more likely than most other workers to find these retirement benefits ‘totally inadequate’, while those in the top quintile are more likely to find them ‘very satisfactory’. Interestingly, approximately the same percentage of workers in the top and bottom quintiles said that they found these benefits ‘totally inadequate’, which suggests that, while high-income workers may not require these benefits to live in retirement, they still believe them to be low. This could reflect beliefs about the retirement system in general (i.e., the system is too progressive) or about their specific economic position when looking forward.Footnote 15
Adequacy of Social Security Benefits and Job Pensions

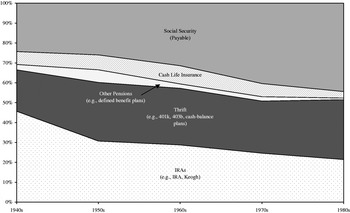
The differences in attitudes towards financial risk across the income distribution are also reflected in the distribution of total retirement funds. The distribution of retirement monies at the top and bottom of the distribution for each ten-year birth cohort are shown in Figures 4 and 5.Footnote 16 While workers in the top earnings quintile are more likely to take on more financial risk, Social Security benefits also make up a larger part of their total retirement package, having increased from 25% to 45% over the five birth cohorts shown in Figure 4. Thrift plans have grown as a share of the total pool over time, from 20% to 30%, while Individual Retirement Accounts (IRAs) and defined benefit plans have declined, mirroring trends found in the pension literature (Gale et al., Reference Gale, Papke and VanDerhei1999).
Distribution of Lifetime Retirement Funds for the Top Quintile, by Birth Cohort

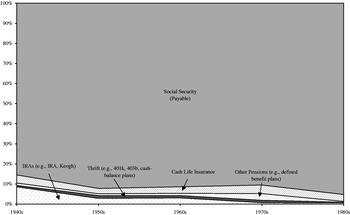
Distribution of Lifetime Retirement Funds for the Bottom Quintile, by Birth Cohort

The distribution is significantly different at the bottom quintile (Figure 5) where Social Security benefits account for more than 90% of total available funds. And while the share of IRAs has declined across these birth cohorts, cash life insurance, defined benefit, and thrift plans have remained relatively stable, accounting for between 4% and 6% of the total. Hence, workers at the bottom of the distribution, who are less likely to take on financial risk, appear to be more likely to rely on safer sources of income – Social Security benefits – as their primary source of retirement income.
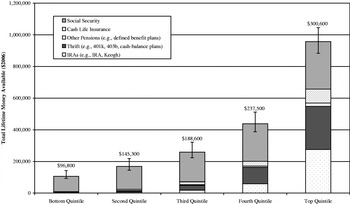
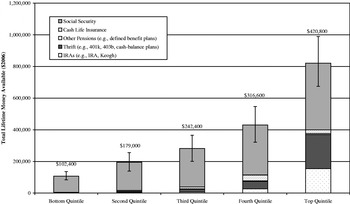
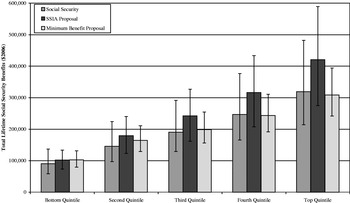
In Figures 6 and 8, we plot total lifetime retirement money for each earnings quintile for the 1960s and 1980s cohorts, categorized by source. These distributions mimic those found in the previous two figures but show the growth in both the level of funds and the changes of those funds across the distribution. The Social Security benefits shown in Figures 6 and 8 are total benefits for each quintile,Footnote 17 while in Figures 7 and 9 we show total benefits for each of the three proposals for each quintile.Footnote 18 Once again, the estimates in Figures 6 and 8 show higher levels of lifetime retirement money – for every source – for those at the top of the distribution. For the 1960s birth cohort, total lifetime retirement funds for high earners are nine times the level for those in the bottom quintile ($957,300 versus $105,900) and more than twice the level for those in the fourth quintile ($957,300 versus $437,800).
Total Lifetime Retirement Money Available, 1960s 10-Year Birth Cohort

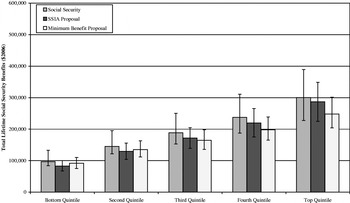
Differences in Total Lifetime Social Security Benefits, 1960s 10-Year Birth Cohort

Total Lifetime Retirement Money Available, 1980s 10-Year Birth Cohort

Using the results from the stochastic model, we have also drawn the 80% confidence interval around the Social Security benefits. While the range of these confidence intervals are directly related to position in the lifetime earnings distribution, they also demonstrate that for low earners the lower bound estimate of total Social Security benefits is a larger portion of total retirement income than for others higher in the earnings distribution. That is, using the 10th percentile stochastic results, those in the bottom quintile of the 1960s birth cohort (Figure 6) are left with a possible total retirement pool of under $80,000, while workers in the top quintile have nearly $900,000 in total available lifetime retirement monies. This discrepancy, while still as large as with the median estimates, shows how low-earning workers face higher risk with their retirement funds when Social Security uncertainty is taken into account.Footnote 19
Differences in Social Security benefits across the five quintiles for the 1960s cohorts (Figure 7) reinforce the differences shown for the top and bottom quintiles in Table 1. Benefits under the existing system are larger for all five quintiles in the 1960s cohort. Confidence intervals are drawn for each proposal and suggest more precise estimates for the minimum benefit and SSIA proposals (due to the longevity indexing). The top quintiles are unambiguously better off under any of the three proposals, but the differences are much more pronounced between the three proposals than for those at other points in the distribution.
The same decomposition for the 1980s cohort is pictured in Figure 9. Here, the confidence intervals are much wider (because more of this birth cohort is strictly projected as opposed to the 1960s cohort) with relative benefit levels that differ significantly. Beneficiaries at the bottom of the distribution see very little difference in lifetime benefits between the three proposals. Those at the top of the distribution, however, are clearly best off under the SSIA proposal, where their benefits are about 1.3 times as large as under either of the other two proposals. Further, the relative benefit levels under the minimum benefit proposal are higher than payable benefits for all but the top two quintiles, confirming that this proposal is shifting benefits from the top to the bottom of the distribution.
Differences in Total Lifetime Social Security Benefits, 1980s 10-Year Birth Cohort

5 Conclusion
In this paper, we have examined the impact of introducing two different policy proposals to the current Social Security system. In the current system, the trust fund is projected to exhaust around 2040; both the minimum benefit and SSIA proposals are designed to make the system sustainably solvent, while at the same time put the system on more solid financial footing. The comparison of lifetime benefits shows significant variation both across cohorts and across the lifetime earnings distribution. Yet the uncertainty inherent in such projections makes the stochastic microsimulation model used here an invaluable tool.
The combination of greater risk in the financial outcomes from the SSIA proposal and lower preference for risk suggest that a SSIA proposal of this sort would be unpopular at certain points in the earnings distribution.Footnote 20 The minimum benefit proposal, on the other hand, introduces significantly less risk to the system, but also has lower benefit payouts over the long term. The analysis also incorporated measures of model uncertainty by using the stochastic features of the microsimulation model, which serve to underscore the unknown positive and negative costs and benefits in the two proposals.
We have introduced four measures of non-Social Security retirement income available to retirees from the Survey of Consumer Finances. These measures served to further exacerbate the differences in total retirement funds across the lifetime earnings distribution. Looking at the full range of retiree income is an important part of evaluating the success of attempts at reforming the Social Security system.
Appendix: The microsimulation model
The model used for this paper is a dynamic microsimulation model of the United States population and economy. For each of the approximately 300,000 simulated individuals in the model, it simulates birth, death, immigration, marital transitions, marital pairings, labor force participation, hours, earnings, Social Security benefit claiming, and Social Security benefit levels. It was originally developed to model Social Security finances and to model the entire federal budget. However, it now also makes non-Social Security projections (other spending and revenues other than payroll taxes), though on an aggregated basis.Footnote 21
An individual's Social Security taxes and benefits are based on his or her earnings history, disability status, age, and the characteristics of the current (or possibly former) spouse. While working, a person pays Social Security taxes at a flat rate, up to a maximum amount. Eligibility for benefits is triggered by age or disability status and, in some cases, individuals receive benefits based on their spouse's earnings history, age, or disability status.Footnote 22
Although the rules are certain, individuals face uncertainty about their Social Security taxes and benefits because of uncertainty about their lifetime earnings and demographic outcomes. The nature of that uncertainty varies over an individual's lifetime. When young, people do not know whether they will be high earners or low earners, whether they will marry, or whether they will even live long enough to receive benefits. As people get older, some uncertainties are resolved – for example, people on the brink of retirement basically know what their Social Security benefit will be because they know their earnings history. However, they still face other uncertainties, such as how long they will live.
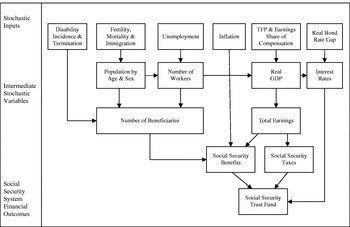
The list of input assumptions used in this Monte Carlo analysis of Social Security projections speaks directly to the types of uncertainty faced both by individuals and by the overall system (see Figures A1 and A2). The key demographic input assumptions that vary stochastically in the Monte Carlo simulations are fertility, mortality, net immigration, and rates of disability incidence and termination. The key economic inputs that vary stochastically are total factor productivity growth, inflation, unemployment, the relationship between interest rates and the return to capital, the share of compensation that shows up as taxable earnings, and the gap between the core gross domestic product (GDP) deflator and growth in the consumer price index for urban wage earners and clerical workers. Those factors together determine the individual and aggregate outcomes of interest in any simulation.Footnote 23
How Stochastic Variables Affect Individual Tax and Benefit Outcomes

How Stochastic Inputs Affect Social Security System Finances