


Introduction
The genus Hordeum consists of 33 species with a basic chromosome number x = 7. All taxa of Hordeum are basically diploid (2n = 2x = 14), tetraploid (2n = 4x = 28) or hexaploid (2n = 6x = 42); however, seven taxa have a plural ploidy (Von Bothmer et al., Reference Von Bothmer, Jacobsen, Baden, Jorgensen and Linde-Laursen1995). Earlier cytogenetic studies based on meiotic chromosome pairing and karyotype analyses proposed the existence of four basic genomes (I, H, Xa and Xu) in the genus (Von Bothmer et al., Reference Von Bothmer, Jacobsen, Baden, Jorgensen and Linde-Laursen1995). The four genome groups in Hordeum proved monophyletic and sub-divided into two sister groups. Therefore, the basal split in Hordeum was estimated and separated the H and Xu-genome species from taxa belonging to the I and Xa-genome groups. Within the H, Xa and Xu-genome groups only five extant species occur, while the majority of Hordeum species belong to the I-genome group (26 species). For genome designation, the current study followed Blattner (Reference Blattner2009), with the H genome occurring in H. vulgare and H. bulbosum, the Xu in H. murinum and the Xa in H. marinum while all the remaining species have the I genome.
Sea barley (Hordeum marinum) is a predominantly inbreeding annual grass species growing mainly in the Mediterranean area, but whose range extends northward to France and England and eastward through the Near East to Turkmenistan and West Pakistan (Jakob et al., Reference Jakob, Ihlow and Blattner2007).
The species H. marinum, which possesses the Xa-genome (Blattner, Reference Blattner2009), consists of two morphologically distinct taxa: H. marinum ssp. marinum and H. marinum ssp. gussoneanum (Von Bothmer et al., Reference Von Bothmer, Jacobsen, Baden, Jorgensen and Linde-Laursen1995). This genome is common to the two diploid forms, subsp. marinum and subsp. gussoneanum (Von Bothmer et al., Reference Von Bothmer, Flink, Jacobsen and Jorgensen1989). Phylogenetic analysis of the Xa-genome group suggested an alloploid origin of tetraploid H. marinum ssp. gussoneanum by hybridization between the diploid cytotypes of ssp. marinum and ssp. gussoneanum (Kakeda et al., Reference Kakeda, Taketa and Komastuda2009). However, by comparative karyotype analysis of H. marinum accessions, Carmona et al. (Reference Carmona, Friero, De Bustos, Jouve and Cuadrado2013) demonstrated that tetraploid forms come from a cross between diploid gussoneanum and an unidentified diploid ancestor. Previous investigations considered both taxonomic units as at least sub-species of H. marinum (Von Bothmer et al., Reference Von Bothmer, Flink, Jacobsen and Jorgensen1989) and even as separate species (Jakob et al., Reference Jakob, Ihlow and Blattner2007). The marinum and gussoneanum diploid forms coexist throughout the Mediterranean region and can be clearly distinguished by their morphology (Jakob et al., Reference Jakob, Ihlow and Blattner2007).
De Bustos et al. (Reference De Bustos, Casanova, Soler and Jouve1998) analysed the genetic diversity of some wild barley species using random amplified polymorphic DNA (RAPD) markers and found H. marinum ssp. marinum to be one of the most variable taxonomic units. This species is regarded as being a waterlogging-tolerant halophyte species (Konnerup et al., Reference Konnerup, Malik, Islam and Colmer2017). Moreover, it has been considered one of the most important wild species of barley in terms of having a source of genes for improvement of salt and waterlogging tolerance of wheat (Alamri et al., Reference Alamri, Barrett-Lennard, Teakle and Colmer2013; Konnerup et al., Reference Konnerup, Malik, Islam and Colmer2017): hybridization of H. marinum with wheat produces an amphiploid containing both genomes (AABBDDXaXa).
In Tunisia, it is often found in saline depressions, in close association with strict halophytes such as Arthrocnemum macrostachyum and Halocnemum strobilaceum, where it contributes significantly to annual biomass production in these ecosystems (Abdelly et al., Reference Abdelly, Lachaâl, Grignon, Soltani and Hajji1995). It can also be used as hay or grazing to rehabilitate degraded rangelands and to develop land in arid and semi-arid areas. However, like other crop wild relatives, H. marinum is threatened by habitat loss and climate change. The current challenge is to screen existing germplasm collections and increase efficient molecular markers that would be valuable in diversity analyses and resource conservation. Genebanks maintain living germplasm and represent a comprehensive snapshot of the genetic diversity at a given time and place. The Tunisia National Genebank (BNG) is a rich resource of barley landrace materials and cultivars; however, only a few accessions of H. marinum are currently available. Likewise, there is little information on genetic diversity in this species (Saoudi et al., Reference Saoudi, Badri, Gandour, Smaoui, Abdelly and Tammalli2017, Reference Saoudi, Badri, Taamalli, Zribi, Gandour and Abdelly2019). In order to maintain sustainable survival of populations and preserve their evolutionary potential, knowledge of the levels of genetic diversity and their distribution is important for designing conservation strategies. Consequently, the evaluation of molecular genetic variation will be very useful for diversity analysis, defining conservation strategies and exploitation of beneficial alleles from wild plants.
Therefore, the objectives of the current study were to (i) assess the levels of genetic diversity available within and among ten natural populations of H. marinum ssp. marinum by using RAPD markers, (ii) estimate the genetic diversity related to eco-geographical parameters and (iii) evaluate the desirable genotypes to facilitate the conservation and management of the species.
Material and methods
Plant material and DNA extraction
One hundred and fifty lines belonging to ten populations of sea barley (H. marinum ssp. marinum) from five Tunisian bioclimatic regions (Table 1; Fig. 1) were used in the current study. Each population was represented by 15 individuals. More details about these lines are reported in Saoudi et al. (Reference Saoudi, Badri, Gandour, Smaoui, Abdelly and Tammalli2017). Three seeds from each individual were disinfected with 1% sodium hypochlorite solution for 5 min, rinsed abundantly with distilled water and sown in small pots (height = 40 cm, diameter = 30 cm) filled with 4 kg of inert and humid sand previously washed with 0.05% hydrochloric acid (HCl). The experiment was conducted under greenhouse conditions (25 ± 5.3/10 ± 3.2 °C day/night temperature, relative humidity of 60/80% during the light/dark periods, 16/8 h light/dark regime and an average photosynthetic photon flux density between 400 and 1200 µmol/m2/s) at the Centre of Biotechnology of Borj Cedria, (CBBC) Tunisia in November 2010. To keep the sand moist, experimental pots were irrigated every 2 days with pure water until germination. At growth stage 13–15 (Zadoks et al., Reference Zadoks, Chang and Konzak1974), all pots were thinned to keep only one seedling per pot and seedlings were irrigated with a modified Hewitt's nutrient solution (Hewitt, Reference Hewitt1966). After 30 days, fresh leaves of each individual were collected separately for DNA extraction. Frozen leaves (400–500 mg) from each individual were ground separately to a fine powder in liquid nitrogen and genomic DNA was extracted according to Geuna et al. (Reference Geuna, Toschi and Bassi2003). DNA samples were stored at −20 °C prior to RAPD analysis.
(Colour online) Geographic locations of the ten collection sites of Tunisian populations of H. marinum ssp. marinum. Tabarka (TB), Lac de Bizerte (LB), Sebkhet Ferjouna (SF), Soliman (SL), Sidi Othman (SO), Mouthul (MT), Medjez El Bab (MB), Bkalta (BK), Bouficha (BF) and Lessouda (LS).

Ecological parameters of collection sites of the ten Tunisian populations of H. marinum

Random amplified polymorphic DNA-polymerase chain reaction protocols
A total of 36 RAPD primers (Biomatik, ON, Canada) were used for the screening of polymorphism and genetic diversity in H. marinum. Out of these primers, 13 (Table 2) were selected for the clarity of their electrophoretic profiles and several precautions were taken to ensure the reliability of the genotyping process. Indeed; the primers with high-genotyping error, no amplifications or amplification problems were discarded. Polymerase chain reactions (PCRs) were performed in a total volume of 20 µl containing 100 mM Tris(hydroxymethyl) aminomethane hydrochloride (Tris-HCl; pH 9.0), 50 mM potassium chloride (KCl), 2.5 mM magnesium chloride (MgCl2), 0.2 mM each dNTP, 1 µM primer, 1 U of Taq DNA Polymerase (Platinum Taq DNA Polymerase, Invitrogen, Carlsbad, CA, USA) and 20 ng of template DNA. Amplification reactions were performed in a MyCycler thermal cycler (Bio-Rad, Hercules, CA, USA) which was programmed to perform the following profiles: (P1) 94 °C for 3 min, followed by 40 cycles of 95 °C for 1 min, 35 °C for 1 min, 72 °C for 2 min and a final extension step of 72 °C for 8 min. (P2) 94 °C for 3 min, followed by 40 cycles 95 °C for 30 s, 36 °C for 1 min, 72 °C for 1 min and a final extension step of 72 °C for 8 min. (P3) 94 °C for 3 min followed by 45 cycles of 94 °C for 30 s, 37 °C for 2 min, 72 °C for 2 min and a final extension step of 72 °C for 7 min. The PCR products were resolved by electrophoresis in a 1.5% agarose gel in Tris-borate-ethylenediaminetetraacetic acid buffer, stained with ethidium bromide, visualized with ultraviolet light and photographed.
Sequences, amplification profiles and polymorphism of selected RAPD primers

Data analysis
The RAPD data were scored for the presence (1) or absence (0) of amplified markers. Discriminative power of RAPD primers was estimated based on: (i) the discrimination capacity (D j) of the j th test unit calculated using the formula developed by Tessier et al. (Reference Tessier, David, This, Boursiquot and Charrier1999):

where $C_j = \sum\limits_{i = 1}^I {p_i} ((Np_i-1)/(N-1))$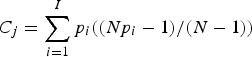 , P i is the frequency of the i th electrophoretic pattern, N is the total number of studied individuals, I is the total number of electrophoretic patterns generated by the j th unit test.
(ii) the limit of the capacity of discrimination $(D_L) = \lim \,(D_j) = 1-\sum\limits_{i = 1}^I {p_i^2}$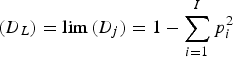 when N tends to infinity.
The identification of 162 scorable bands led to the construction of 150 genotypes × 162 loci data matrix, which was used for analysis of genetic diversity within and among populations. The genetic diversity of populations was estimated using three parameters: (i) the polymorphism rate (P) calculated as follows:

where n p is the number of polymorphic bands and n np is the number of non-polymorphic bands.
(ii) the Nei's unbiased gene diversity index (UHe) estimated as follows:

where L is the number of loci. For a given locus UHe i = $(2N/(2N-1)) \times \left( {1-\sum\nolimits_{i = 1}^I {p_i^2}} \right)$ , where N is the number of lines and p i is the frequency of i th allele.
(iii) Shannon's index of diversity:

where p i is the frequency of RAPD bands. The Nei's gene diversity between lines was estimated using GenAlEx 6 (Peakall and Smouse, Reference Peakall and Smouse2006) while the Shannon index was calculated using Popgene software version 1.31 (Yeh et al., Reference Yeh, Yang, Boyle, Ye and Mao1997). To compare the ten H. marinum ssp. marinum populations, UHe and I variables were subjected to analysis of variance (ANOVA) followed by a Tukey's multiple range test at P < 0.05 using general linear model of SPSS 16.0.0.
Analysis of Molecular Variance (AMOVA) at ecoregions, populations within ecoregion and within population levels was performed using GenAlEx 6 (Peakall and Smouse, Reference Peakall and Smouse2006). Total expected variance (V TOT) was partitioned into variance between ecoregions (V AR), variance between populations within ecoregions (V AP) and variance within populations (V WP). Differentiation among ecoregions (ФRT), differentiation among population within ecoregions (ФPR) and differentiation among population (ФPT) were estimated as follows:

To describe the genetic relationships between populations and between lines within populations, a Principal Coordinates Analysis (PCoA) was carried out. In addition, an Unweighted Pair Group Method with Arithmetic Averages (UPGMA) dendrogram was constructed based on the ФPT pairwise genetic matrix among populations or lines.
To infer a population structure, a Bayesian clustering as implemented in STRUCTURE 2.3 software (Pritchard et al., Reference Pritchard, Stephens and Donnelly2000) was performed and compared to UPGMA and PCoA results. This approach uses a Bayesian clustering analysis to assign individuals to clusters (K) without prior knowledge of their population affinities. To identify the number of clusters (K) capturing the major structure in the data, a burn-in period of 50 000 Markov Chain Monte Carlo (MCMC) iterations was used, with 50 000 run length. Five independent runs were performed for each simulated value of K, ranging from 1 to 10 under admixture and a correlated allele frequencies model. The best K value was identified based on the methods of the maximum likelihood L(K) (Pritchard et al., Reference Pritchard, Stephens and Donnelly2000) and the ad hoc quantity ΔK following Evanno et al. (Reference Evanno, Regnaut and Goudet2005) approaches implemented in STRUCTURE HARVESTER (Earl and Von Holdt, Reference Earl and Von Holdt2012).
To identify candidate loci potentially influenced by selection from genetic data, an outlier analysis was performed using the program BayeScan 2.1 (Foll and Gaggiotti, Reference Foll and Gaggiotti2008). It is a Bayesian likelihood approach via the reversible-jump MCMC, to estimate the ratio of posterior probabilities of selection over neutrality [the posterior odds (PO)], by comparing two alternative models M1 (with selection) and M2 (neutral). Model choice decision can be performed using the so-called ‘Bayes factors’ BF, which provides a scale of evidence in favour of one model v. another. Parameters for running BayeScan were 100 pilot runs of 50 000 iterations followed by a sample size of 50 000 with a thinning interval of 10. A threshold value for determining loci under selection was evaluated in accordance with Jeffreys’ (Reference Jeffreys1961) interpretation. A locus with log10 (PO) > 0.5 was considered to have substantial evidence for selection (Jeffreys, Reference Jeffreys1961).
To capture the maximum genetic diversity of the entire collection, and to facilitate the strategy of conservation of the studied species, a sub-set of lines was selected, using a strategy of maximization (M) algorithm implemented in MSTRAT (Gouesnard et al., Reference Gouesnard, Bataillon, Decoux, Rozale, Schoen and David2001) software. First, the optimal size for the core collection was determined, using its redundancy mode. Then, the 20 core collections were constructed with an iteration number of 50 and the core collection with the highest Shannon diversity index was selected to make up the germplasm sub-set.
Statistical analysis
To establish a representative distribution to capture climate variability, the species' geographic range was coupled with climate data obtained from the WorldClim database version 1.4 (http://www.worldclim.org), a global and freely available source for climate data layers generated through interpolation of average monthly climate data from weather stations. The current climate conditions (1950–2000) for the 19 bioclimatic variables were extracted for each collecting site using the DIVA-GIS program (https://www.diva-gis.org/; Table 3). To investigate the association between genetic diversity and environmental variables a stepwise multiple regression (MR), implemented in R, was exploited. Stepwise MR analysis with environmental variables was performed to find the best predictors of Nei genetic diversity (UHe) and Shannon index (I). The parameters UHe and I were employed as dependent variables in the model and ecogeographical factors served as independent variables. The following ecogeographical variables included in the analysis covered longitude (Lg), latitude (Lat), altitude (Alt), temperature [annual mean temperature (Bio1), mean diurnal range (mean of monthly (max temp−min temp)) (Bio2), isothermality (BIO2/BIO7) × (100) (Bio3), temperature seasonality (standard deviation × 100) (Bio4), max temperature of warmest month (Bio5), min temperature of coldest month (Bio6), temperature annual range (Bio5–Bio6) (Bio7), mean temperature of wettest quarter (Bio8), mean temperature of driest quarter (Bio9), mean temperature of warmest quarter (Bio10) and mean temperature of coldest quarter (Bio11)] and precipitation [annual precipitation (Bio12), precipitation of wettest month (Bio13), precipitation of driest month (Bio14), precipitation seasonality (coefficient of variation) (Bio15), precipitation of wettest quarter (Bio16), precipitation of driest quarter (Bio17), precipitation of warmest quarter (Bio18) and precipitation of coldest quarter (Bio19)] (Tables 1 and 3). The correlation between population genetic differentiation and geographic distance (km) was estimated using the Mantel test (Mantel, Reference Mantel1967).
Coding of bioclimatic variables according to WorldClim at http://www.worldclim.org/bioclim

Results
Primer screening
The 13 primers generated a total of 162 scorable and reproducible bands, ranging in the size from 300 to 3000 bp. The total number of bands per primer varied from nine (U09 and UBC225) to 16 (Deca23) with an average of 12.46 bands per primer. Among the 162 bands, only two were not polymorphic (Deca3–7 and D05-1) (Table 2). The electrophoretic profiles generated by primer Deca28 in the population of Medjez El Bab are shown in Fig. 2.
Electrophoretic profiles generated by primer Deca28 among 15 genotypes from Medjez El Bab (MB). M: molecular weight marker (100 bp DNA Ladder).

The Nei genetic diversity (UHe) and Shannon index (I) vary significantly from one primer to another (Table 4). The highest values for these parameters were recorded for the primers Deca7 and Deca28 (UHe = 0.423 and 0.404; I = 0.608 and 0.587, respectively). The primer Deca3 exhibited the lowest values (UHe = 0.239; I = 0.378) while the remaining primers showed moderate values. The discrimination capacity of each primer was calculated to offer a sub-set of useful markers for the description of studied lines. The values of the discrimination capacity (Table 4) were very high (>0.9) and varied little from one primer to another. The largest values (>0.99) were recorded for primers having the highest numbers of polymorphic loci (⩾15). The primers Q11, Deca23 and Deca29, showing the highest number of profiles, were chosen as the most appropriate combination of markers that allowed assignation of a unique profile for each of the 150 lines.
Discrimination capacity, Nei's unbiased gene diversity (UHe) and Shannon information (I) indices of selected RAPD primers

Genetic diversity
The average genetic diversity of populations was estimated by the polymorphism rate (P), the Nei genetic diversity (UHe) and Shannon index (I) (Table 5). The percentage of polymorphic bands varied significantly among populations (P < 0.01) with an average of 69.69%. The highest values were observed for Tabarka (84.6%) while the lowest percentages were observed for Medjez El Bab (61.7%) and Sebkhet Ferjouna (62.36%). Among the 162 bands detected, 76 were found for all populations, 72 were common in at least five populations over at least three ecoregions, 13 were localized and common in fewer than five populations, and only one localized and rare band found in the population of Tabarka (Table 5).
Number and frequency of bands, percentage of polymorphism, Shannon information (I) and Nei's unbiased gene diversity (UHe) indices for populations of H. marinum ssp. marinum

TB, Tabarka; LB, Lac de Bizerte; SF, Sebkhet Ferjouna; SL, Soliman; SO, Sidi Othman; MT, Mouthul; MB, Medjez El Bab; BK, Bkalta; BF, Bouficha and LS, Lessouda.
N. B. = number of different bands.
N. B.P. = number of polymorphic bands.
N. B. (⩾5%) = number of different bands with a frequency (⩾5%).
N. B.Pr. = number of bands unique to one population.
N. B. L.C. (⩽25%) = number of local and common bands (Freq. ⩾5%) found in 25% or fewer populations.
N. B. L.C. (⩽50%) = number of local and common bands (Freq. ⩾5%) found in 50% or fewer populations.
P = percentage of polymorphic bands.
UHe = expected unbiased heterozygosity = (2N/(2N−1)) × He.
He = expected heterozygosity = 2 × p × q, where for a binary diploid data and Hardy–Weinberg equilibrium. q = (1−Freq. Bands)0.5 and p = 1−q.
Results from ANOVA showed that by contrast to UHe, a significant variation of I was found between populations (P = 0.023; α = 0.05). The values of UHe ranged from 0.227 to 0.289 with an average of 0.247 while I ranged from 0.329 to 0.423 with an average of 0.358. The highest values for both indices were found for Tabarka while moderate values were observed for Lac de Bizerte, Bkalta, Bouficha and Lessouda, and the lowest levels were registered for Sidi Othman, Mouthul, Medjez El Bab, Sebkhet Ferjouna and Soliman. There was no significant correlation between these indices and the altitude factor (r (UHe, alt) = −0.189, P = 0.600; r (I, alt) = −0.201; P = 0.636; r (P, alt) = −0.171, P = 0.578; α = 0.05). However, the polymorphism rate (P), Nei genetic diversity (UHe) and Shannon index (I) were significantly correlated (r (UHe, I) = 0.997, P < 0.001; r (UHe, P) = 0.939, P < 0.001 and r (P, I) = 0.963, P < 0.001).
Population structure
The AMOVA at three hierarchical levels, including ecoregion, showed that lines within populations explained about 67% of the total genetic variation followed by populations within ecoregions (21%) and the ecoregion factor (12%) (Table 6). The population differentiation index (ФPT = 0.315) was significantly different from zero. Pairwise comparisons of studied populations (Table 7) showed significant ФPT values (P < 0.01) ranging from 0.114 to 0.449. The highest values of ФPT were recorded for Tabarka and Medjez El Bab while the lowest levels were for Lac de Bizerte and Bouficha. There was no signification association between population differentiation (ФPT) with geographical distance (r = −0.045; P = 0.458) and altitudinal difference (r = −0.227; P = 0.170) (Table 8).
Analysis of molecular variance at ecoregions, populations within ecoregions and within population levels

ФRT = AR/(WP + AP + AR) = AR/TOT
ФPR = AP/(WP + AP)
ФPT = (AP + AR)/(WP + AP + AR) = (AP + AR)/TOT
AR = expected variance among ecoregions.
AP = expected variance among populations.
WP = expected variance within populations.
***P < 0.001 (after 9999 permutations).
Pairwise ФPT matrix between populations of H. marinum

TB, Tabarka; LB, Lac de Bizerte; SF, Sebkhet Ferjouna; SL, Soliman; SO, Sidi Othman; MT, Mouthul; MB, Medjez El Bab; BK, Bkalta; BF, Bouficha and LS, Lessouda.
Pairwise ФPT values are below the diagonal.
All the probability values based on 9999 permutations are P < 0.001.
Matrices of geographical distances and altitudinal differences among populations of H. marinum

TB, Tabarka; LB, Lac de Bizerte; SF, Sebkhet Ferjouna; SL, Soliman; SO, Sidi Othman; MT, Mouthul; MB, Medjez El Bab; BK, Bkalta; BF, Bouficha and LS, Lessouda.
Pairwise geographical distances are below the diagonal.
Pairwise altitudinal differences are above the diagonal.
A test of MR analysis was performed to investigate the relationship between environmental variables and gene diversity (UHe and I) (Table 9). Bio 19, latitude and Bio 12 factors were the best variables for prediction of UHe and I, explaining 0.839–0.854 of their variance (P < 0.01) respectively.
Coefficient of MR (R 2) of genetic diversity indices and allele frequencies (outlier loci), as the dependent variables, and environmental factors as independent variables

Level of significance: ***P < 0.001, **P < 0.01; *P < 0.05; @ P < 0.1; ns P > 0.1.
Among 160 polymorphic loci, only two were identified as outlier loci by the BayeScan program (Fig. 3, Table 9). Based on Jeffrey's scale (Reference Jeffreys1961) these two loci could be considered to have a strong evidence of selection as they had log10 (PO) values above 1 (Deca8-11; log10 (PO) = 1.88 and Q11-6; log10 (PO) = 1.37). MR using the R package found that these outliers were associated strongly with temperature (Bio4) and precipitation of warmest quarter (Bio18).
(Colour online) BayeScan 2.1 plot of 160 polymorphic loci of 150 individuals from H. marinum ssp. marinum. Fst is plotted against the log10 of the PO. The vertical line show the critical PO used for identifying outlier loci. The two loci on the right side of the vertical line are candidates for being under positive selection.

To visualize the genetic relationships between the populations studied, a PCoA was performed on the basis of the pairwise ФPT matrix. The first three principal coordinates (PCo) accounted for more than 75% of the total variation among populations (Fig. 4). The first PCo separated the population Tabarka from the remaining populations. The second PCo separated two groups of populations; group A included Sidi Othman, Mouthul, Soliman, Medjez El Bab (from upper semi-arid bioclimate) and Lessouda (from arid bioclimate) while group B is composed of Bouficha, Bkalta (from inferior semi-arid) Lac de Bizerte and Sebkhet Ferjouna (from sub-humid bioclimate). The Third PCo separated Medjez El Bab from populations of the first group. The UPGMA dendrogram (Fig. 5) showed similar results. Furthermore, a second PCoA was performed using the matrix of pairwise genetic distances between lines to visualize the relative position of lines within each population. The plot obtained (Fig. 6) showed that there was an overlap among lines from populations in each of the two main groups (A and B) observed in the previous PCoA and that most lines from Tabarka (11 out of 15) were separated clearly from the other lines.
(Colour online) PCoA of ten populations of H. marinum based on the ФPT pairwise matrix. Tabarka (TB), Lac de Bizerte (LB), Sebkhet Ferjouna (SF), Soliman (SL), Sidi Othman (SO), Mouthul (MT), Medjez El Bab (MB), Bkalta (BK), Bouficha (BF) and Lessouda (LS).

(Colour online) Dendrogram of 10 populations of H. marinum ssp. marinum based on the ФPT pairwise matrix. Tabarka (TB), Lac de Bizerte (LB), Sebkhet Ferjouna (SF), Soliman (SL), Sidi Othman (SO), Mouthul (MT), Medjez El Bab (MB), Bkalta (BK), Bouficha (BF) and Lessouda (LS).

(Colour online) PCoA of 150 lines of H. marinum ssp. marinum based on the pairwise genetic matrix. Tabarka (TB), Lac de Bizerte (LB), Sebkhet Ferjouna (SF), Soliman (SL), Sidi Othman (SO), Mouthul (MT), Medjez El Bab (MB), Bkalta (BK), Bouficha (BF) and Lessouda (LS).

The Bayesian clustering results, implemented in STRUCTURE 2.3 software (https://web.stanford.edu/group/pritchardlab/structure.html), were in agreement with the results of the PCoA and UPGMA analyses. In this analysis, it was observed that the best-inferred number of clusters was K = 3 (Fig. 7), obtained by the Evanno's method (Evanno et al., Reference Evanno, Regnaut and Goudet2005). This suggested the presence of three main model-based populations where the most distinct population was Tabarka. In fact, lines of this population displayed a clear membership in cluster one (C1). The second sub-group differentiated the lines of the group B obtained by PCoA and were assigned in cluster 2 (C2) of the three model-based populations; it enclosed all the lines of Bouficha, Bkalta, Lac de Bizerte and Sebkhet Ferjouna. The lines of Sidi Othman, Mouthul, Soliman, Medjez El Bab and Lessouda (group A) formed the third cluster (C3). The obtained admixtures are an indication of sub-grouping of lines as evident from PCoA and UPGMA-based analysis.
(Colour online) Estimated plot showing the structure of 150 lines of H. marinum with k = 3 clusters, based on 13 selected RAPD markers. Each individual with numbers in the left of parenthesis (1–150) is represented by a vertical line, which is partitioned into k segment that represent the individual's estimated membership fractions in k clusters. Long black lines indicate the separation among a priori assigned groups. The numbers in parentheses (1–10) are presumed populations: (1) Tabarka; (2) Lac De Bizerte; (3) Sebkhet Ferjouna; (4) Soliman; (5) Sidi Othman; (6) Mouthul; (7) Mdjez El Bab; (8) Bkalta; (9) Bouficha and (10) Lessouda.

To construct a sub-set of lines representing most of the genetic diversity of the 150 lines studied, the M (maximization) strategy-based sampling was performed using the program MSTRAT. From the initial collection, a sub-set of 11 lines representing most of the genetic diversity was identified. Only two populations (Lac de Bizerte and Mouthul) have not been included in this sub-set (S) of lines. To increase the spectrum of diversity, two lines of each of these two populations (LB2) and (MT4) were selected randomly and added to form a sub-set of 13 lines (TB8, TB10, TB14, LB2, SF4, SL8, SO7, MT4, MB9, MB12, BK2, BF10, LS6; Fig. 8). The sub-set set accounted for 8.66% of the whole collection. The sub-set of 11 lines have genetic diversity values (UHe = 0.369) close to that of the initial collection (UHe = 0.337). These results indicated that this sub-set of lines represents adequately the genetic diversity of H. marinum ssp. marinum; they were retained as representative and will be conserved at the Tunisian National Gene Bank.
(Colour online) Scatter diagram showing the distribution of the selected sub-sets of 13 lines (S). Tabarka (TB), Lac de Bizerte (LB), Sebkhet Ferjouna (SF), Soliman (SL), Sidi Othman (SO), Mouthul (MT), Medjez El Bab (MB), Bkalta (BK), Bouficha (BF), Lessouda (LS) and Sub-set lines (S).

Discussion
The polymorphism rate detected in the current study (98%) was higher than that reported for the same species (76%) (De Bustos et al., Reference De Bustos, Casanova, Soler and Jouve1998), as for other self-(H. murinum ssp. murinum (42%) and H. murinum ssp. leporinum (66%)), or cross-pollinated barley species (H. secalinum (55%) and H. bulbosum (60%)) (De Bustos et al., Reference De Bustos, Casanova, Soler and Jouve1998). It is also higher than that found for cultivated barley (H. vulgare ssp. vulgare) in Tunisia (82.8%) (Abdellaoui et al., Reference Abdellaoui, Kadri, Ben Naceur and Ben Kaab2010). In addition, the values of Nei genetic diversity (UHe = 0.247) and Shannon information index (I = 0.358) in the studied populations were higher than expected for a predominantly self-pollinating species. They exceeded the values reported by Demissie and Bjørnstad (Reference Demissie and Bjørnstad1997) in Ethiopian cultivated barley (He = 0.134) using isozymes and by Ozkan et al. (Reference Ozkan, Kafkas, Ozer and Brandolini2005) for wild barley (H. spontaneum) from Turkey (He = 0.16) using amplified fragment length polymorphism (AFLP) markers. There was no obvious variation for the polymorphism rate (P), the Nei genetic diversity (UHe) and Shannon index (I) among ecoregions, although the highest values of these parameters (P, UHe and I) were registered for Tabarka population, from a humid bioclimate, and the lowest for Sidi Othman, Mouthul, Medjez El Bab and Soliman, from upper semi-arid bioclimate.
The population differentiation index (ФPT = 0.315) is consistent with those found in wild barley using RAPDs (Baum et al., Reference Baum, Nevo, Johnson and Beiles1997), simple sequence repeats (Baek et al., Reference Baek, Beharav and Nevo2003), AFLPs (Ozkan et al., Reference Ozkan, Kafkas, Ozer and Brandolini2005) and isozymes (Zhang et al., Reference Zhang, Saghai Maroof and Kleinhofs1993), and with those observed in other autogamous species (Schoen and Brown, Reference Schoen and Brown1991). Nevertheless, some studies have shown slightly higher population differentiation (ФPT = 0.4) by using RAPDs (Dawson et al., Reference Dawson, Chalmers, Waugh and Powell1993) and RFLPs (Zhang et al., Reference Zhang, Saghai Maroof and Kleinhofs1993) or lower values (ФPT = 0.1) for RAPD markers (Volis et al., Reference Volis, Yakubov, Shulgina, Ward, Zur and Mendlinger2001). The current results revealed higher genetic diversity within (67%) than among populations. This is in contrast to expectations for self-pollinated plants where the within-population variation is generally lower than among populations (Hamrick, Reference Hamrick, Soltis, Soltis and Dudley1990; Wolff, Reference Wolff1991). Some authors have explained this discrepancy by the fact that self-pollinated species may have some degree of outcrossing (Jain, Reference Jain, Frankel and Hawkes1975). H. marinum has been described as being not strictly autogamous (De Bustos et al., Reference De Bustos, Casanova, Soler and Jouve1998) and a degree of crossing is usually possible (Sanz et al., Reference Sanz, Fernández and Jouve1987; Wolff, Reference Wolff1991). Similar results showing the predominance of within-population variation were obtained for cultivated (Chen et al., Reference Chen, Guo, Chen, Liu, Jia and Sun2006; Jaradat and Shahid, Reference Jaradat and Shahid2006) and wild barley (H. spontaneum) (Dawson et al., Reference Dawson, Chalmers, Waugh and Powell1993; Baum et al., Reference Baum, Nevo, Johnson and Beiles1997; Volis et al., Reference Volis, Mendlinger, Turuspekov and Esnazarov2002). Moreover, this finding agrees with those observed for other natural Tunisian self-fertilizing species, where the within-population component was predominant, such as Medicago truncatula species (Arraouadi et al., Reference Arraouadi, Badri, Abdul Jaleel, Djébali, Ilahi, Huguet and Aouani2009) and Brachypodium hybridum (Neji et al., Reference Neji, Geuna, Taamalli, Ibrahim, Chiozzotto, Abdelly and Gandour2015).
On the other hand, the higher within-population variability observed could be explained by migration of individuals across H. marinum populations, which could occur via seed dispersal by grazing animals and human activity. Treitler et al. (Reference Treitler, Drissen, Stadtmann, Zerbe and Mantilla-Contreras2017) showed that donkeys and goats feed on and disperse species of the temporarily wet grassland, such as H. marinum, by endozoochory. In Tunisia, donkeys and goats have been moved widely around Tunisia since historic times. Similarly, by whole genome sequencing of M. truncatula genotypes, Friesen et al. (Reference Friesen, von Wettberg, Badri, Moriuchi, Barhoumi, Chang, Cuellar-Ortiz, Cordeiro, Vu, Arraouadi, Djébali, Zribi, Badri, Porter, Aouani, Cook, Strauss and Nuzhdin2014) showed that despite population structure, divergence among individuals within a population is greater than divergence between populations and detected evidence of substantial migration between all pairs of Tunisian populations of M. truncatula. As the natural outcrossing rate of sea barley is unknown, the results obtained in the current work support the hypothesis that the highest within-population genetic diversity could be explained by seed dispersal on the one hand, but also provide further insight into the routes of understanding the H. marinum mating system on the other hand.
The ecoregion effect was significant but relatively low (ФRT = 0.12, P < 0.001); this information should be treated with caution as humid and arid bioclimatic stages were represented by only one population each. The pattern of RAPD variation was similar to that reported by Volis et al. (Reference Volis, Yakubov, Shulgina, Ward, Zur and Mendlinger2001, Reference Volis, Mendlinger, Turuspekov and Esnazarov2002) in H. spontaneum, where the among-region component was the lowest using RAPD (20.7%) and allozyme (2%) markers.
Principal coordinate analysis and cluster analysis based on the population pairwise ФPT matrix showed that studied populations formed two main groups without geographical clustering, and that Tabarka and Medjez El Bab clustered separately from each other and from the two groups. The absence of a significant relationship between geographical and genetic distance indicates a marked local differentiation, rather than a gradual change in allele frequencies across the range of H. marinum in Tunisia. In agreement with the current results, several studies found no dependence of the genetic structure of populations on geographic origin of crops (Turpeinen et al., Reference Turpeinen, Vanhala, Nevo and Nissilä2003; Neji et al., Reference Neji, Geuna, Taamalli, Ibrahim, Chiozzotto, Abdelly and Gandour2015), while other studies (Volis et al., Reference Volis, Yakubov, Shulgina, Ward, Zur and Mendlinger2001) have indicated significant correlations between genetic variation and geographical parameters. However, it was found that some environmental factors play an important role in genetic diversity and enhancing population divergence in H. marinum ssp. marinum. Indeed, significant correlations between environmental factors and Nei's (UHe) and Shannon index (I) were detected. Latitude (Lat) and water availability (Bio19 and Bio12) factors, in combination, explained 0.839 and 0.854 of the variance in UHe and I, respectively. Comparable results were observed in wheat by using RAPD markers (Fahima et al., Reference Fahima, Sun, Beharav, Krugman, Beiles and Nevo1999), where climatic factors (latitude and water availability) were the best predictors of genetic diversity.
Principal coordinate analysis and the Bayesian clustering results showed that the 150 lines did not cluster into distinct groups according to their populations of origin. The most prominent pattern is that most of the lines of the Tabarka population (11 out of 15) were separated from the rest of the lines and formed a separate group.
An outlier analysis was performed using the program BayeScan 2.1 (Foll and Gaggiotti, Reference Foll and Gaggiotti2008), to identify candidate loci potentially influenced by selection from genetic data. Results showed that among 160 analysed loci, only two (Deca8-11 and Q11-6) showed values log10 (PO) higher than 0.5 (1.88 and 1.37, respectively). As a small portion of genetic loci were selective outliers, neutral evolution might also have a crucial role in divergence. It was thought that the rare and local band characterizing Tabarka populations (UBC238-8) could lead to this divergence; however, a deeper analysis indicated that it was a general pattern across many markers from most of primers, even though the Mantel test showed that genetic and geographic distances were not significant, which ruled out isolation by the distance model. Some slight signals of the divergence of Tabraka may be due to the Kroumirie and Mogoad mountain chains, which could reduce gene flow between Tabarka and the remaining populations. A similar result was previously found in another selfing species, Medicago truncatula (Lazrek et al., Reference Lazrek, Roussel, Ronfort, Cardinet, Chardon, Aouani and Huguet2009), where despite the lack of isolation by distance there was stratification into two main groups, a northern group and a southern group, separated by the Tunisian Dorsale (a set of mountains following a south-west/north-east axis). Moreover, the work of Saoudi et al. (Reference Saoudi, Badri, Gandour, Smaoui, Abdelly and Tammalli2017) on the phenotypic diversity of this collection of lines showed the specificity and the divergence of Tabarka compared to the other populations studied.
Studying genetic diversity in Tunisian Cakile maritima, Gandour et al. (Reference Gandour, Hessini and Abdelly2008) found high differentiation of Tabarka population from the other populations, and supported these results by the absence of a tidal current between Tabarka and the remaining populations. In addition, Neji et al. (Reference Neji, Geuna, Taamalli, Ibrahim, Chiozzotto, Abdelly and Gandour2015) showed that the population of Ain Draham (a region close to Tabraka) clusters separately from eight other populations of Brachypodium hybridum.
The current study reveals a high level of polymorphism and genetic diversity in Tunisian populations of H. marinum ssp. marinum. To select a sub-set of lines while maintaining as much as possible the genetic diversity of the original collection for conservation, the maximization (M) algorithm implemented in MSTRAT software was used. This approach allowed selection of a sub-set of 11 lines, to which two lines MT4 and LB2, randomly selected, were added. A total of 13 lines (8.66% from the initial collection), with UHe = 0.369 and which are distributed over the three group of PCoA, were retained as representative of the whole initial collection. No significant differences for Nei's diversity between this sub-set and the entire collection. These results indicated that the selected sub-set adequately represents the genetic diversity of the 150 lines so that, the 13 lines will be conserved at the Tunisian National Gene Bank.
Acknowledgement
We thank Sondes Rahmouni for technical assistance in molecular characterization.
Financial support
This study was supported by the Tunisian Ministry of Higher Education and Scientific Research (LR10 CBBC 02).
Conflicts of interest
The authors declare no conflict of interest.
Ethical standards
Not applicable.



