





Management Implications
This study presents the first comprehensive prioritized list of invasive plant species for a biodiversity hotspot region in India. Both the prioritized list and the complementary methodologies employed in this study can be directly applied to invasive species management in India and across diverse ecosystems worldwide. The prioritized list provides a practical tool for private landowners and forest departments in the region for targeted monitoring and management of invasive species. In conservation areas with limited management resources, such as the Northern Western Ghats and Konkan (NWGK), our prioritized list will enable strategic allocation of effort. Land managers can employ resource-intensive control strategies for species high on the priority list, while lower-priority species may be monitored rather than actively removed. Beyond overall rankings, we provide species-level insights across both distribution and impact dimensions, including habitat associations and occurrence within protected areas, which can inform more targeted, context-specific management of a species. The complementary approaches used in this study to prioritize invasive species are transferable and can be applied in regions where logistical constraints limit extensive field-based assessments. We demonstrate that herbarium-based natural history collections, combined with expert assessments, offer a cost-effective approach for multidimensional evaluation and can support robust prioritization. Finally, our findings highlight the importance of local-scale prioritization, as reliance on broader-scale assessments alone may overlook regionally important invasive species, potentially leading to less effective management outcomes.
Introduction
Biological invasions, a leading cause of global biodiversity loss (Jeschke et al. Reference Jeschke, Bacher, Blackburn, Dick, Essl, Evans, Gaertner, Hulme, Kühn, Mrugała, Pergl, Pyšek, Rabitsch, Ricciardi and Richardson2014), are projected to intensify under future global change (Seebens et al. Reference Seebens, Bacher, Blackburn, Capinha, Dawson, Dullinger, Genovesi, Hulme, van Kleunen, Kühn, Jeschke, Lenzner, Liebhold, Pattison and Pergl2021). In recognition of the substantial ecological and economic impacts, there is an urgent need to identify and prioritize invasive species (Bang et al. Reference Bang, Cuthbert, Haubrock, Fernandez, Moodley, Diagne, Turbelin, Renault, Dalu and Courchamp2022; Secretariat of the Convention on Biological Diversity 2011). Identifying high- and low-priority invasive species can enable more effective allocation of limited resources for monitoring, management, and control (Courtois et al. Reference Courtois, Figuières, Mulier and Weill2018). Central to the prioritization process are the identification of invasive species and assessment of their distributions and impacts. Global and national databases of invasive species (e.g., Global Invasive Species Database, Global Registry of Introduced and Invasive Species) play an important role in collating such information and supporting management and policy decisions (Zhao Reference Zhao2024). Such assessments are particularly valuable for informing national strategies and international agreements and have been used for global assessments by Intergovernmental Science Policy Platform on Biodiversity and Ecosystem Services (IPBES) and have supported National Biodiversity Strategy and Action Plans (NBSAP) in several countries (Zhao Reference Zhao2024). These large-scale checklists are often used for regional management of invasive species with the assumption that species impacts are consistent across spatial scales. However, the impacts of invasive species are strongly context dependent and can vary across regions and biomes (Pyšek et al. Reference Pyšek, Jarošík, Hulme, Pergl, Hejda, Schaffner and Vilà2012), and the extent to which global and national frameworks can be effectively used for regional-scale management remains an open question.
Despite the need to identify and prioritize invasive species being highlighted under the Convention on Biological Diversity (Bacher et al. Reference Bacher, Galil, Nuñez, Ansong, Cassey, Dehnen-Schmutz, Fayvush, Hiremath, Ikegami, Martinou, McDermott, Preda, Vilà, Weyl, Fernandez, Ryan-Colton, Roy, Pauchard, Stoett and Renard Truong2023; Secretariat of the Convention on Biological Diversity 2000), a substantial gap in the availability of prioritized invasive species lists remains. The Aichi Biodiversity Targets emphasized the identification and prioritization of invasive alien species for prevention, control, and eradication; however, progress in achieving this target has been uneven globally (Secretariat of the Convention on Biological Diversity, 2020). National invasive species checklists, where available, are often limited to unranked inventories (Finley et al. Reference Finley, Dovciak and Dean2023). For example, in India, national inventories and preliminary prioritization frameworks have been developed (Gulzar et al. Reference Gulzar, Wani, Hassan, Reddy, Shrestha, Mukul, Shabbir, Iqbal, Ranwala, Sujanapal, Rashid and Khuroo2024; Khuroo et al. Reference Khuroo, Ahmad, Hamid, Rather, Malik, Rashid, Pullaiah and Ielmini2021; Pant et al. Reference Pant, Patwardhan, Patil, Bhowmick, Mukherjee and Banerjee2021; Sandilyan Reference Sandilyan2019; Sankaran et al. Reference Sankaran, Khuroo, Raghavan, Molur, Kumar, Wong and Pagad2021), yet explicit, evidence-based prioritization remains limited (but see Mungi et al. Reference Mungi, Kaushik, Mohanty, Rastogi, Johnson and Qureshi2019). This gap reflects the resource- and time-intensive nature of rigorous prioritization, which if conducted through field-based studies, may be limited to few species or small spatial extents.
Herbarium collections are a valuable natural history resource, providing spatially and temporally explicit occurrence records for many species across broad geographic extents. Herbarium data can support the prioritization of large numbers of invasive species, as their impacts are often related to range size, which can be estimated from such collections (Carr et al. Reference Carr, Yugovic and Robinson1992; Fristoe et al. Reference Fristoe, Chytrý, Dawson, Essl, Heleno, Kreft, Maurel, Pergl, Pyšek, Seebens, Weigelt, Vargas, Yang, Attorre and Bergmeier2021). In addition to range size, herbarium data can be used to characterize the temporal dynamics of invasions, including the lag, exponential, and saturation phases. Understanding these phases can provide early warning of emerging invasions and support early intervention before impacts escalate (Antunes and Schamp Reference Antunes and Schamp2017). While geographic range is often used to estimate their impact, it represents only one aspect of a species ecological impact (Catford et al. Reference Catford, Baumgartner, Vesk, White, Buckley and McCarthy2016). The overall impact of an invasive species reflects the combined effects of its range, local abundance, and per capita impact (Catford et al. Reference Catford, Baumgartner, Vesk, White, Buckley and McCarthy2016; Parker et al. Reference Parker, Simberloff, Lonsdale, Goodell, Wonham, Kareiva, Williamson, von Holle, Moyle, Byers and Goldwasser1999). Reliance on range size alone assumes strong correlations with these other dimensions. However, species with similar geographic extents can differ substantially across other dimensions like local abundance or per capita effects, resulting in markedly different overall impacts (Liao et al. Reference Liao, Li, Zhou, Huang, Zhang, Chen and Peng2021).
Expert-based surveys provide a systematic and integrative way of quantifying the impact of invasive species (Randall et al. Reference Randall, Morse, Benton, Hiebert, Lu and Killeffer2008), with the added flexibility to tailor assessments to specific impact domains (e.g., environmental vs. socioeconomic) and stakeholder perspectives (Turbé et al. Reference Turbé, Strubbe, Mori, Carrete, Chiron, Clergeau, González-Moreno, Le Louarn, Luna, Menchetti, Nentwig, Pârâu, Postigo, Rabitsch and Senar2017). In such assessments, experts respond to structured, predefined questions about different impact dimensions. These assessments can then be used to derive composite impact scores that integrate multiple attributes of invasion for prioritization of invasive species for effective management and control (Morse et al. Reference Morse, Randall, Benton, Hiebert and Lu2004). Herbarium- and expert-based approaches provide complementary insights into species impacts and are commonly used to assess invasions, yet they are rarely combined to achieve a comprehensive understanding, particularly in the tropics (Antunes and Schamp Reference Antunes and Schamp2017; Randall et al. Reference Randall, Morse, Benton, Hiebert, Lu and Killeffer2008).
While prioritization frameworks represent an important advance beyond simple species inventories, their effectiveness may depend on the spatial and ecological scales at which they are applied. Due to the resource-intensive nature of robust prioritization exercises, regional land managers may rely on broader-scale global or national priority lists, assuming species impacts to be consistent across scales. However, studies have shown that species impacts and therefore prioritization rankings can vary substantially with ecological context, invasion stage, and geographic location (Kumschick et al. Reference Kumschick, Gaertner, Vilà, Essl, Jeschke, Pyšek, Ricciardi, Bacher, Blackburn, Dick, Evans, Hulme, Kühn, Mrugała and Pergl2015), and prioritization exercises must therefore be conducted at multiple scales (Roy et al. Reference Roy, Rabitsch, Scalera, Stewart, Gallardo, Genovesi, Essl, Adriaens, Bacher, Booy, Branquart, Brunel, Copp, Dean and D’hondt2018). Evidence suggests that “worst species” lists are often not comprehensive and that species rankings can vary depending on the assessment approach and context (Nentwig et al. Reference Nentwig, Bacher, Kumschick, Pyšek and Vilà2018). However, most of this evidence come from temperate regions, and a significant knowledge gap remains for tropical systems (Early et al. Reference Early, Bradley, Dukes, Lawler, Olden, Blumenthal, Gonzalez, Grosholz, Ibañez, Miller, Sorte and Tatem2016). Consequently, although invasive species inventories are available for many tropical and subtropical countries (Pagad et al. Reference Pagad, Genovesi, Carnevali, Schigel and McGeoch2018; Turbelin et al. Reference Turbelin, Malamud and Francis2017), their utility at finer regional scale remains uncertain.
In this study, we employed complementary approaches to prioritize invasive plant species in a global biodiversity hotspot in peninsular India. We defined invasive plants as non-native species that have expanded their geographic ranges and have significant ecological, social, or economic impacts (Richardson et al. Reference Richardson, Pyšek, Rejmánek, Barbour, Panetta and West2000, Reference Richardson, Pyšek, Carlton and Richardson2011). We first compiled a comprehensive list of invasive plant species occurring in the Northern Western Ghats and Konkan regions (NWGK). We then applied two complementary approaches to evaluate the impact of these species on biodiversity across multiple dimensions of distribution and impact. In the first, we used occurrence records from major herbaria and regional floras to estimate species range sizes and temporal invasion dynamics. Species were ranked based on range size, and the relationship between range size and temporal dynamics was evaluated. In the second approach, we used expert surveys through a structured questionnaire to assess additional dimensions of invasiveness, including local abundance, habitat breadth, and impacts on native biodiversity. We compared the two approaches by examining concordance in species rankings across the different dimensions of invasiveness. We used the expert assessments to derive composite impact scores and overall rankings, which were then used to identify high-priority invasive plant species for management and control. Finally, we evaluated the extent to which the regional invasive species priorities align with national and global priorities.
Materials and Methods
Study Site
The study was conducted in the Northern Western Ghats and adjacent Konkan region (NWGK; Supplementary Figure S1), part of the Western Ghats biodiversity hotspot (Myers Reference Myers1988). This region comprises a heterogeneous mosaic of forests and open habitats characterized by strong rainfall seasonality and environmental variation. Mean annual rainfall can reach ∼5,000 mm, with most precipitation occurring between July and October, followed by a prolonged dry period from October to May (Shigwan et al. Reference Shigwan, Kulkarni, Vijayan and Datar2024). The NWGK represents a distinct ecological zone with unique floristic assemblages and is recognized as a center of rapid diversification for several herbaceous genera (Shigwan et al. Reference Shigwan, Kulkarni, Vijayan, Choudhary and Datar2020). Existing studies on invasive plants in this region are largely limited to species inventories (Ghate and Vartak Reference Ghate and Vartak1990; Rao and Sagar Reference Rao, Sagar and Pullaiah2011) or impact assessments of a few species within specific land-use types (Joshi et al. Reference Joshi, Ratnam and Sankaran2020; Ojha et al. Reference Ojha, Shigwan, Nerlekar, Datar, Chavan and Barua2025; Patil and Janarthanam Reference Patil and Janarthanam2013).
Identification of Invasive Species
We compiled a list of alien plant species in India using three sources that catalogued invasive and naturalized plants (Inderjit et al. Reference Inderjit, van Kleunen, Hejda, Babu, Majumdar, Singh, Singh, Salamma, Rao and Pyšek2018; Reddy Reference Reddy2008; Sandilyan Reference Sandilyan2019). Species were included if they were reported as invasive in any part of India or as naturalized within the states of Maharashtra or Goa, which include the NWGK region. For the 386 species in this preliminary list, we verified native ranges using online databases and published literature (Khuroo et al. Reference Khuroo, Ahmad, Hamid, Rather, Malik, Rashid, Pullaiah and Ielmini2021; Pant et al. Reference Pant, Patwardhan, Patil, Bhowmick, Mukherjee and Banerjee2021; POWO 2026; Wiersema Reference Wiersema2019) to confirm non-native status in India. Following verification, 347 species were retained as non-native. All coauthors reviewed this list to identify taxa established and problematic in the NWGK, yielding a final set of 79 invasive plant species for further analyses (Supplementary Figure S2; Supplementary Table S1).
Range Size Estimation from Herbarium, Literature, and Global Databases
We extracted collection dates and location for the 79 invasive species from the major herbaria in this region (Supplementary Table S2), which together contained more than 383,000 specimens dating from the 1700s to the present. These data were supplemented with occurrence records from the Global Biodiversity Information Facility (GBIF.org, accessed August 4, 2021), published literature, and 28 regional floras (Supplementary Appendix 1). To account for potential temporal and spatial sampling biases (Delisle et al. Reference Delisle, Lavoie, Jean and Lachance2003), we also compiled occurrence records for 33 native plant species selected to represent the range of life-forms and taxonomic groups present among the invasive taxa (Supplementary Figure S3). Geographic coordinates for all records were determined using Google Maps. This exercise resulted in a total of 6,543 occurrence records: 3,901 from herbaria, 2,232 from publications and regional flora, and 412 from global databases. Hereafter, we use the term “herbarium-based” as a collective shorthand for all data derived from these three sources.
Following previous recommendations (Antunes and Schamp Reference Antunes and Schamp2017; Williamson et al. Reference Williamson, Pyšek and Jarošík2005), range size was quantified using 10 by 10 km2 grids as the spatial unit. Occurrence records were mapped onto a gridded digital layer in R using the sp package (Bivand et al. Reference Pebesma, Bivand, Rowlingson, Gómez-Rubio, Hijmans, Sumner, MacQueen, Lindgren, O’ Brien, O’ Rourke, Hausmann and Meyer2024), and range size was calculated as the total number of grids occupied by species. A land-use land-cover (LULC) map of India (Roy et al. Reference Roy, Roy, Joshi, Kale, Srivastava, Srivastava, Dwevidi, Joshi, Behera, Meiyappan, Sharma, Jain, Singh, Palchowdhuri and Ramachandran2015) was used to assess invasion pressure, defined as the number of invasive species per LULC category in NWGK. The 100-m2 resolution LULC map was aggregated to 10-km2 grids to match species occurrence data, assigning the dominant LULC class to each grid. Observed counts of the number of invasive species for each LULC category were compared with expected values generated from 200 randomizations that accounted for differences in proportional area among LULC categories, using a chi-square test.
Temporal dynamics of invasion were analyzed for 38 noncultivated invasive species that were present in more than 15 grids (Osunkoya et al. Reference Osunkoya, Lock, Dhileepan and Buru2021; Supplementary Figure S4). For each species, occurrence records were aggregated by decade and standardized by dividing by the number of native species records from the same period to control for temporal variation in sampling effort. The cumulative log-ratio of invasive to native occurrences was plotted over time to generate invasion curves. Segmented regression was used to identify curve inflection points and estimate key temporal parameters, including residence time, lag duration, and spread rate. Relationships among temporal parameters, life span, life-form, and species range size were assessed using generalized linear models (GLMs) with a negative binomial error distribution, implemented in the MASS package in R (Ripley et al. Reference Ripley, Venables, Bates, Hornik, Gebhardt and Firth2024).
Expert-based Survey
We conducted an expert opinion survey in 2022, using a structured questionnaire to complement the herbarium-based analyses and comprehensively assess additional dimensions of impact (Supplementary Appendix 2). We selected 55 invasive plant species with the largest range sizes based on herbarium occurrence records for this assessment. During the initial assessment, experts identified Cosmos sulphureus Cav. as an invasive species in NWGK that was missing from our list of 55 species. Therefore, C. sulphureus was included for the expert survey, bringing the final number to 56 species. We identified 31 plant ecologists and field biologists with extensive experience in the NWGK to participate in the survey, taking care to ensure representation across diverse geographic areas within the NWGK (Supplementary Table S3). The expertise of this group spanned ecology, taxonomy, conservation, and management, with experience ranging from 10 to over 30 years and total cumulative experience of 625 years.
The questionnaire comprised six questions designed to capture key demographic and impact dimensions of invasiveness for each of the 56 invasive plant species (Morse et al. Reference Morse, Randall, Benton, Hiebert and Lu2004). Three questions addressed demographic attributes, namely, geographic range size, local abundance, and habitat occupancy. Three additional questions focused on impact-related dimensions, including recent changes in distribution, occurrence within protected areas, and impact on native biodiversity.
Three questions were multiple-choice and three were open-ended. For all questions, respondents could indicate insufficient knowledge, and such responses were excluded from the analyses (ESM2). Responses to the open-ended questions were grouped into four ordinal categories to ensure consistency with the multiple-choice responses. Expert assessments of range size were classified into four bins (1% to 10%, 11% to 40%, 41% to 70%, and >70%). Local abundance was similarly classified into four ordinal categories based on a modified Braun–Blanquet cover–abundance (BBCA) scale (McNellie et al. Reference McNellie, Dorrough and Oliver2019). Habitat breadth was defined as presence in a habitat when >20% of experts reported occurrence. Experts identified eight habitat types: evergreen forests, semi-evergreen forests, deciduous forests, rock outcrops, marshy areas, grasslands and scrub forests, agricultural fields, and human habitation. Based on the number of habitats occupied, species were categorized into four habitat-breadth classes: fewer than three habitats, three to four habitats; five to six habitats, and more than six habitats. In addition to these six species-specific questions, the questionnaire included three open-ended questions aimed at identifying: (1) invasive plant species not included in the initial list; (2) emerging invasive species; and (3) species that were formerly problematic but whose impacts have since declined (Supplementary Appendix 2).
Responses to the six species-specific questions were converted to a four-point Likert scale, enabling the calculation of a cumulative impact score for each species based on the modal expert response for each question (Likert Reference Likert1932). To justify combining scores across questions, we assessed their consistency and dimensionality using Cronbach’s alpha and principal component analysis (PCA). The high Cronbach’s alpha (α = 0.81) indicated strong internal consistency, and PCA supported a unidimensional structure, justifying aggregation into a single score. Consequently, scores across the six questions were summed to generate a cumulative impact score for each species. These cumulative scores were subsequently used to rank invasive plant species and to identify high-priority species.
Comparison of the Different Dimensions of Invasiveness
We used PCA to explore relationships among the multiple dimensions of invasiveness and assess whether species exhibit common invasion strategies or distinct combinations of invasiveness dimensions. The PCA was conducted using the factoextra package in R (Kassambara and Mundt Reference Kassambara and Mundt2020). The PCA included relative species rankings for 55 invasive plant species based on expert-derived measures of range size, habitat breadth, local abundance, occurrence in protected areas, impacts on biodiversity, and current temporal trends, together with range size estimated from the herbarium-based approach. In addition, we used Spearman’s rank-correlation coefficient to examine the relationship between species rankings based on range size derived from herbarium records and those obtained from expert assessments.
Comparison of Invasive Plants of NWGK with Global and National Databases
We compiled a global list of invasive plant species from the Global Impact Dataset of Invasive Alien Species (GIDIAS). GIDIAS includes more than 3,000 invasive species across multiple taxa; however, our analysis focused only on 1,188 invasive plants (Bacher et al. Reference Bacher, Ryan-Colton, Coiro, Cassey, Galil, Nuñez, Ansong, Dehnen-Schmutz, Fayvush, Fernandez, Hiremath, Ikegami, Martinou, McDermott and Preda2025). In parallel, we assembled a list of plant species identified as invasive in India from the Global Register of Introduced and Invasive Species (GRIIS; Sankaran et al. Reference Sankaran, Khuroo, Raghavan, Molur, Kumar, Wong and Pagad2021). These global and national databases were compared with species identified as problematic invaders in the NWGK.
For the NWGK invasive species occurring in common with the global and national datasets, we evaluated their relative ranking by comparing species ranks. For this analysis, global-scale rankings were derived from GIDIAS. The original GIDIAS impact scores (0 to 3) were modified to a 0 to 5 scale. Species absent from GIDIAS were assigned a score of 0, while species listed in GIDIAS but lacking an impact score were assigned a score of 1. The original GIDIAS scores of 0 to 3 were then rescaled to values between 2 and 5. In the GIDIAS database, species had multiple scores across different categories: we calculated the mean of the impact scores reported under the “impact on nature” dimension for each species to generate a species-specific score, which was subsequently used for the species rankings. National-scale rankings were derived from the dataset provided by Sandilyan (Reference Sandilyan2019), which reports information on several dimensions of invasion, including invasiveness, range size, and species impacts. The impact dimension includes three subcategories: impacts on biodiversity, ecosystem functions and services, and economic and human health. The invasiveness dimension includes four subcategories related to species traits, such as mode of reproduction and rate of spread. Together with range size, these resulted in eight assessment categories. Species were assigned a score of 1 if an impact was reported for a given category and 0 if it was absent. Scores were then summed across these eight categories to generate a species-specific score, which was subsequently used to rank species. In addition, we also identified another nationwide list of high-priority invaders comprising 11 invasive plant species; all of which were a subset of the 79 invasive species identified in our study. Species in this list were ranked using the scores reported in the original source (Mungi et al. Reference Mungi, Kaushik, Mohanty, Rastogi, Johnson and Qureshi2019). As GRIIS does not assign impact or priority scores to invasive species, it was not included in this ranking comparison. Finally, for species common across multiple datasets—one global (GIDIAS), two national (Mungi et al. Reference Mungi, Kaushik, Mohanty, Rastogi, Johnson and Qureshi2019; Sandilyan Reference Sandilyan2019), and two NWGK-specific lists generated in this study (herbarium- and expert-based rankings)—we evaluated concordance in species prioritization by conducting pairwise Spearman’s rank-correlation analysis.
Results and Discussion
Identification of the Invasive Species in This Region
We identified 347 non-native plant species, that were naturalized or invasive across the Indian subcontinent (ESM 2). Of these, 282 species were present in the NWGK, and 79 species (approximately 25% of the naturalized species) were identified as invasive. Despite its limited geographic extent (approximately 70,000 km2), the NWGK contains more than half of the subcontinent’s non-native, naturalized flora, and approximately 25% of these are invasive (Inderjit et al. Reference Inderjit, van Kleunen, Hejda, Babu, Majumdar, Singh, Singh, Salamma, Rao and Pyšek2018; Sankaran et al. Reference Sankaran, Khuroo, Raghavan, Molur, Kumar, Wong and Pagad2021). This exceeds expectations based on the “tens rule” (Williamson and Fitter Reference Williamson and Fitter1996) but aligns with recent global syntheses that suggest that the tens rule may oversimplify invasion processes and underestimate the magnitude of impacts (Jeschke and Heger Reference Jeschke and Heger2018).
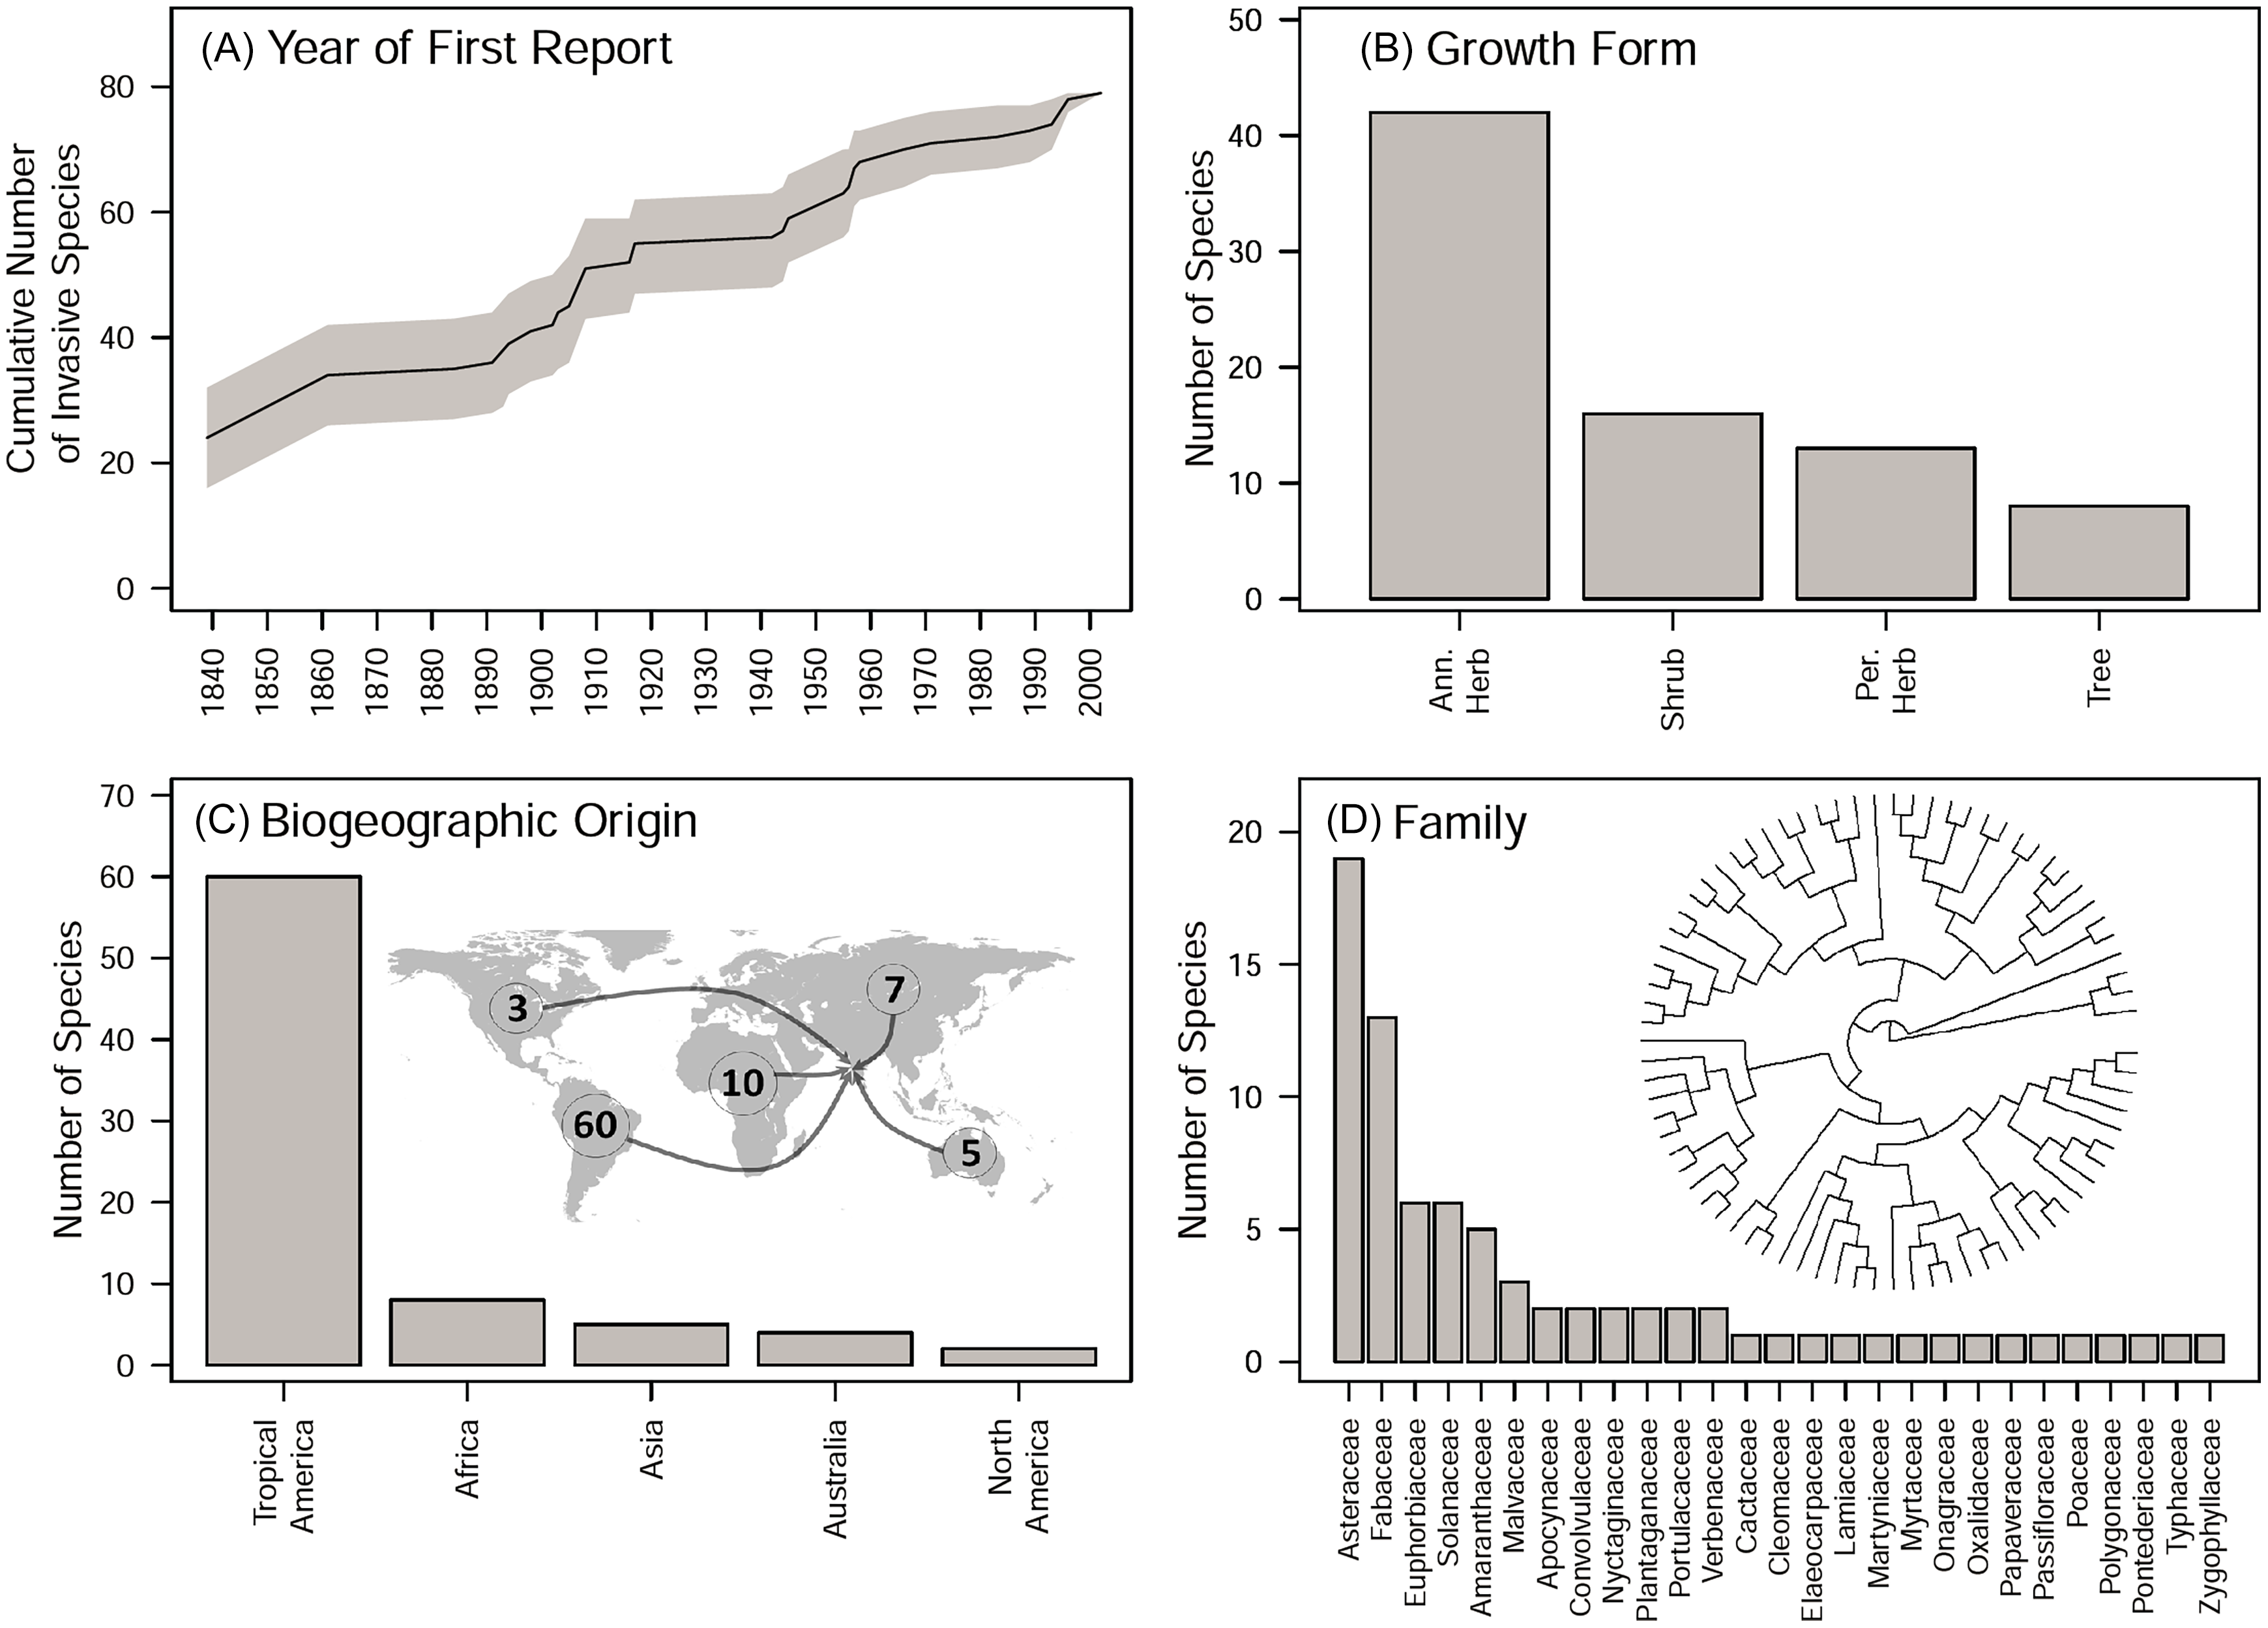
The discovery frequency of invasive plant species in this region has remained relatively constant since 1840, with temporal fluctuations likely reflecting variation in sampling effort (Figure 1A). More than half of the invasive species were annual herbs, whereas trees were the least represented growth form (Figure 1B). The biogeographic origin of species was highly skewed, with the large majority originating from South America, and with comparatively minor contributions from Africa, other parts of Asia, Australia, and North America (Figure 1C). These skewed distributions are congruent with trends observed in South Asia and are likely driven by climatic similarity and historical trade linkages (Gulzar et al. Reference Gulzar, Wani, Hassan, Reddy, Shrestha, Mukul, Shabbir, Iqbal, Ranwala, Sujanapal, Rashid and Khuroo2024). Taxonomic representation was also skewed, with most species belonging to the families Asteraceae and Fabaceae, followed by smaller contributions from Euphorbiaceae, Solanaceae, and Amaranthaceae (Figure 1D). Other families were represented by only one to three species. The domination by Asteraceae and Fabaceae is consistent with regional and global patterns that likely reflect the large family sizes and life-history traits adapted to seasonal climates and high levels of disturbance (Gulzar et al. Reference Gulzar, Wani, Hassan, Reddy, Shrestha, Mukul, Shabbir, Iqbal, Ranwala, Sujanapal, Rashid and Khuroo2024; Stohlgren et al. Reference Stohlgren, Pyšek, Kartesz, Nishino, Pauchard, Winter, Pino, Richardson, Wilson, Murray, Phillips, Ming-yang, Celesti-Grapow and Font2011).
Invasive plants of the Northern Western Ghats and Konkan region (NWGK). (A) Discovery of invasive species based on the date of first report. The 95% confidence band was estimated using nonparametric bootstrapping where first-report dates were resampled 1,000 times with replacement. (B) Distribution of growth form: annual herbs, shrubs, perennial herbs, trees. (C) Biogeographic origin: continent. (D) Taxonomic affiliation: family. The labeled version of the phylogenetic tree is available in Supplementary Figure S5.

Figure 1. Long description
Panel A: A line graph shows the cumulative number of invasive species over time, with the x-axis representing the year of first report from 1840 to 2000 and the y-axis representing the cumulative number of invasive species. The graph includes a 95% confidence band estimated using nonparametric bootstrapping. Panel B: A vertical bar graph displays the distribution of growth forms, with the x-axis listing categories (annual herbs, shrubs, perennial herbs, trees) and the y-axis showing the number of species. Annual herbs have the highest count, followed by shrubs, perennial herbs, and trees. Panel C: A vertical bar graph illustrates the biogeographic origin of invasive species by continent, with the x-axis listing continents (Tropical America, Africa, Asia, Australia, North America) and the y-axis showing the number of species. Tropical America has the highest count, followed by Asia, Australia, North America, and Africa. Panel D: A vertical bar graph presents the taxonomic affiliation of invasive species by family, with the x-axis listing families and the y-axis showing the number of species. The Asteraceae family has the highest count, followed by other families in descending order. A phylogenetic tree diagram is also included to show the taxonomic relationships.
Range Size and Distribution of the Invasive Species
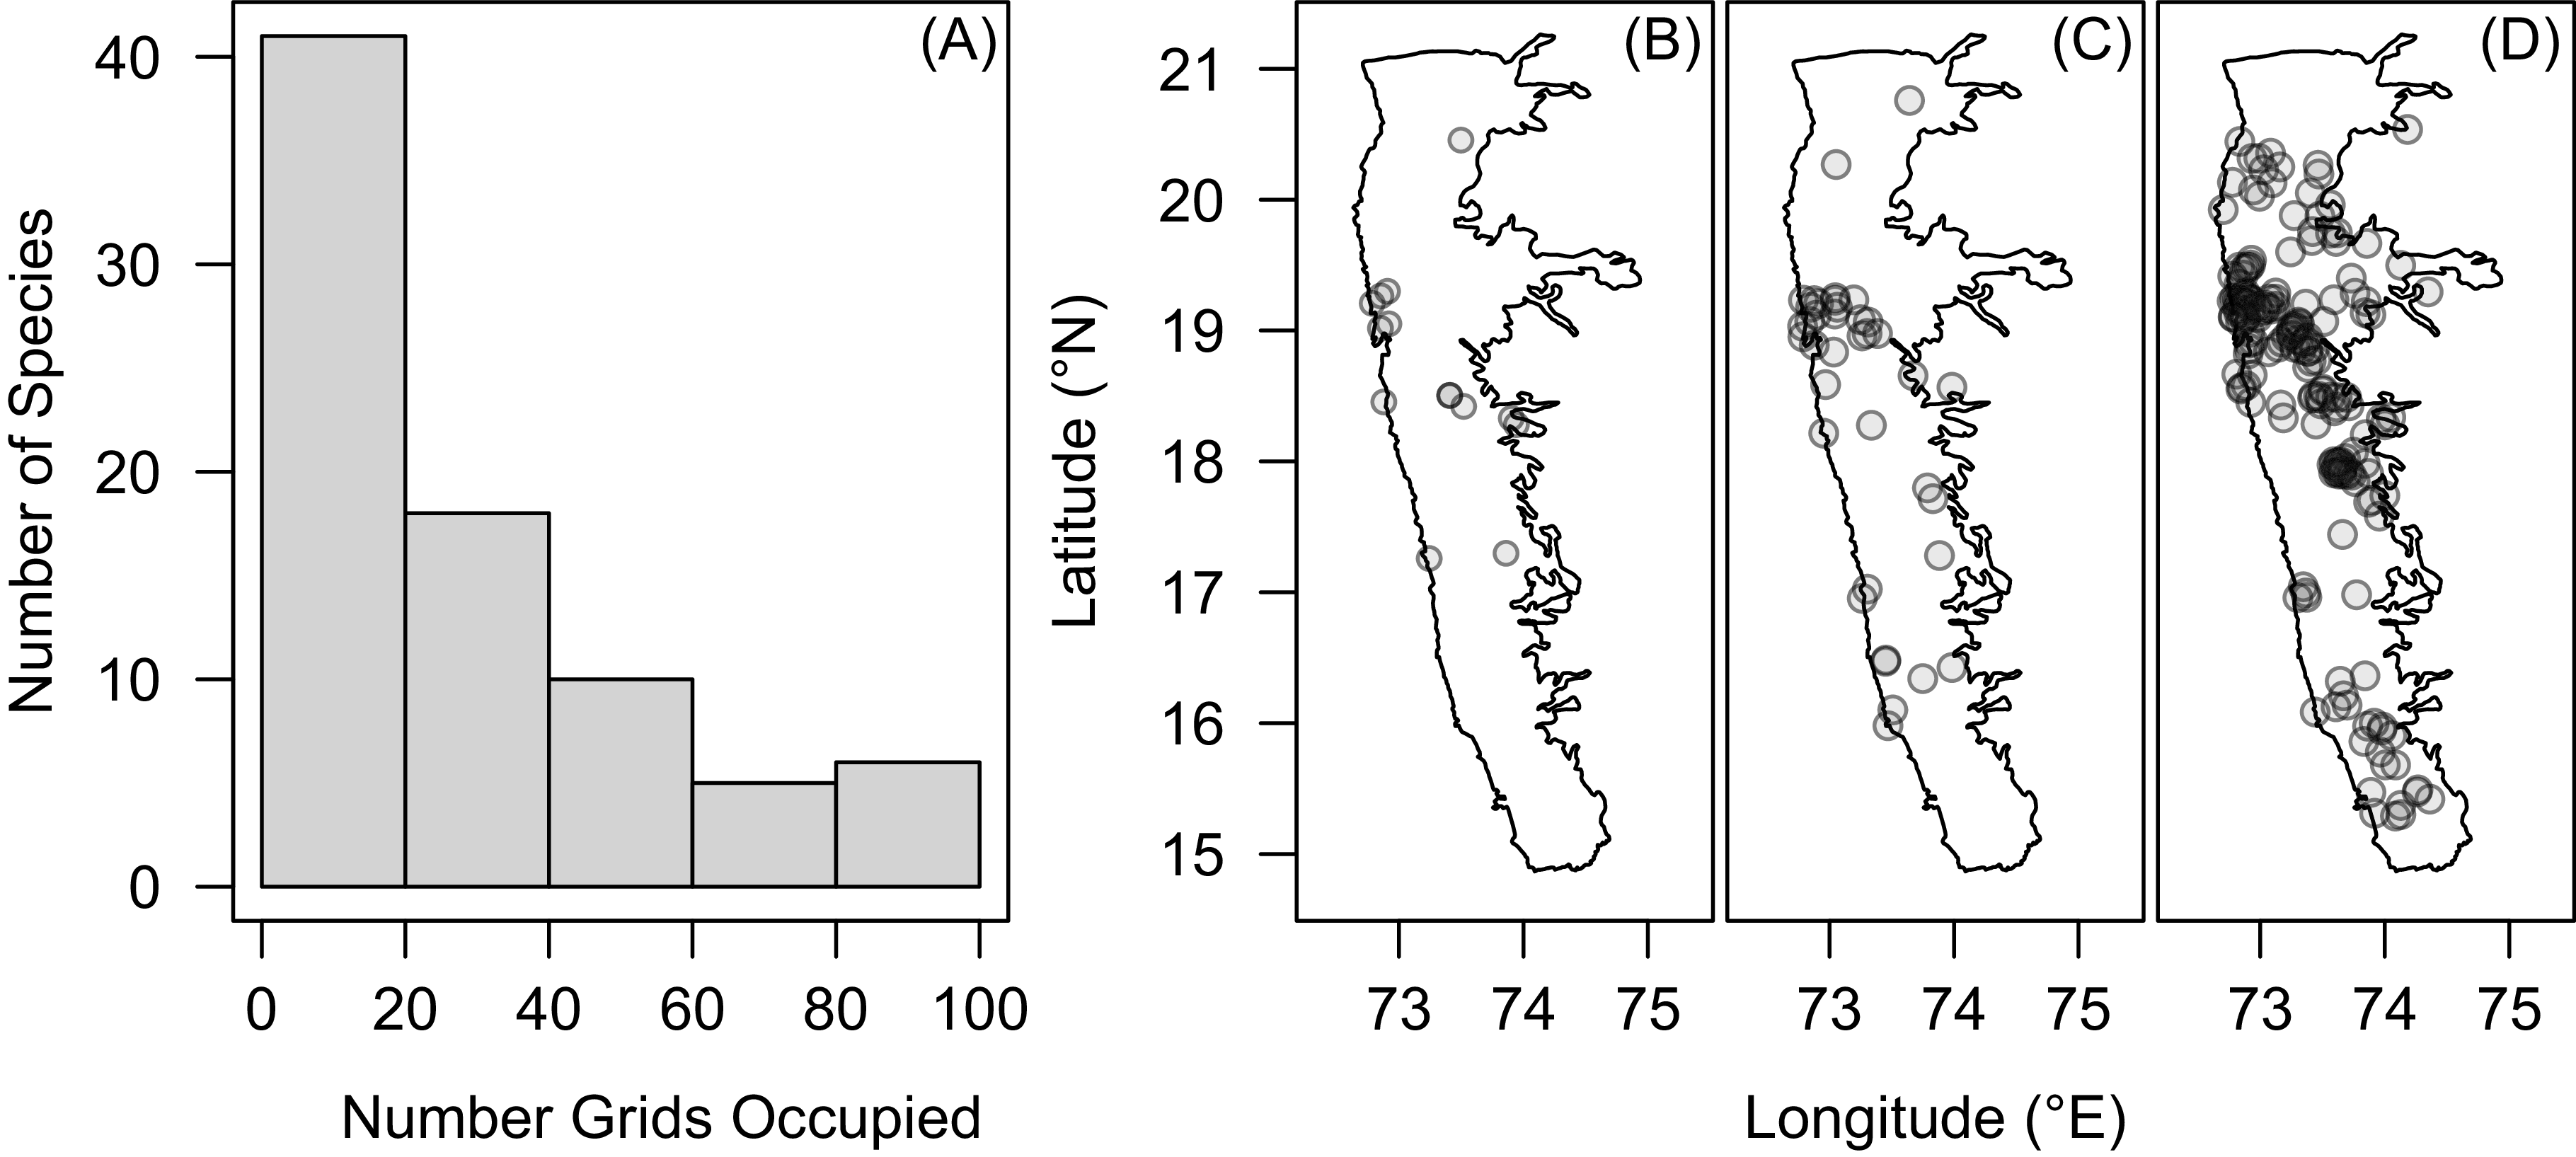
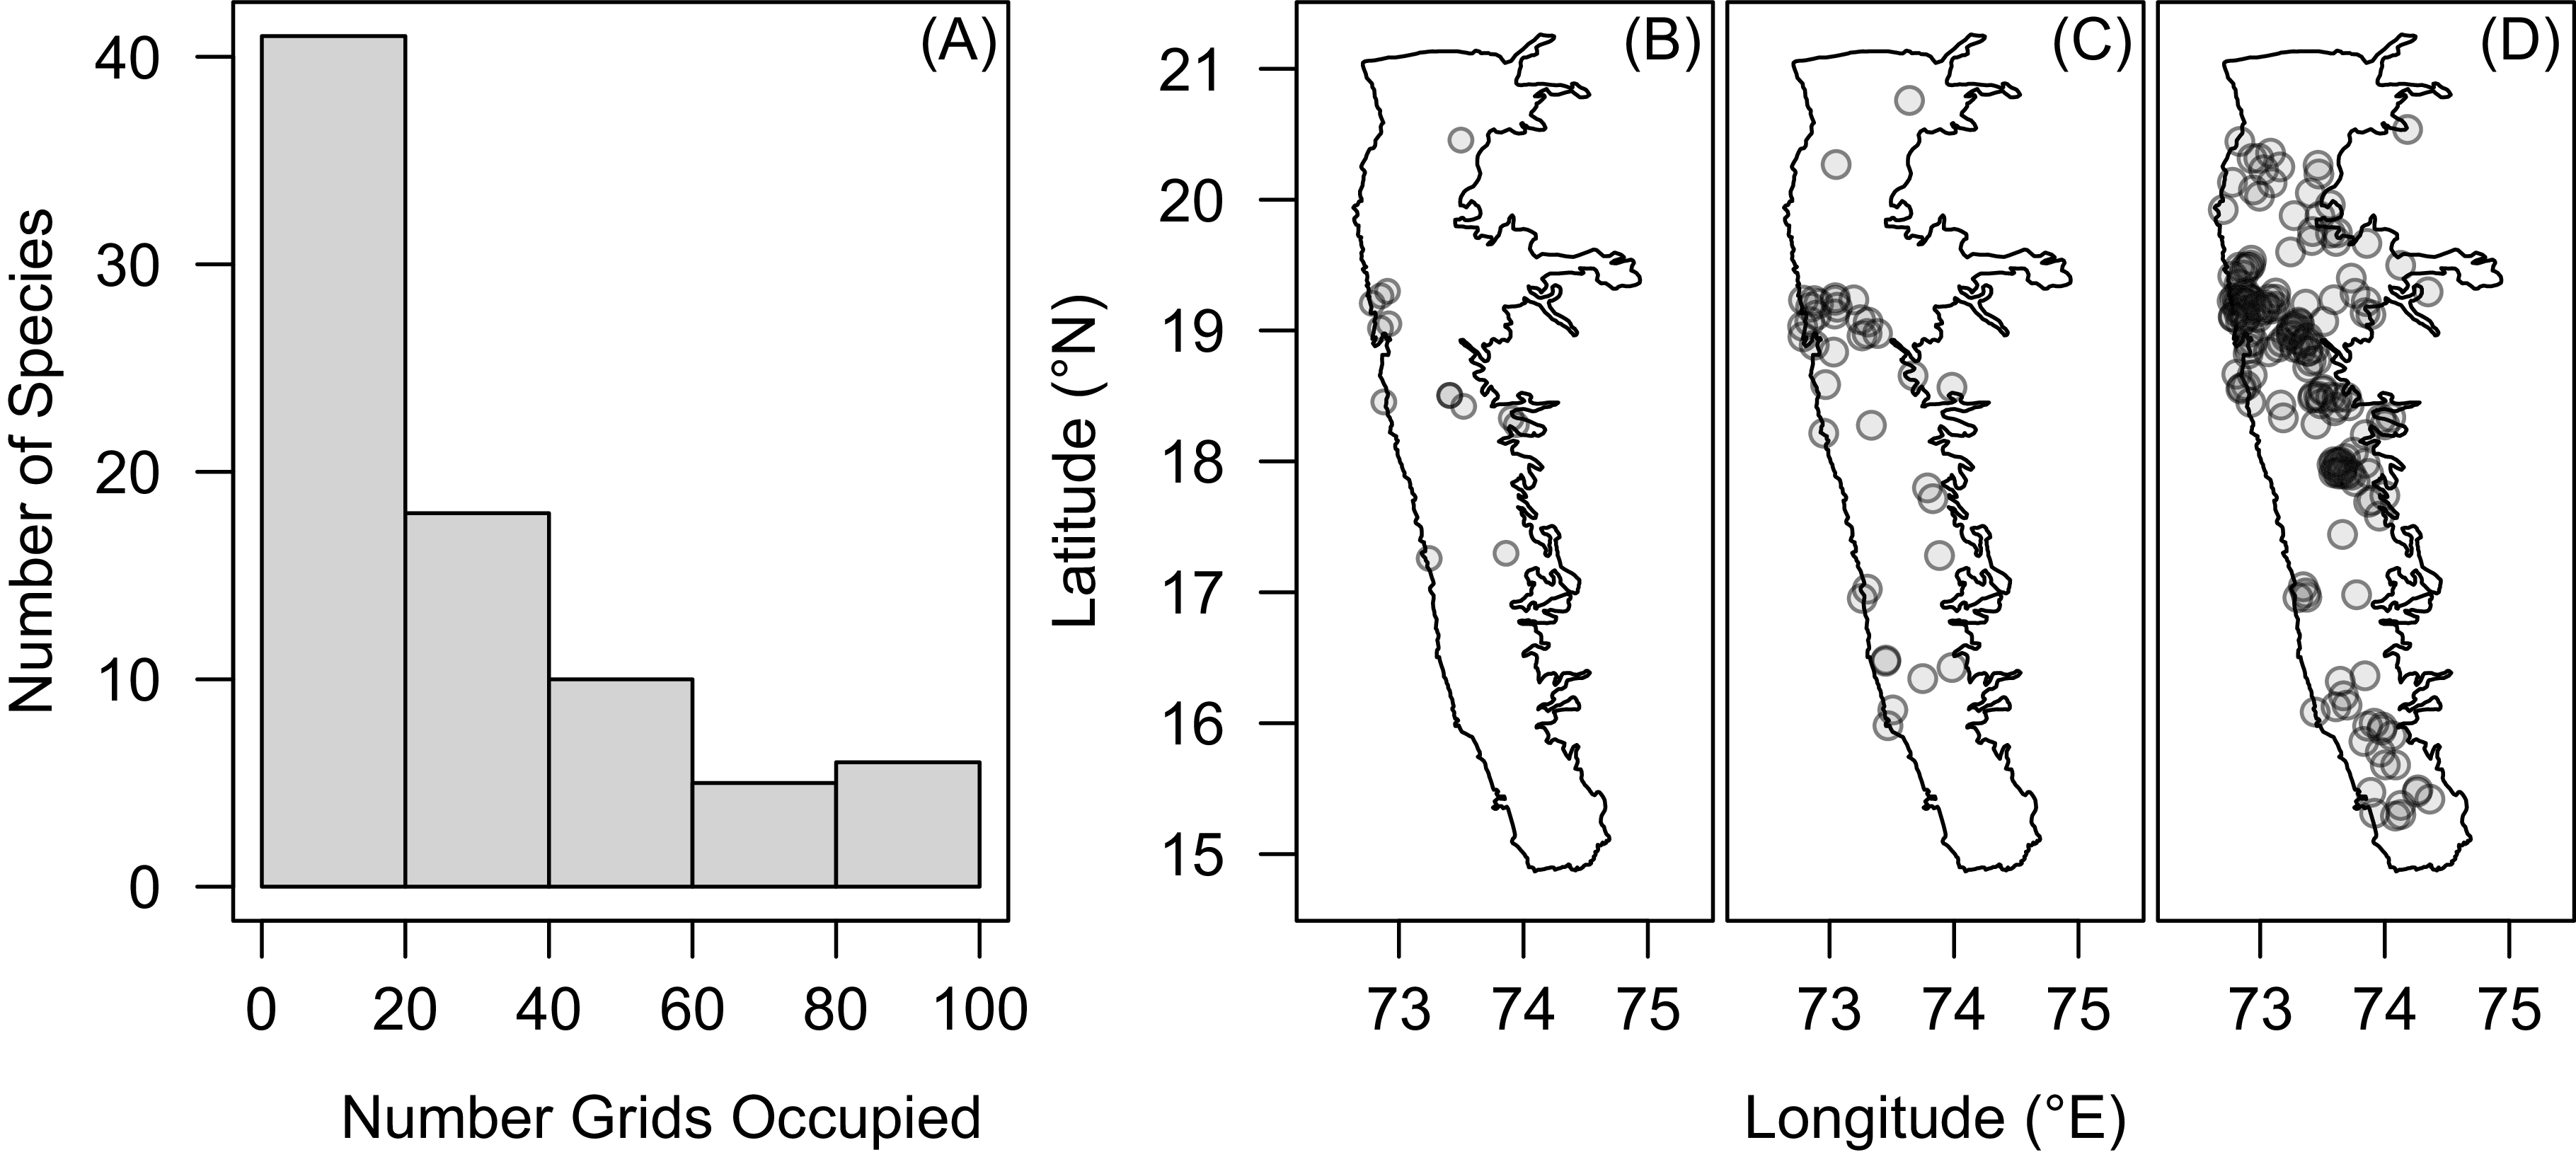
Range sizes of invasive plant species in the NWGK estimated from the herbarium-based approach varied by an order of magnitude. Approximately 15% of species were highly widespread, occupying around 20% of the surveyed area, but more than 50% of the species had limited distributions (Figure 2). The distribution of invasive plants mirrored the proportional area of land-use categories, with croplands and deciduous forests supporting the highest numbers. However, after we accounted for relative coverage of LULC categories, mangroves and human-dominated landscapes harbored a disproportionately larger number of invasive species than expected by chance. No differences between expected and observed numbers were detected for the other LULC categories (Supplementary Figure S6). The prevalence in areas of human habitation is consistent with expectations based on high introduction frequencies, greater disturbance, and underutilized niches (Hierro et al. Reference Hierro, Villarreal, Eren, Graham and Callaway2006). Disturbance in mangrove ecosystems is known to facilitate introduced species (Biswas et al. Reference Biswas, Biswas, Limon, Yan, Xu and Khan2018), and is consistent with the higher number of invasive plants found in mangroves in this region. Given the important ecosystem services provided by mangroves (Bouillon et al. Reference Bouillon, Borges, Castañeda-Moya, Diele, Dittmar, Duke, Kristensen, Lee, Marchand, Middelburg, Rivera-Monroy, Smith and Twilley2008; Donato et al. Reference Donato, Kauffman, Murdiyarso, Kurnianto, Stidham and Kanninen2011), the high incidence of invasive plants in these sensitive ecosystems warrants increased monitoring and proactive management.
Range size estimates of invasive plants of Northern Western Ghats and Konkan (NWGK) using herbarium collections. (A) Histogram of the number of grids occupied by species. Representative examples of species with (B) low: Cosmos bipinnatus Cav.; (C) medium: Acacia auriculiformis A. Cunn. ex Benth.; and (D) high: Alternanthera sessilis (L.) DC. geographic extent.
Temporal Dynamics
For the 38 species with sufficient sample sizes to examine temporal dynamics of invasion, we observed distinct invasion trajectories (Supplementary Figure S7). Most species (>90 %) had lag durations that ranged between 0 and 40 yr, but the majority of these showed no detectable lag phase (Supplementary Figure S8). In examining the relationship between invasion success and the invasion dynamics, we saw that residence time was positively associated with range size (P < 0.001), and lag duration was negatively associated with range size (P < 0.05). Thus, shorter lag durations likely reflect rapid establishment and spatial expansion following introduction, potentially due to early release from biotic resistance (Larkin Reference Larkin2012). Life span was marginally related to range size (P = 0.06), with annuals occupying larger ranges than perennials (Supplementary Table S4). Identifying and quantifying these temporal patterns can help anticipate future spread and control species in early stages.
Expert-based Assessment of Demographic and Impact Dimensions
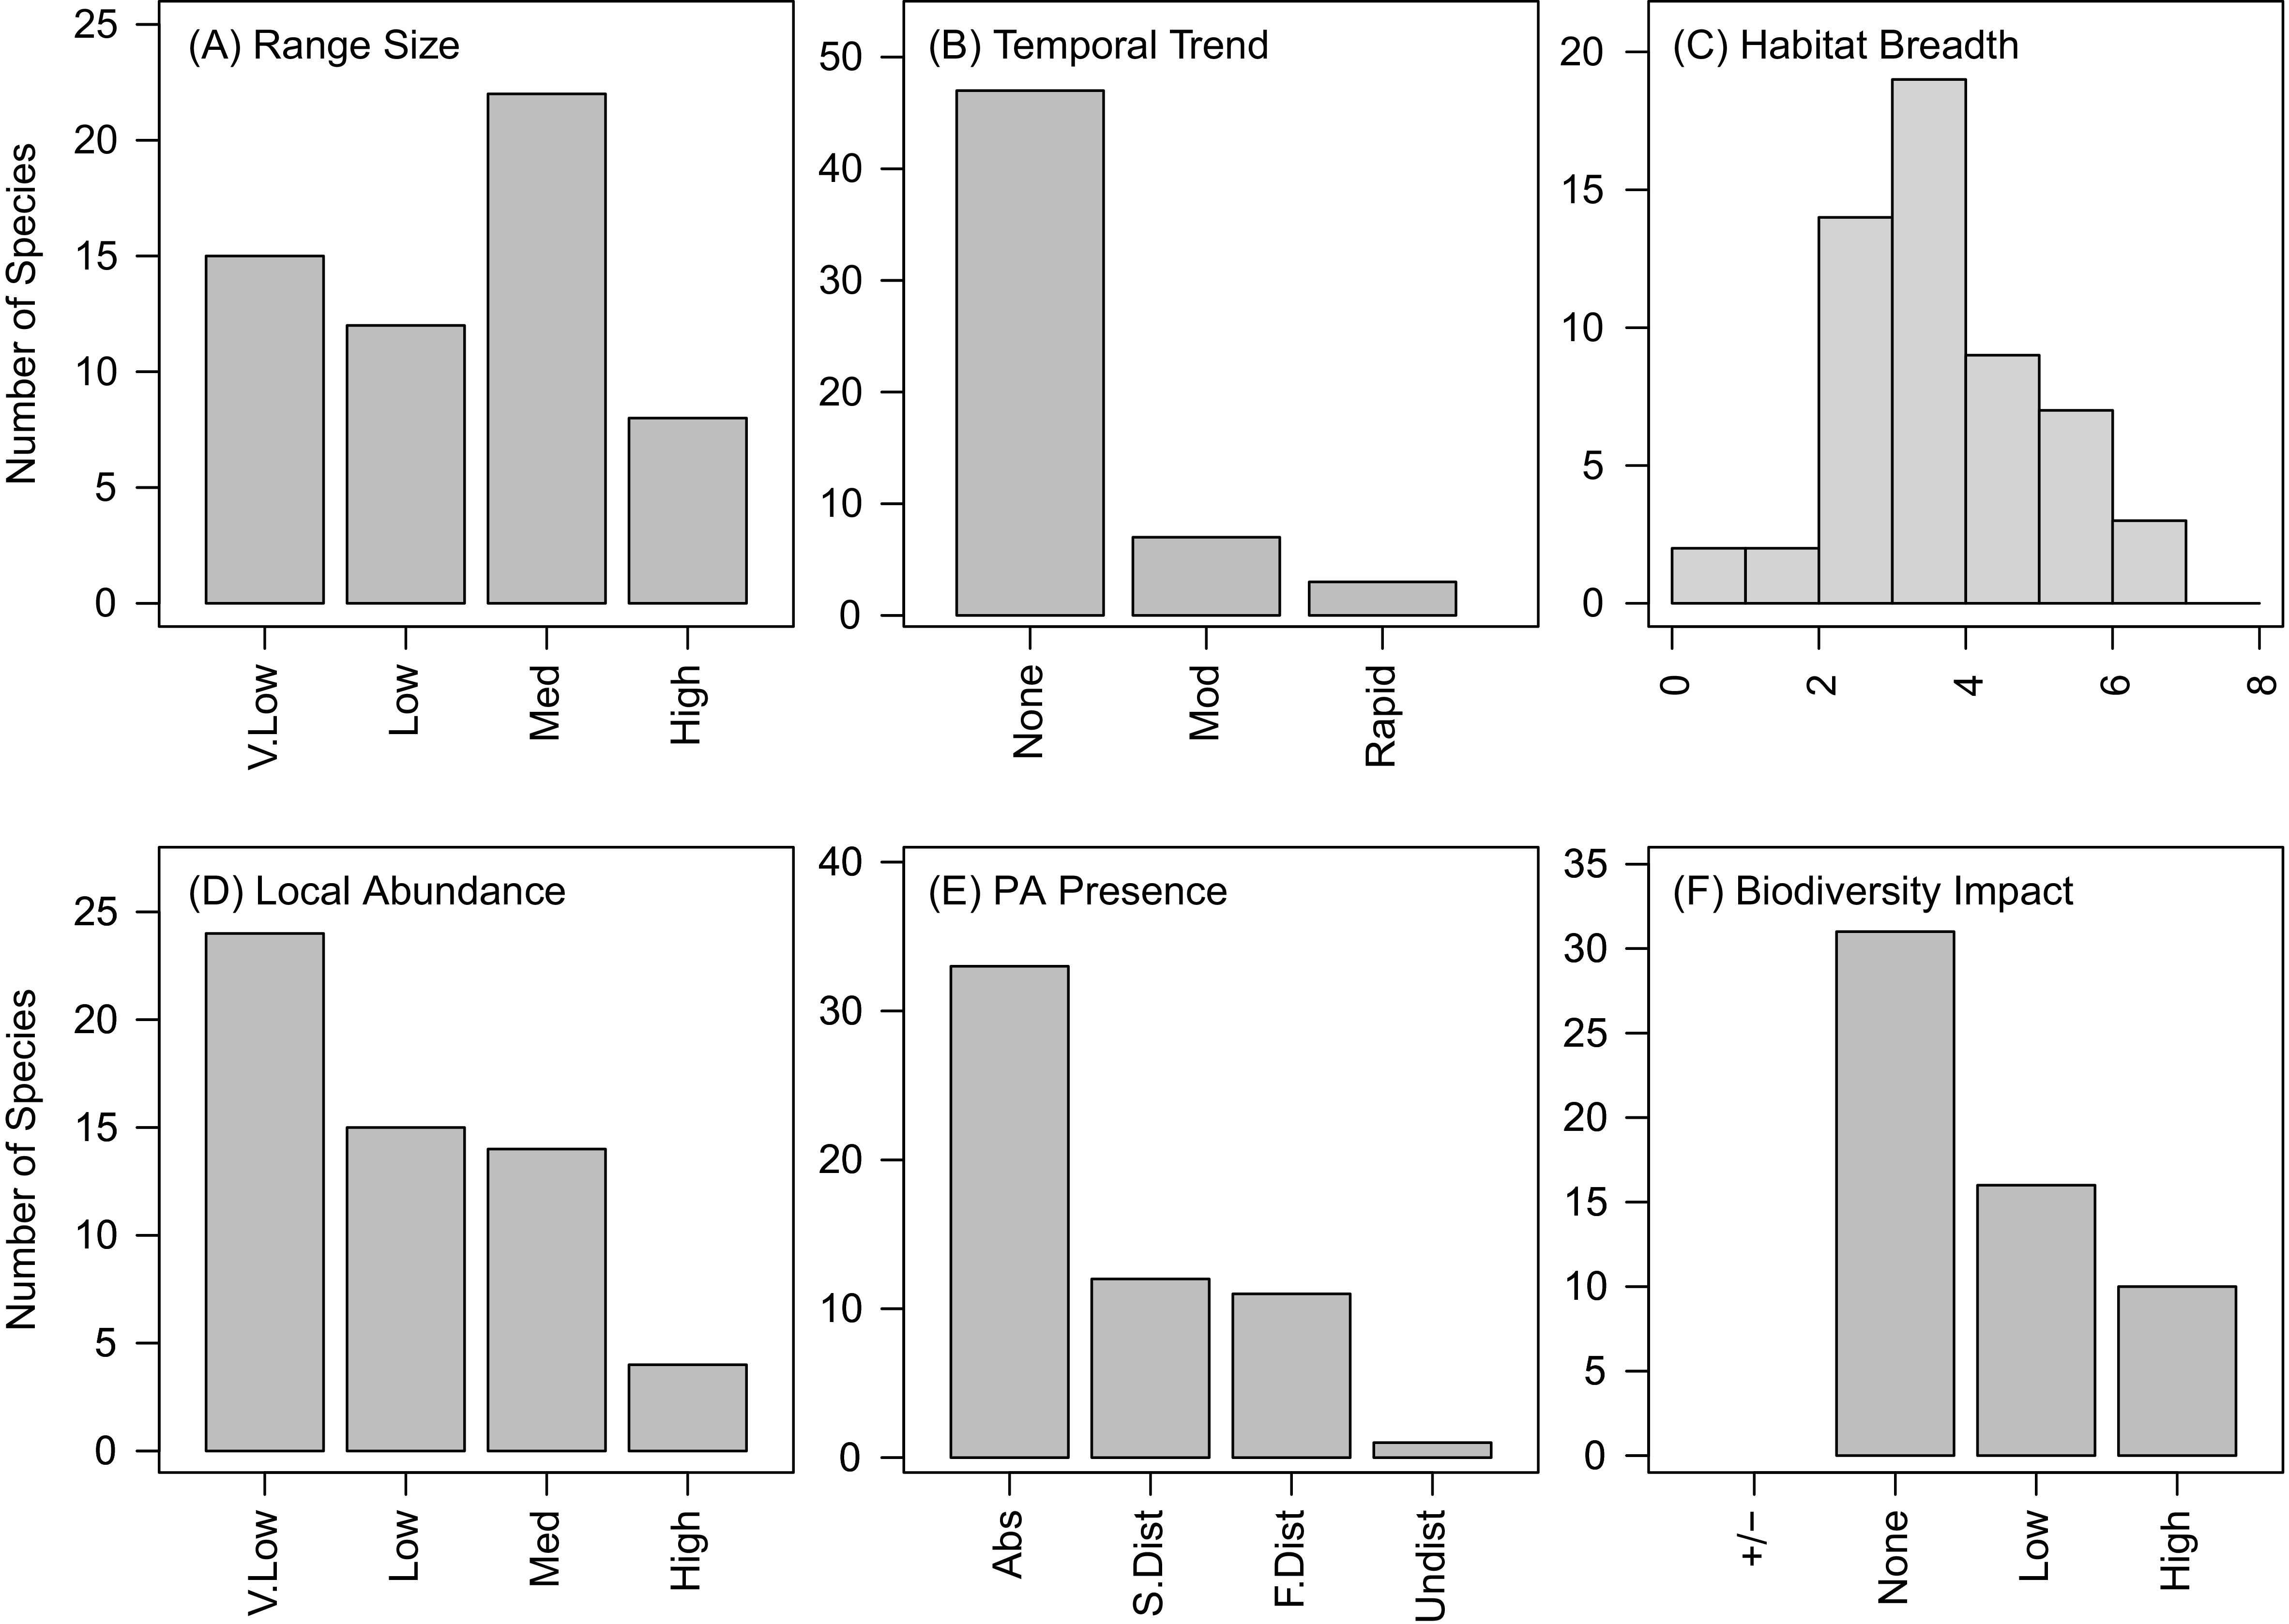
Because herbarium records can be subject to temporal lags and sampling biases, we complemented this approach with expert assessments to quantify recent distribution, spread, local abundance, and impact for 56 invasive plants. According to expert assessments, approximately half of the species exhibited medium to high range sizes (Figure 3A). With respect to recent change in range size, experts suggest that the majority showed no change over the past three decades, and only around 15% of species have increased in range during this period (Figure 3B). Experts did not identify declining trends for any species over the last 30 yr, with the exception of Parthenium hysterophorus L., which they suggested is possibly due to displacement by other emerging invasive species such as [Senna uniflora (Mill.) H.S. Irwin & Barneby] and [Mesosphaerum suaveolens (L.) Kuntze]. Additionally, most species occurred across multiple habitat types, with relatively few habitat specialists (Figure 3C).
Distribution of invasive plants along different dimensions of invasion obtained through expert-based surveys. (A) Range size; (B) temporal trend: change in range size; (C) habitat breadth: number of habitats occupied; (D) local abundance; (E) PA Presence: presence in protected areas (PA) qualified by disturbance levels; and (F) biodiversity impact. Abbreviations used: V.low, very low; Med, medium; Mod, moderate; Abs, absent; S.dist, sometimes disturbed; F.dist, frequently disturbed; Undist, undisturbed.
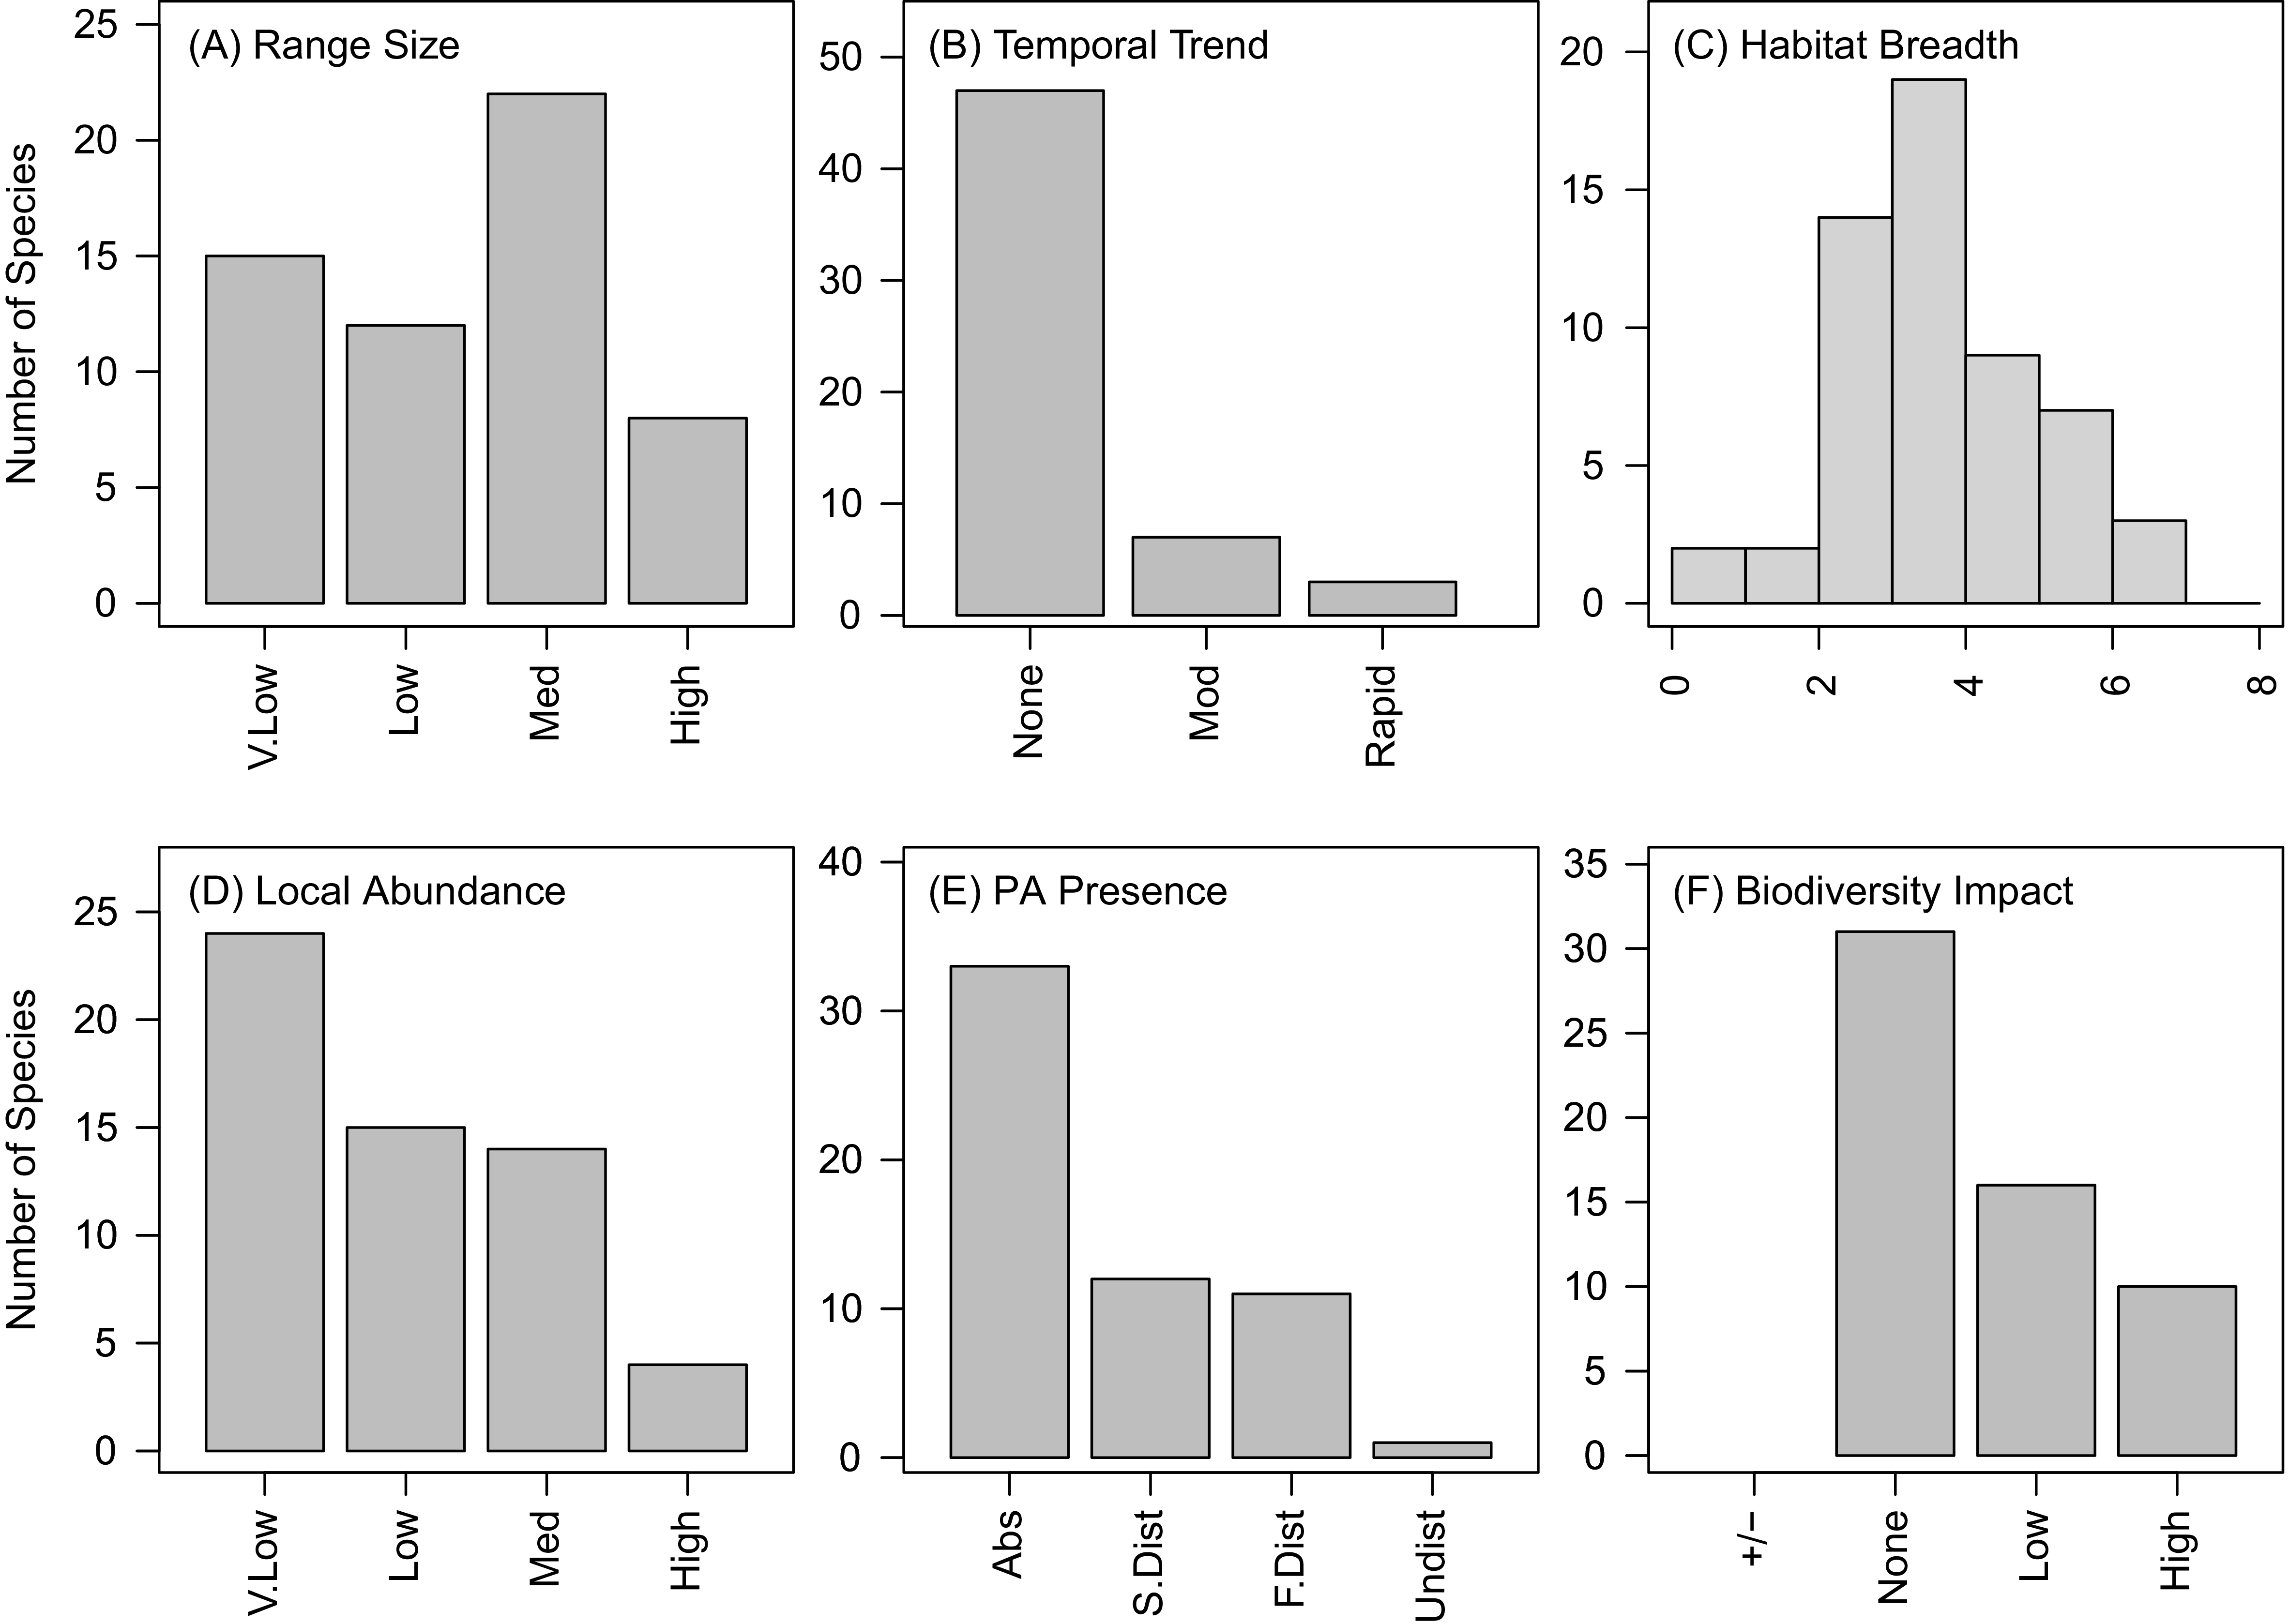
According to experts, local abundance was generally low, with most species classified as having very low to low abundance (Figure 3D). Nonetheless, around 30% of species were reported to have moderate to high local abundance. Because local abundance, range size, and per capita effects jointly determine invasion impact (Parker et al. Reference Parker, Simberloff, Lonsdale, Goodell, Wonham, Kareiva, Williamson, von Holle, Moyle, Byers and Goldwasser1999), these moderate- to high-abundance species are likely to drive disproportionate ecological effects. Approximately half of the invasive plants were reported to occur within protected areas, but predominantly in disturbed habitats at the fringes of these protected areas (Figure 3E). Notably, [Chromolaena odorata (L.) R.M.King & H.Rob]. was the only species that was consistently reported from undisturbed areas within protected sites. These findings support evidence that protected areas can restrict invasive species establishment and impacts (Mungi et al. Reference Mungi, Qureshi and Jhala2021). Around 45% of the invasive species negatively affected local biodiversity, but according to experts, most of the others did not have any discernible impacts on biodiversity (Figure 3F). The experts did not identify any species (except for C. sulphureus) that were not already included in our initial list, which validates that our list of invasive species for this region was comprehensive. The experts identified the following six species that were not included in our list as potentially emerging invaders of NWGK: S. uniflora, [Gliricidia sepium (Jacq.) Kunth], [Tecoma stans (L.) Juss. ex. Kunth], [Ipomoea parasitica (Kunth) G. Don], Mikania micrantha Kunth, and Physalis peruviana L. Finally, experts did not identify any species that were formerly invasive but should no longer be regarded as problematic.
Identifying the Major Axes of Variation in Dimensions of Invasiveness
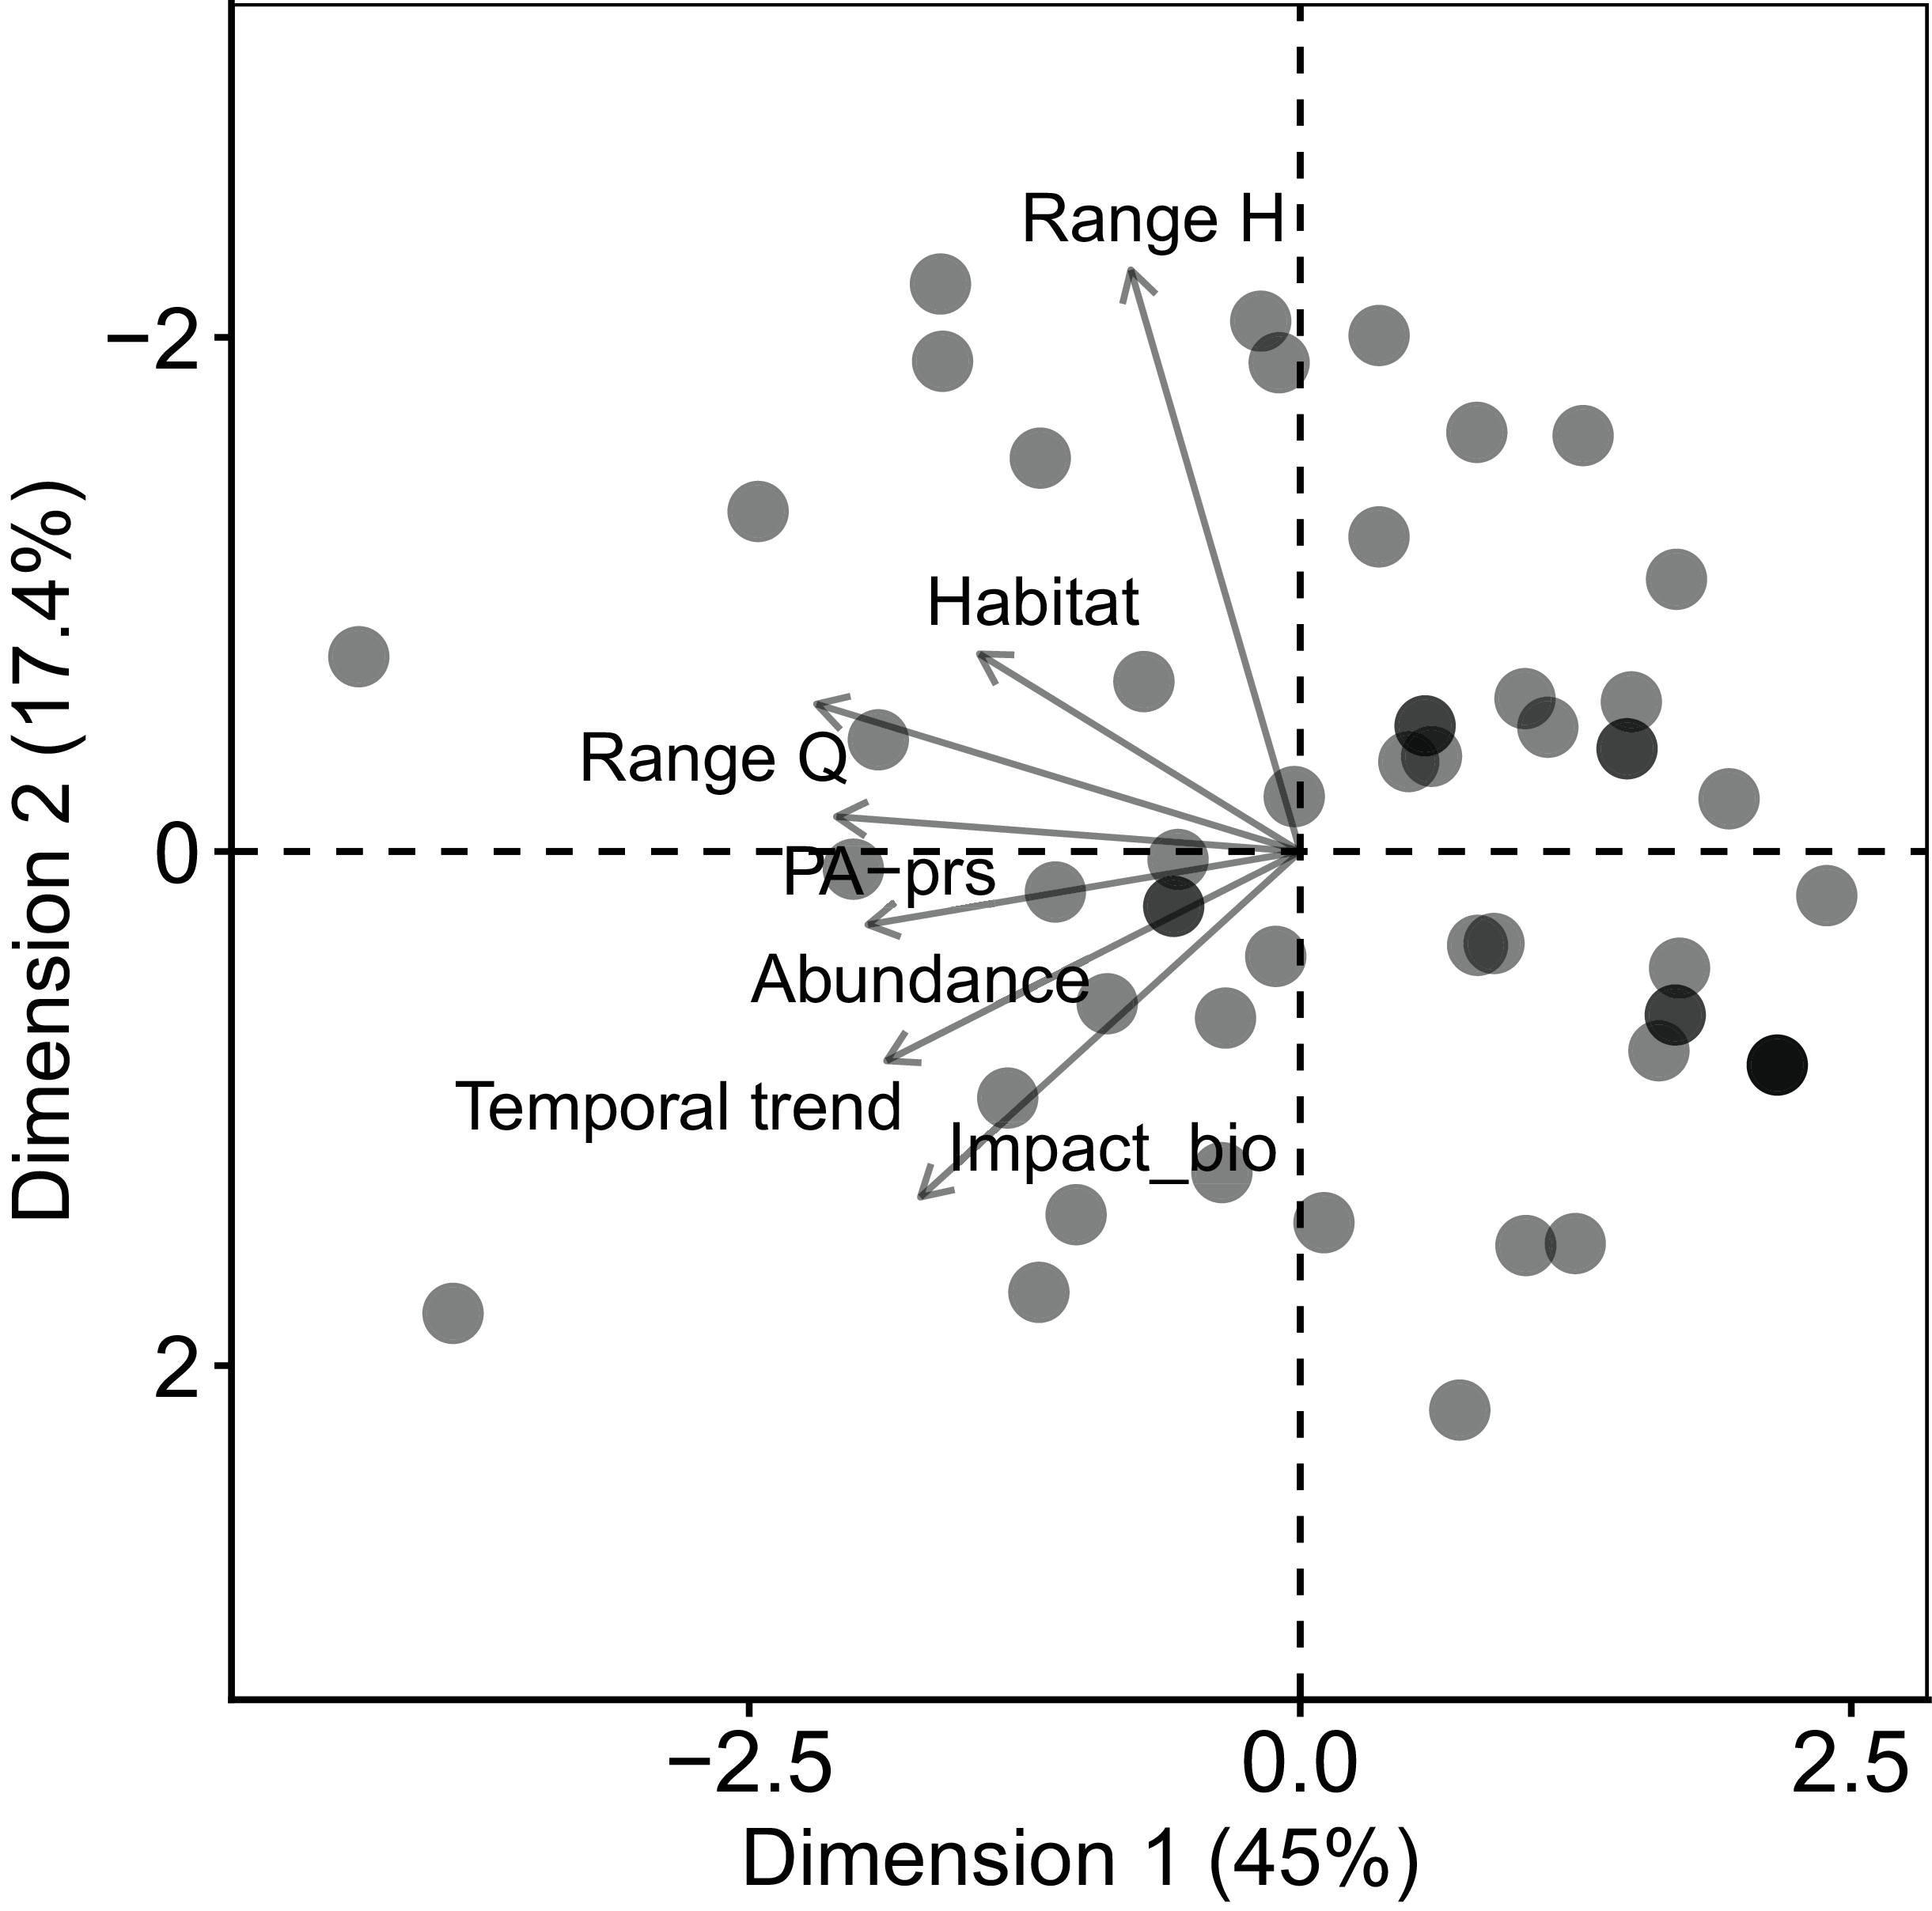
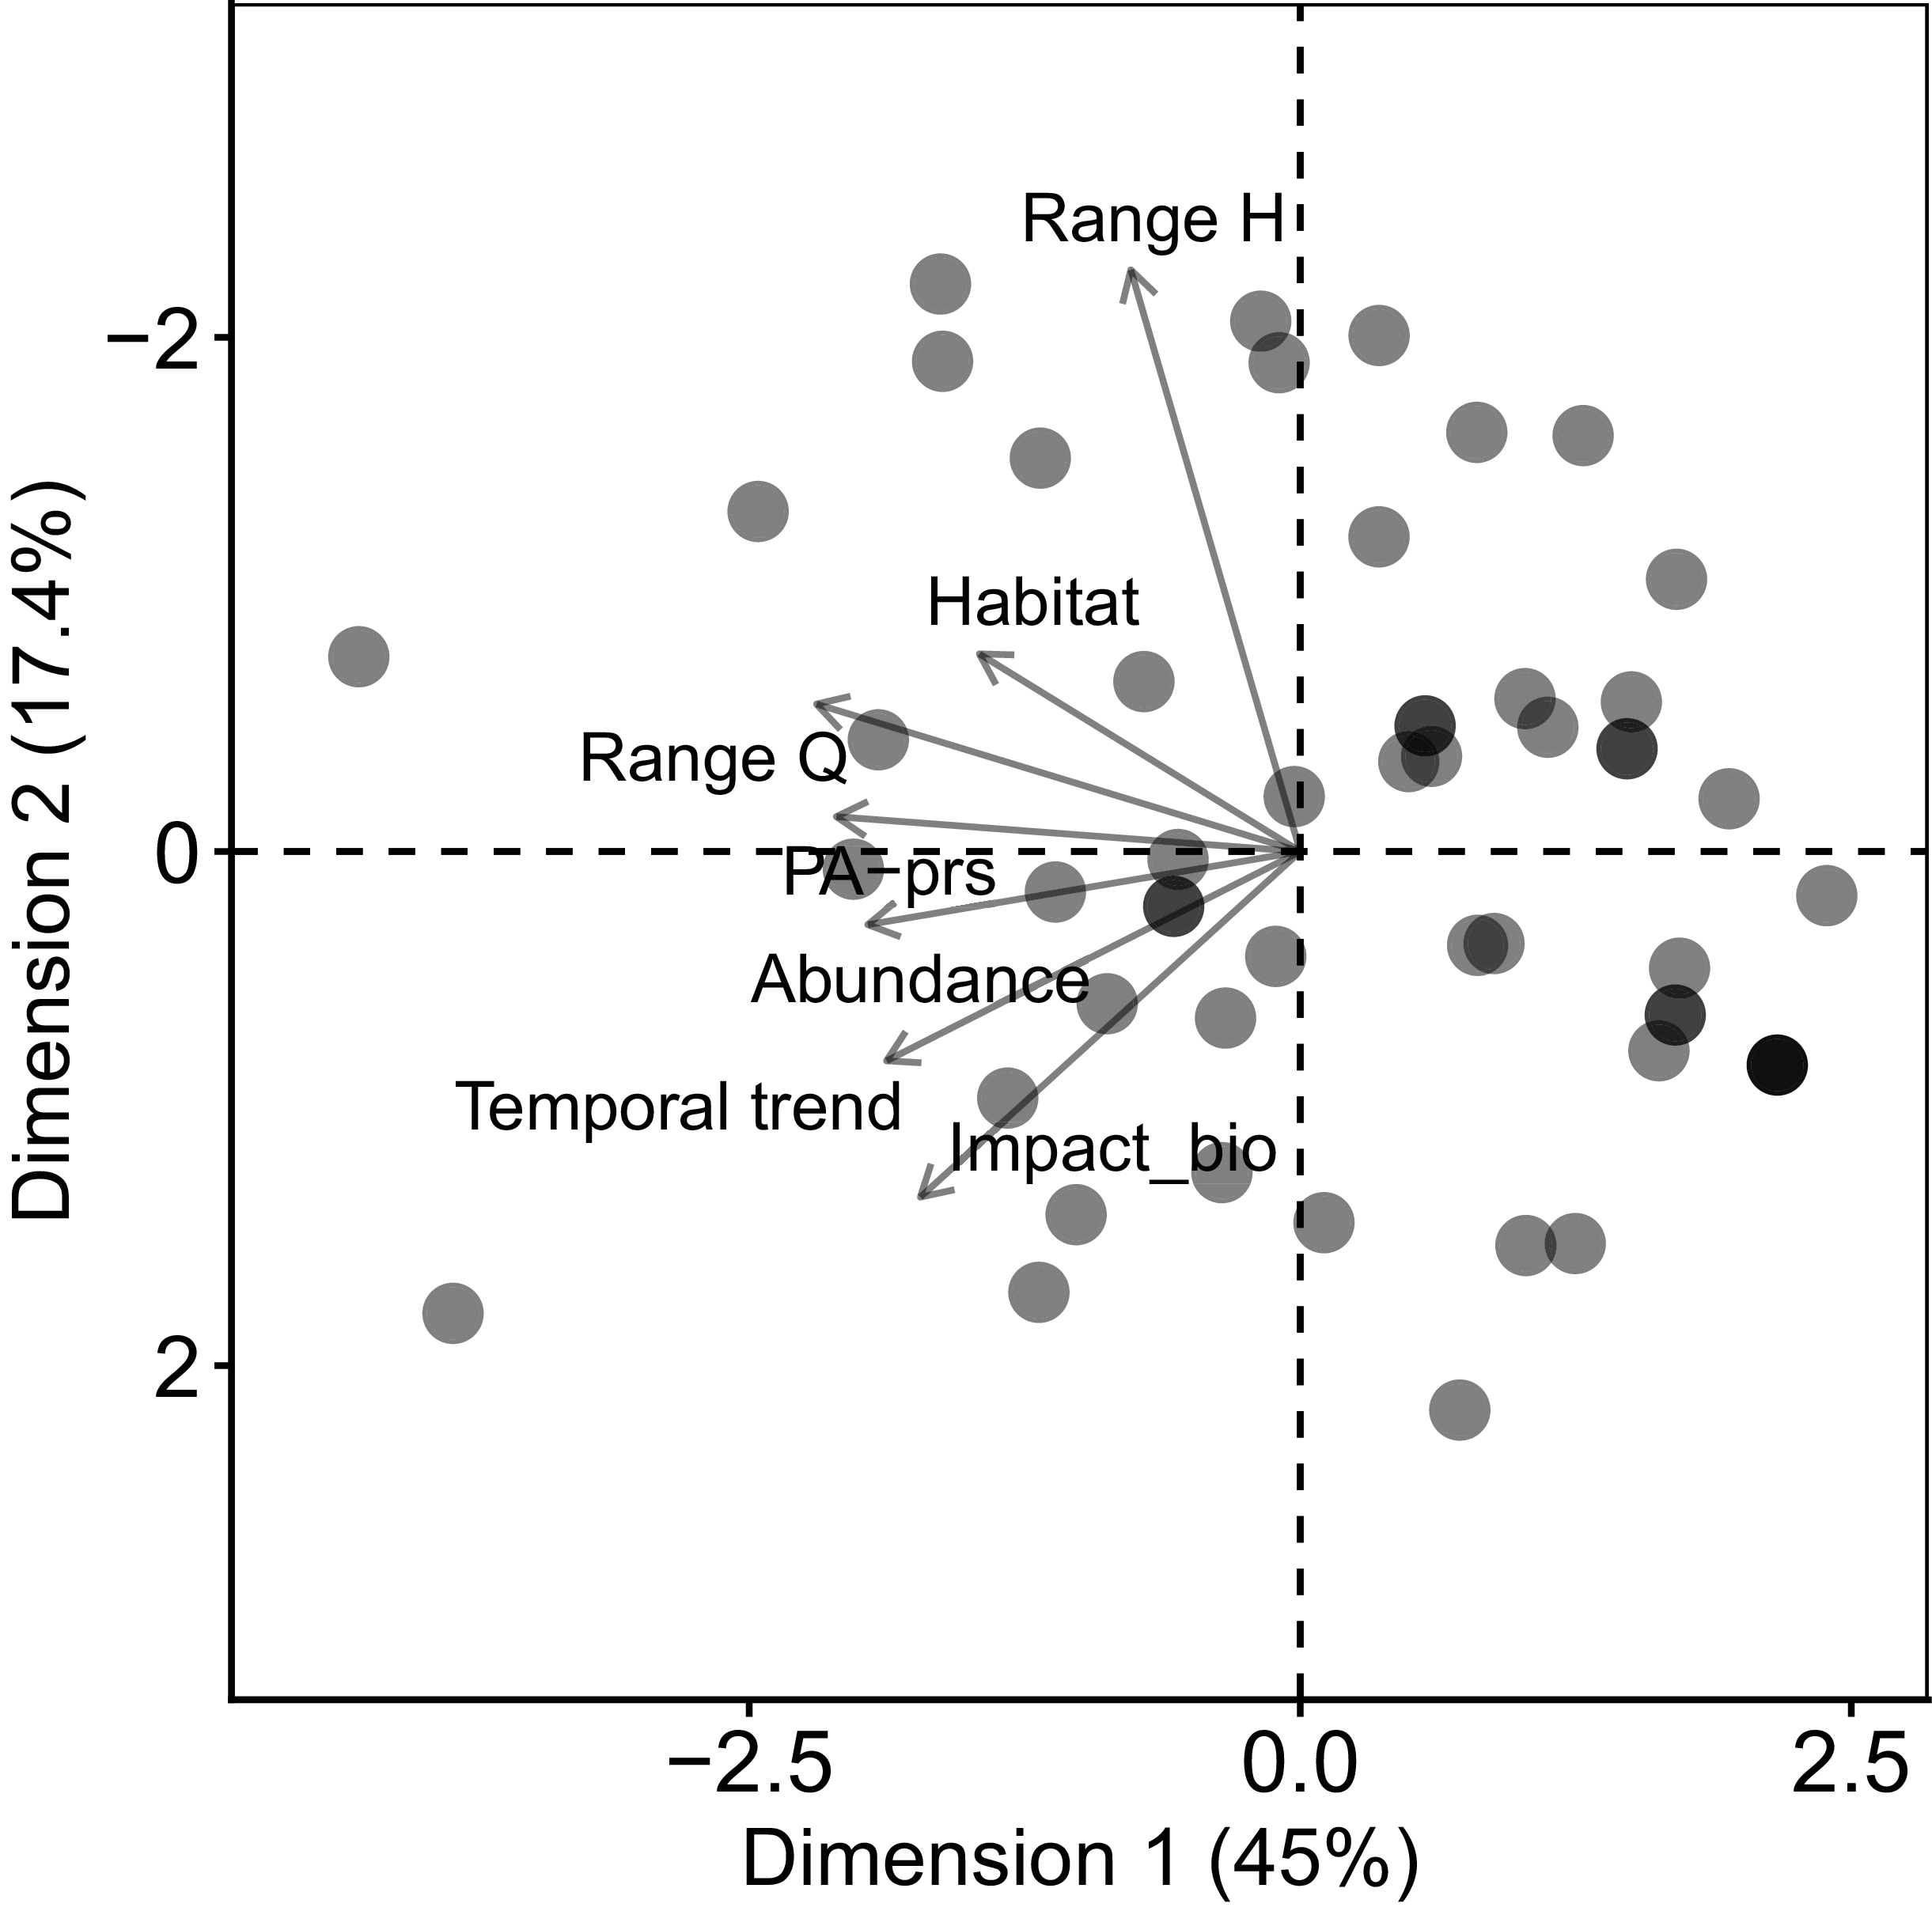
The first three principal component axes explained approximately 74% of the total variation across the different dimensions of invasiveness. This indicates coordination among these different dimensions and suggests that much of the multidimensional nature of invasiveness can be captured by a reduced number of axes. PC1 accounted for approximately 45% of the variation and was primarily associated with high loadings from range size (expert survey), presence in protected areas, and local abundance. PC2 explained 17% of the variation and was characterized by higher loadings for range size (herbarium-derived) and impact on biodiversity, while PC3 was dominated by habitat breadth obtained from the expert survey (Supplementary Figure S9). Overall, dimensions derived from the expert-based survey exhibited stronger loadings on PC1, except for impact on biodiversity, which loaded on PC2, and habitat breadth, which loaded most strongly on PC3. This indicated that ecological impacts vary among species and are only partially explained by distribution patterns. These results emphasize the need for management prioritization frameworks that integrate both spread potential and ecological impact, rather than assuming impacts scale directly with range size. The herbarium-derived dimension of range size showed higher loadings on PC2 (Figure 4; Supplementary Figure S10) and, interestingly, was only weakly correlated with range size from the expert-based survey (Supplementary Figure S11).
The major axes of variation in dimensions of invasiveness. Principal component analysis (PCA) biplot for the 55 species based on scores for different dimensions of invasiveness obtained from the herbarium- and expert-based approaches. Range H, range size herbaria; Range Q, range size questionnaire; Habitat, habitat breadth; PA-prs, presence in protected areas; Abundance, local abundance; Impact_bio, impact on biodiversity.
Identifying High-Priority Invasive Plants
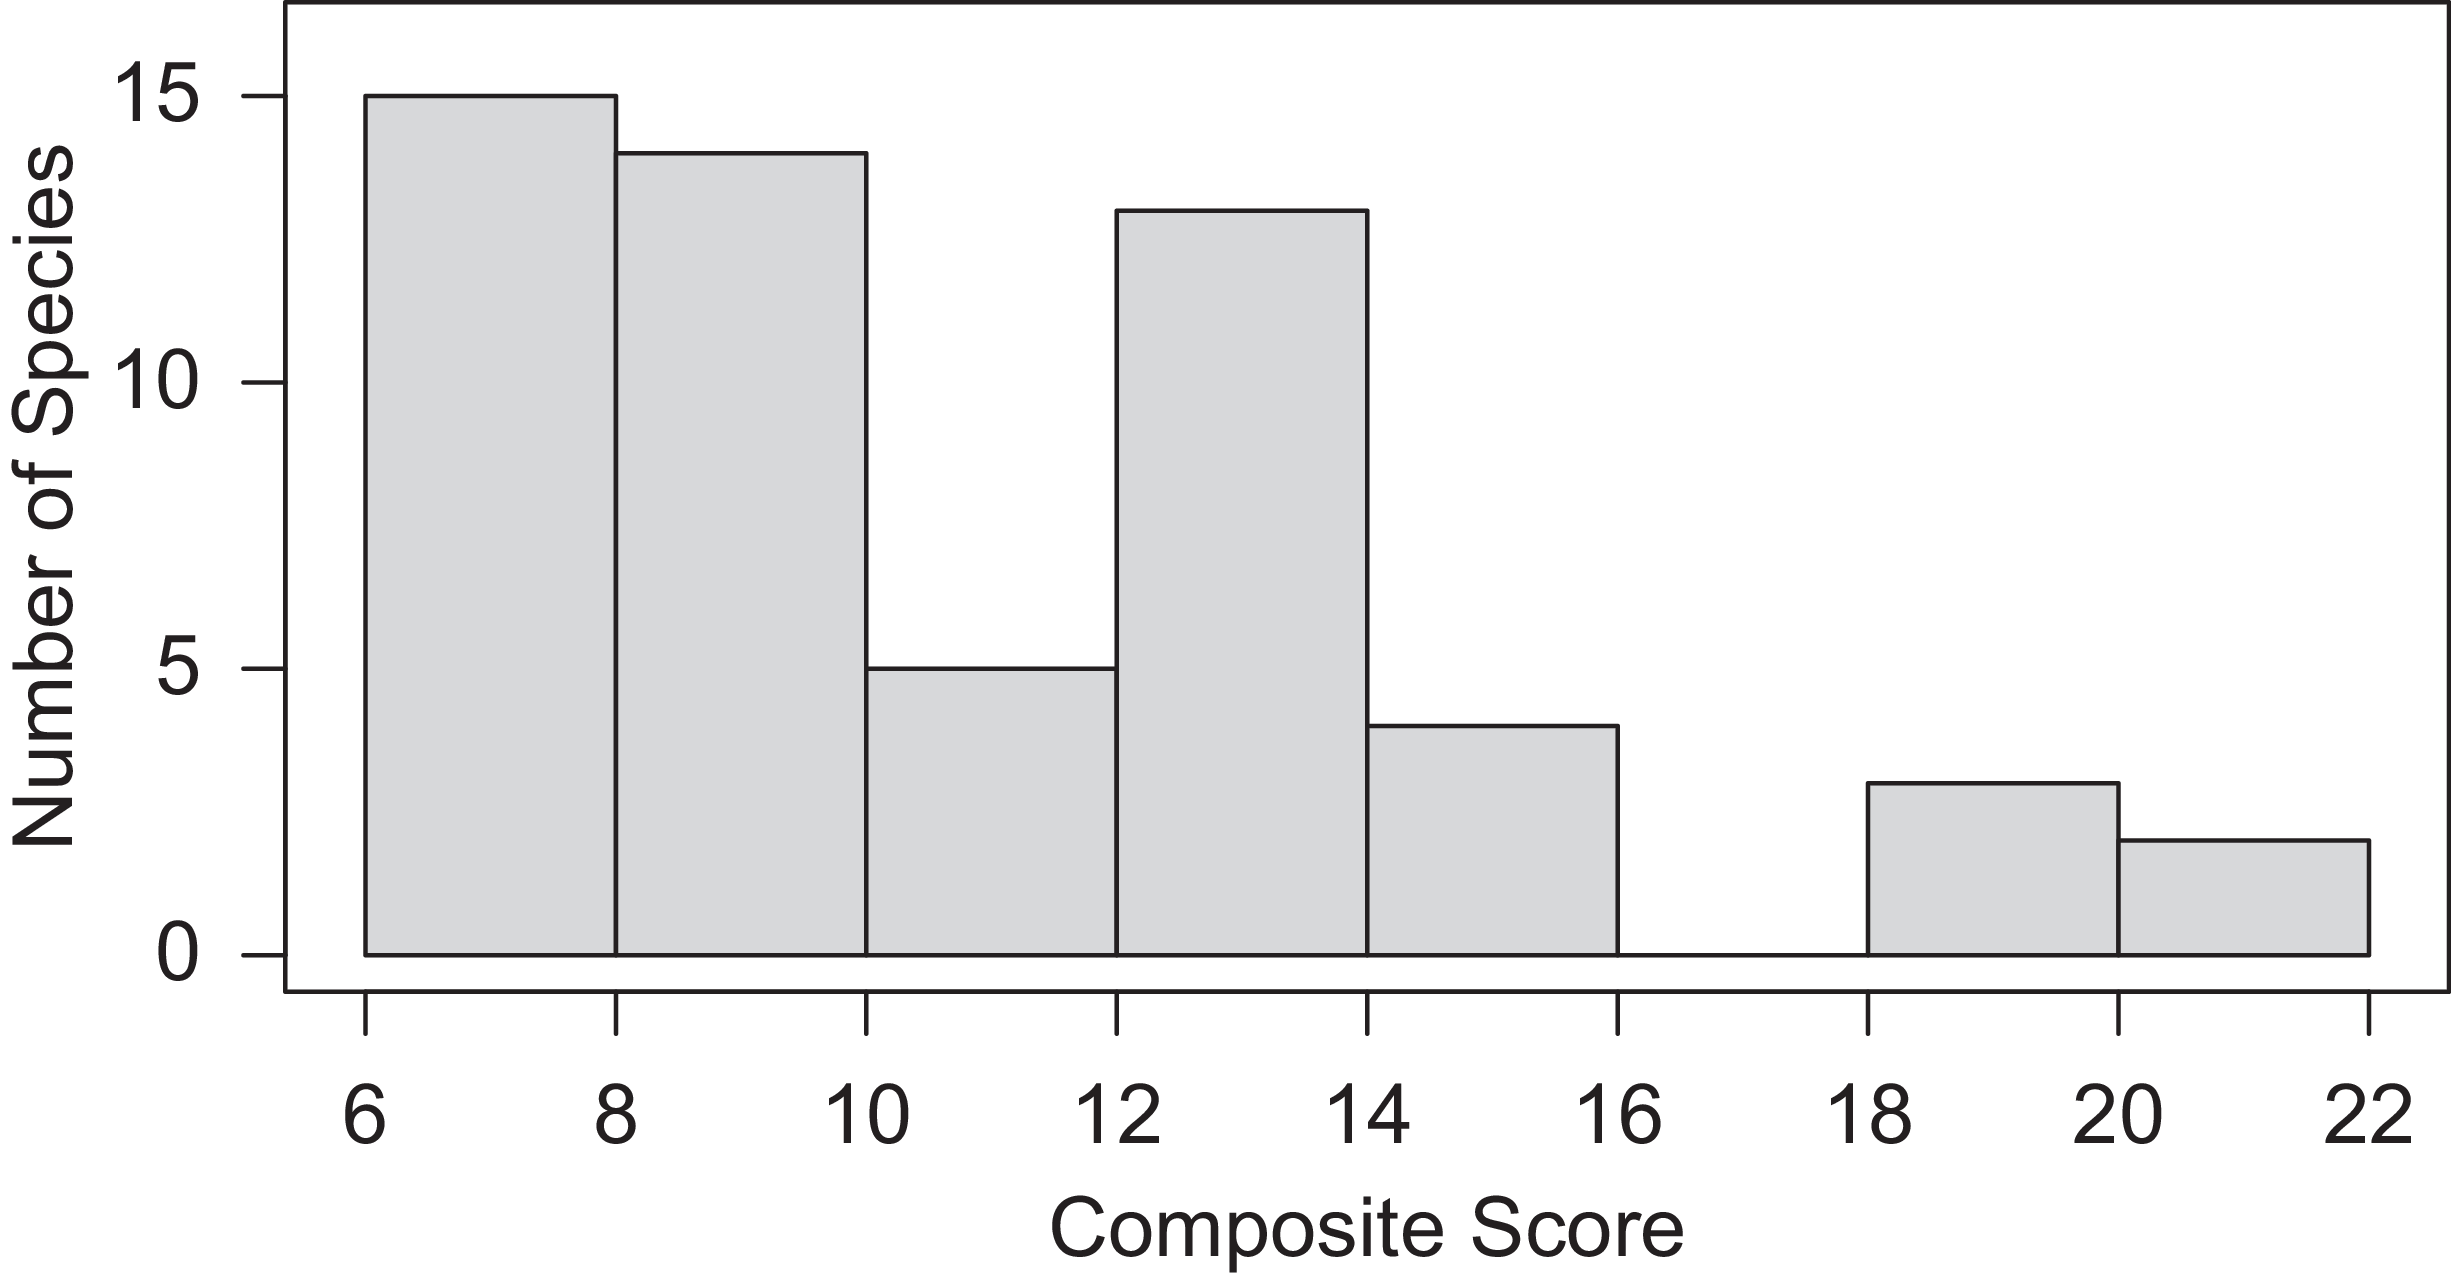
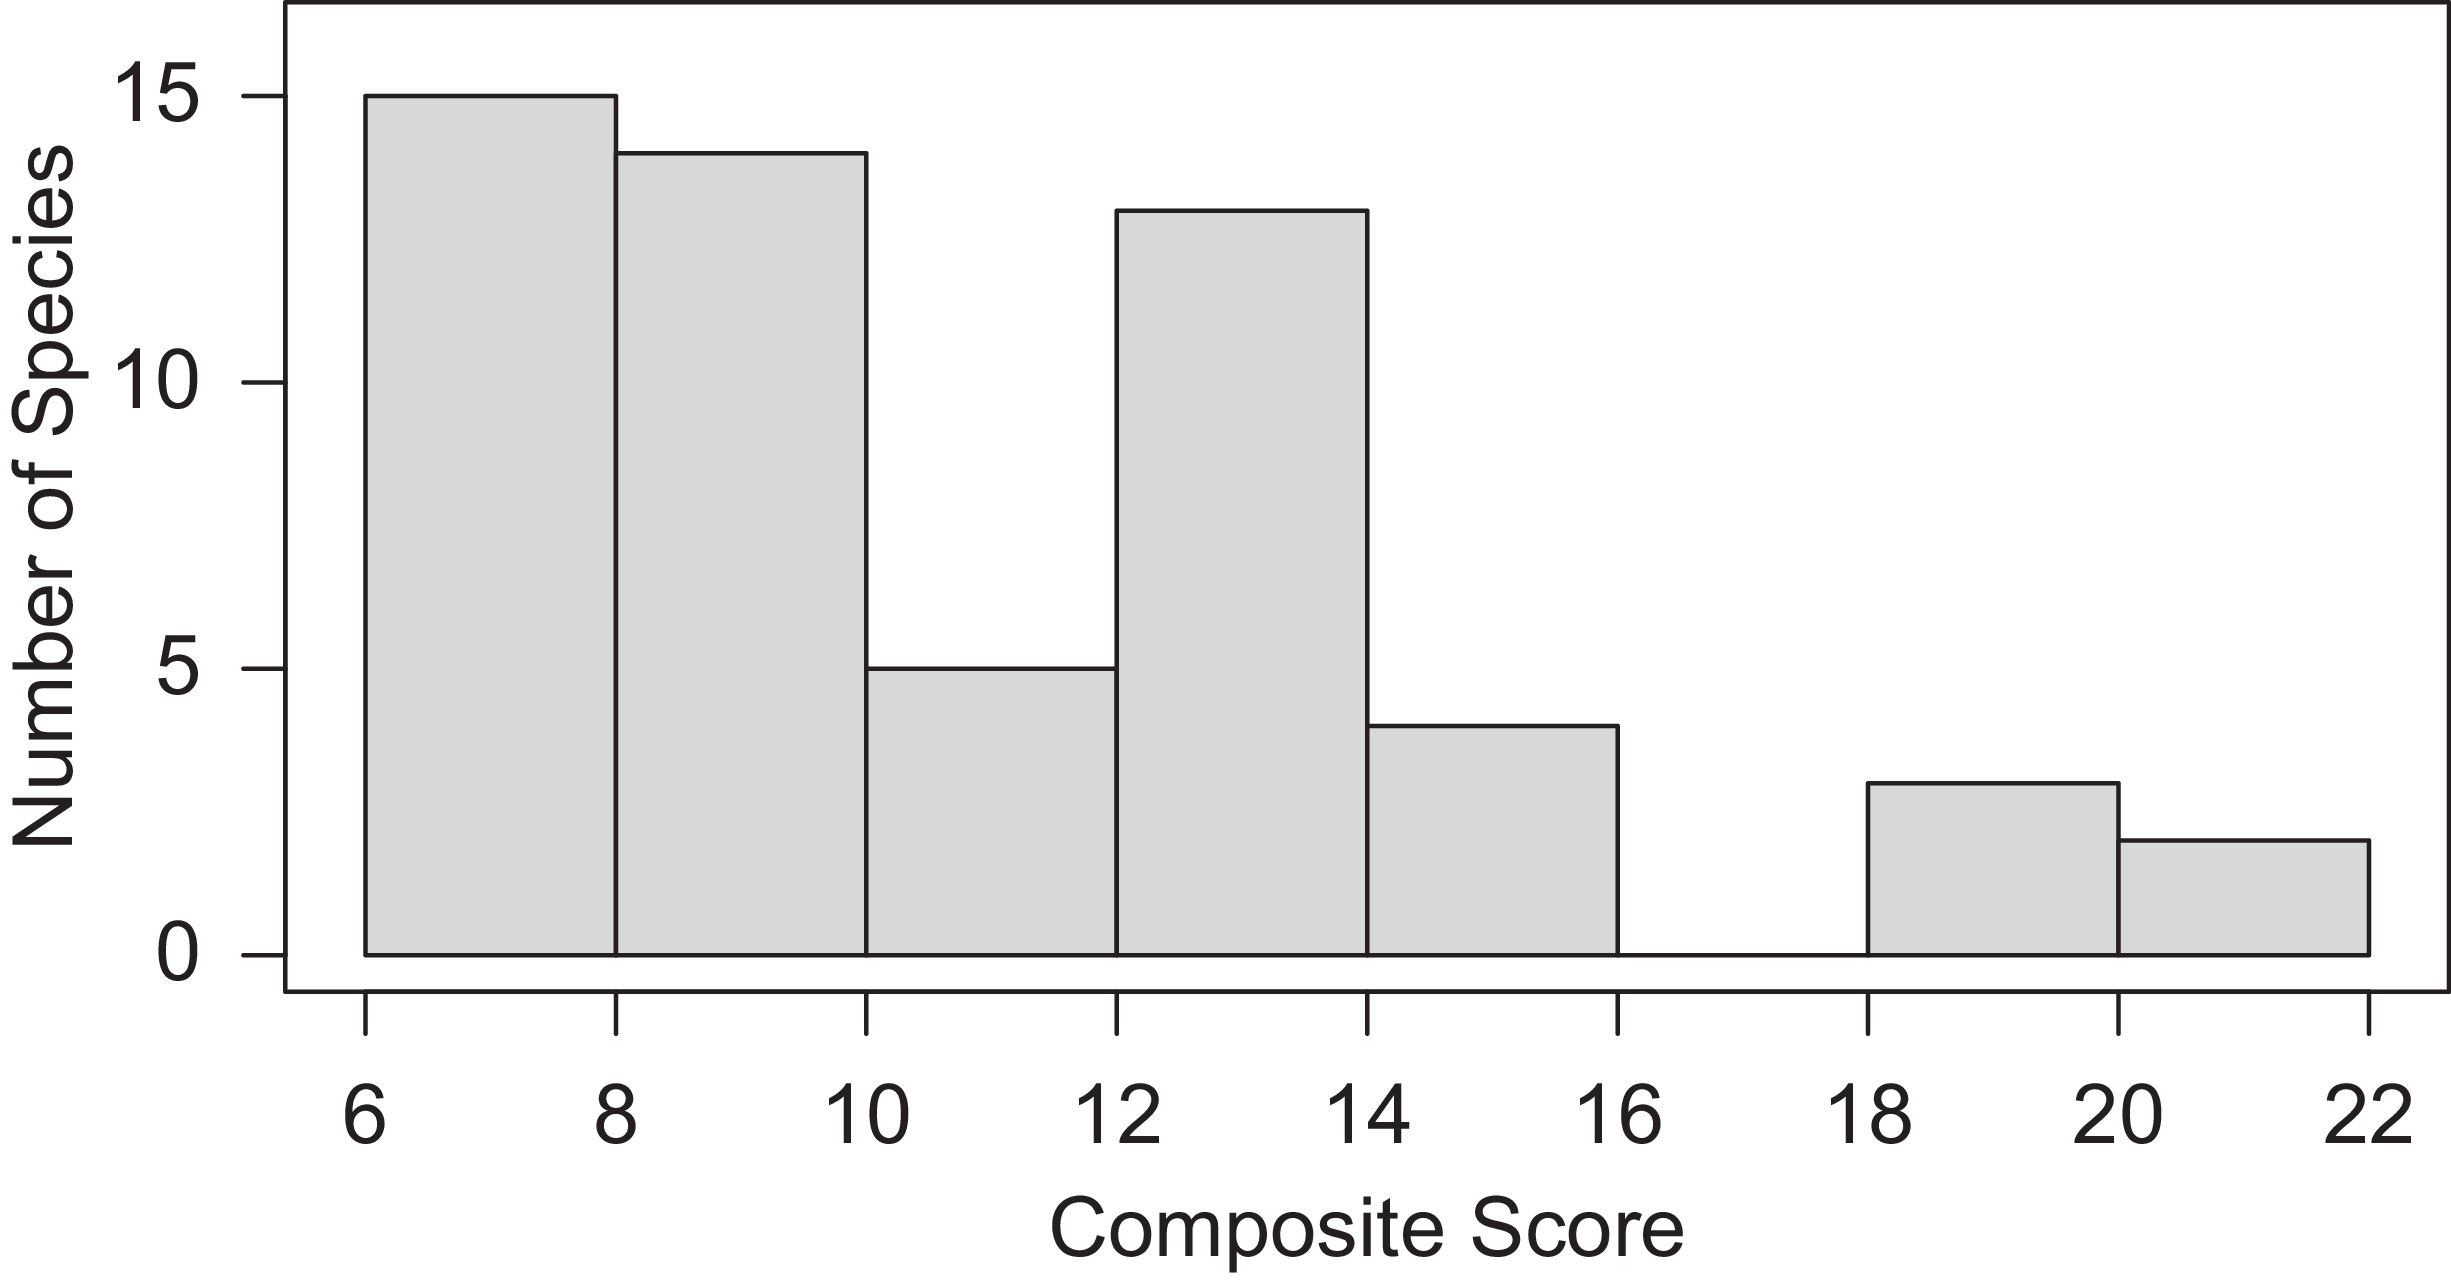
The cumulative scores obtained across all dimensions of invasiveness from expert responses were used to generate a ranked list of invasive plants of NWGK (ESM 2). Based on these scores, five species—C. odorata, M. suaveolens, C. sulphureus, [Alternanthera ficoidea (L.) P. Beauv.], and Lantana camara L.—had exceptionally high scores (Figure 5). Among the remaining species, 19 exhibited very low scores (<10), while 29 showed moderate scores (10–16). Of the five species with high impact scores, C. odorata and L. camara are also nationally prioritized (Mungi et al. Reference Mungi, Kaushik, Mohanty, Rastogi, Johnson and Qureshi2019; Sandilyan Reference Sandilyan2019), whereas C. sulphureus and A. ficoidea have received comparatively little attention, resulting in limited knowledge for effective control and management strategies. Given their high local priority, further work is needed to develop and evaluate appropriate control measures for these species.
Distribution of the final composite scores for the invasive species in the Northern Western Ghats and Konkan region (NWGK) based on expert evaluation across multiple dimensions of invasion.
Comparing Invasive Species at the Regional, National, and Global Scales
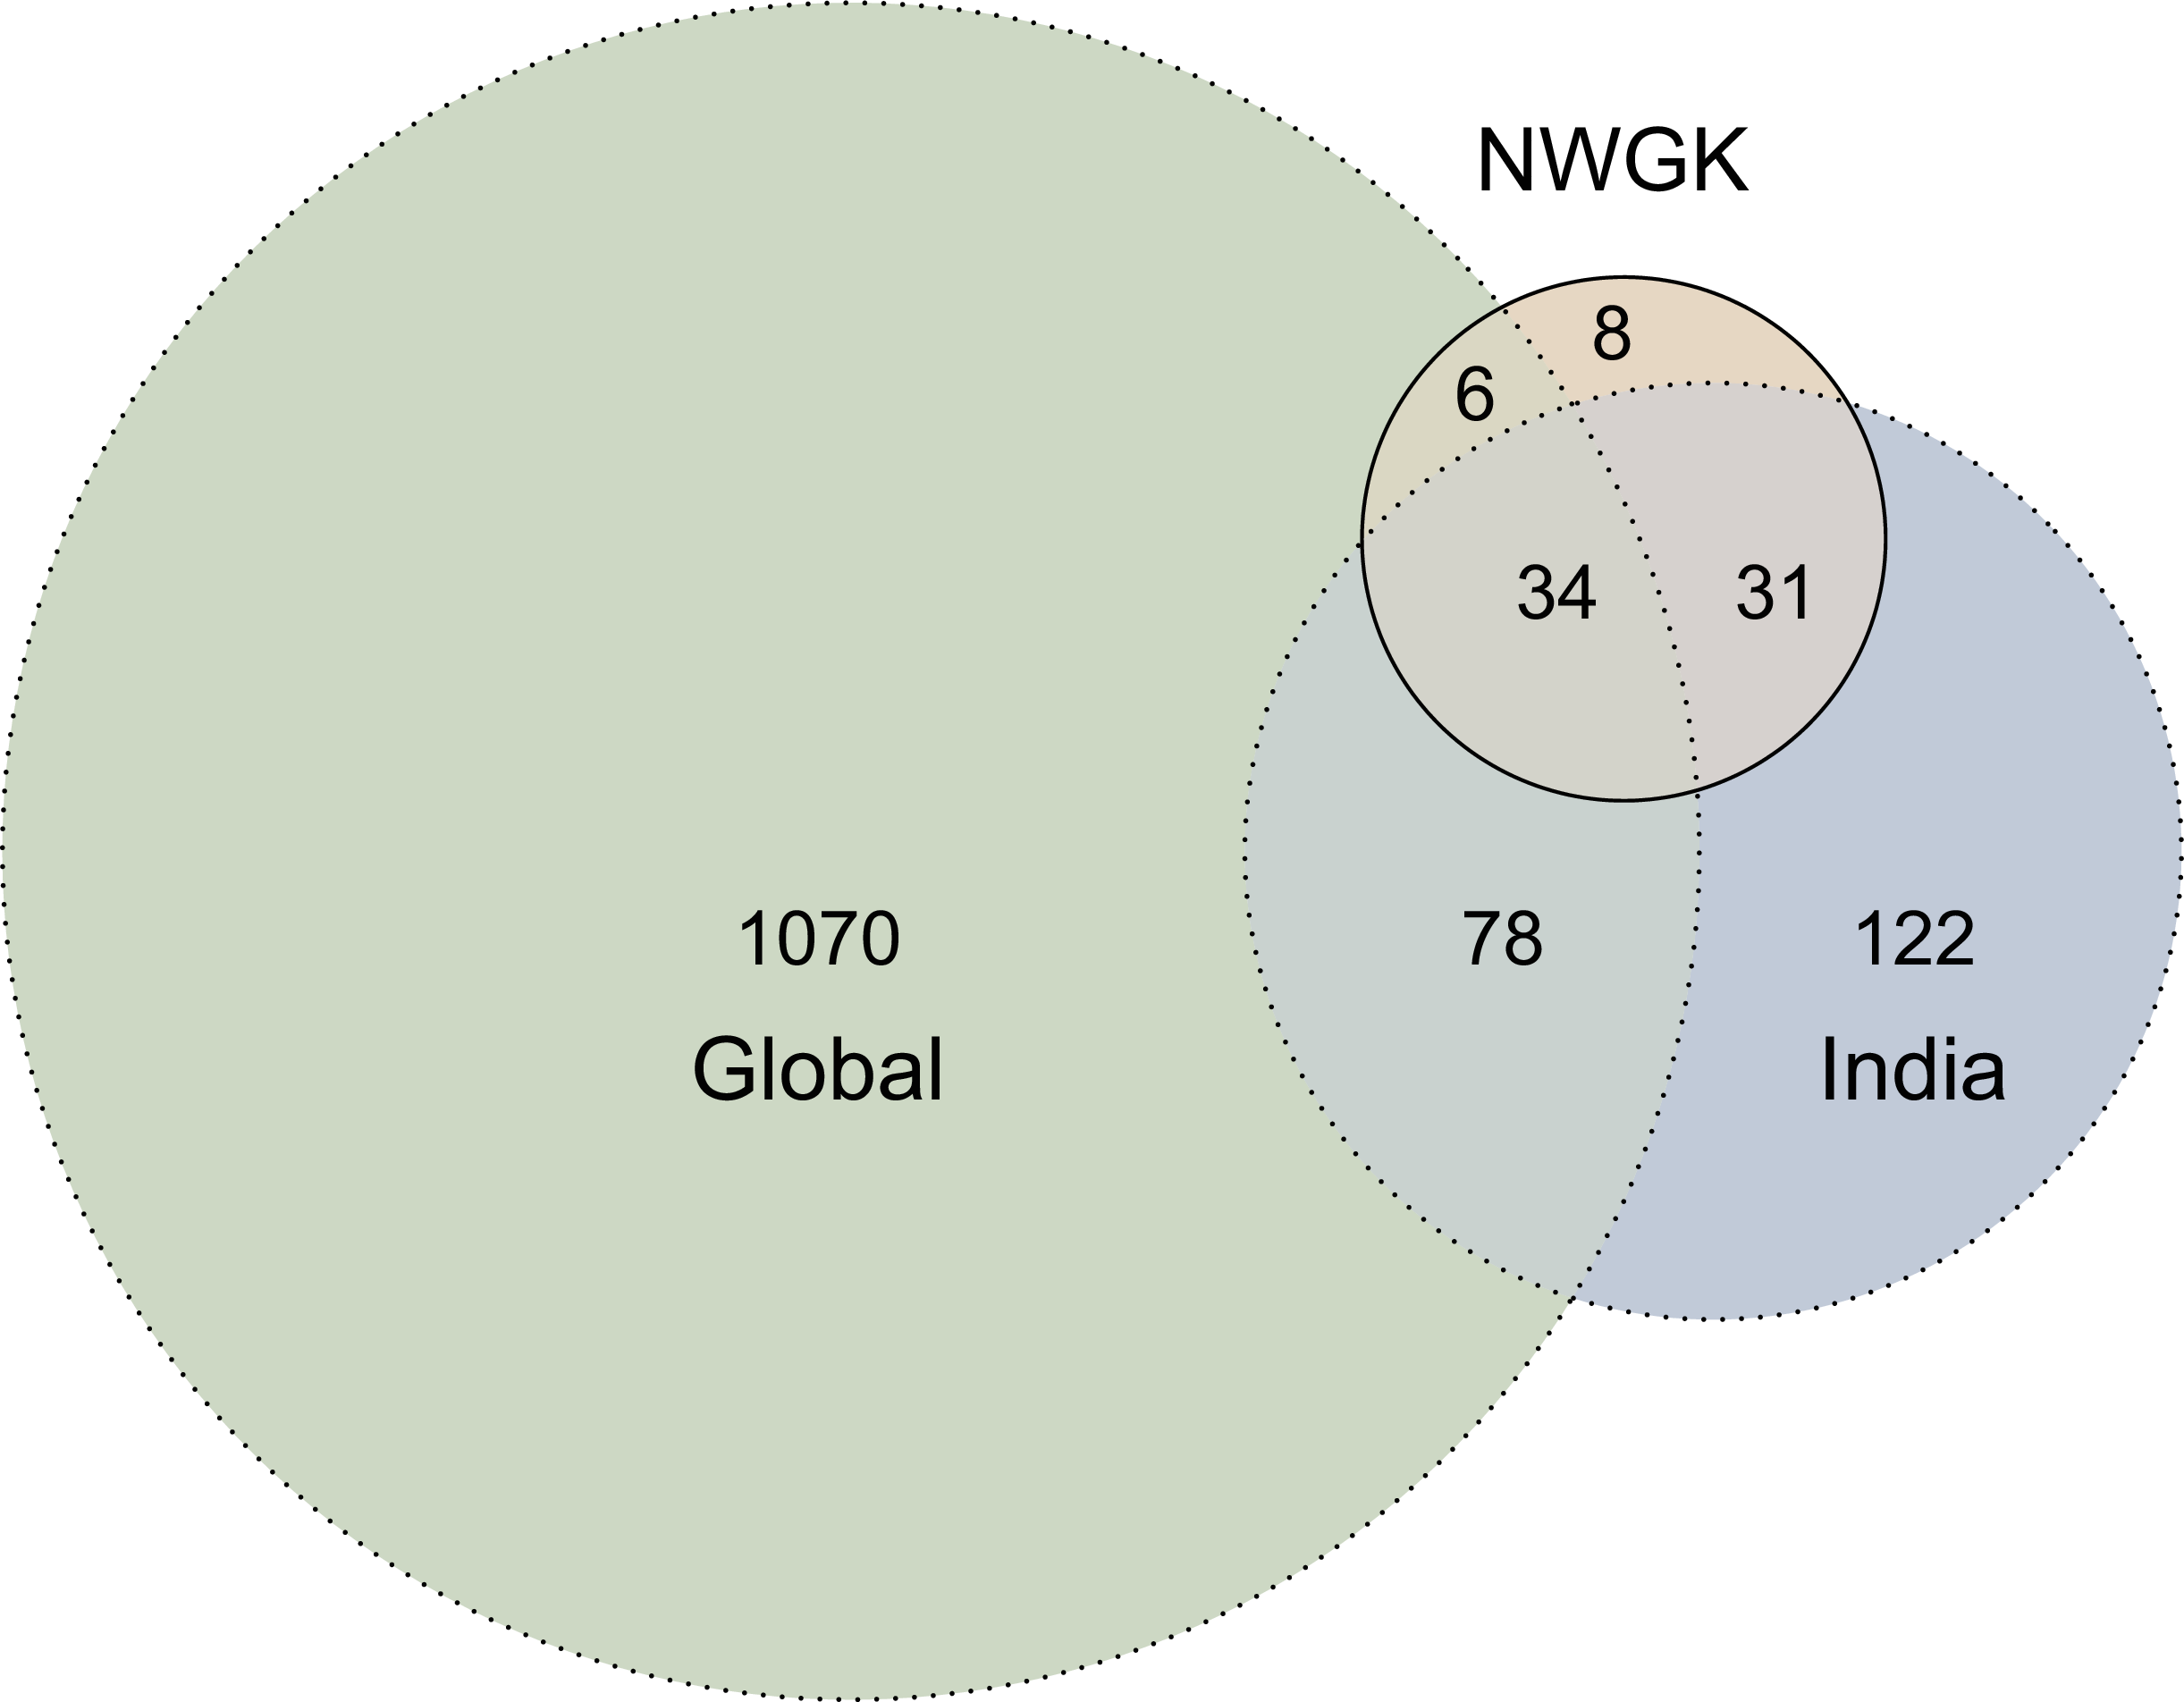
Comparison of the 79 regionally problematic invasive species with national and global invasive species revealed substantial differences (Figure 6). Eighty-two percent of the species identified as problematic in NWGK were also identified as invasive at the national level, whereas only 50% were classified as invasive at the global scale. Fourteen regionally problematic species were absent from the national database: six of these appeared in the global database, while eight were missing from both. Thirty-four species were identified as invasive at all the three scales, which represents approximately half of the problematic species in the NWGK list. In addition, 122 species listed as invasive in India were not invasive at the global (GIDIAS) or the regional (NWGK) scale. The lack of agreement in species presence across lists developed at different spatial scales and using different methods highlights the need for regional-scale assessments to guide management.
Euler diagram illustrating the overlap of species. Global, 1188 species (green); national (India), 265 species (blue); regional (Northern Western Ghats and Konkan [NWGK], this study), 79 species (peach).

For species recognized as invasive by more than one list (global, national, regional), we conducted a rank-correlation analysis to compare their ranks across lists. Surprisingly, no significant correlations in species rankings were detected across most pairwise comparisons, with the exception of the expert-derived regional list and the global list (r = 0.28, P < 0.05) (Supplementary Figure S12). Sample sizes in some of these pairwise comparisons were limited, and thus lack of relationships should be viewed cautiously. Nevertheless, these results indicate limited concordance in prioritization outcomes across the different lists and highlight the importance of spatial scale in invasion impact assessments. Global databases often assign high-impact rankings to species with large range sizes that occupy multiple ecosystems, even if their per capita or context-specific impacts are moderate (Nentwig et al. Reference Nentwig, Bacher, Kumschick, Pyšek and Vilà2018). In contrast, assessments conducted at smaller spatial scales with narrower environmental envelopes (Davies et al. Reference Davies, Chesson, Harrison, Inouye, Melbourne and Rice2005) may identify species with narrower range size but high local impacts.
Advantages and Limitations of Herbarium- and Expert-derived Data
We combined two complementary approaches, each with distinct advantages and limitations, to assess demographic and impact dimensions of invasive plants in the NWGK. Herbarium records provided quantitative estimates of range size, spread rates, and temporal dynamics, while expert assessments captured recent distributions, local abundance, and ecological impacts. While both approaches are commonly used, both have their inherent limitations. Herbarium data can be taxonomically, spatially, and temporally biased, and collection lags may obscure current distributions (Hyndman et al. Reference Hyndman, Mesgaran and Cousens2015). For example, collection effort is often biased toward species with medicinal, economic, or horticultural value, while common weedy species tend to be neglected. Our results showed that herbarium data overestimated species associated with human use or habitation (e.g., Eclipta prostrata (L.) L., Oxalis corniculata L.) and underestimated the range size for recent invaders (e.g., P. hysterophorus, Ipomoea carnea Jacq.). However, some of these biases can be controlled for, and herbarium collections represent a readily available quantitative data source that can be effectively used to provide insight into invasion dynamics and impact for a large number of species at large spatial and temporal scales.
Expert assessments can also be subject to observational and perception bias and limited by lack of empirical evidence. For instance, our assessment included only a single question addressing direct ecological impacts, because experts could not reliably evaluate more complex dimensions such as impacts on nutrient cycling or hydrology, likely due to the lack of sufficient empirical data. Additionally, data from expert assessments are typically qualitative, coarser in spatial resolution, and limited in temporal scale (White et al. Reference White, Jennings, Renwick and Barker2005). Expert assessments primarily reflect contemporary knowledge and are less suited to reconstructing long-term invasion dynamics. However, expert assessments are better suited for evaluating local abundance and ecological impacts that cannot be inferred from herbarium data. These contrasting advantages and limitations highlight the value of integrating multiple sources of evidence for invasive species prioritization. Herbarium data provide fine-scale estimates of range size and temporal trends, whereas expert assessments, though typically at coarser spatial scales, enable prioritization across additional dimensions beyond range size. Together, they provided a more comprehensive assessment of invasion dynamics and impacts in the NWGK region.
Conclusions
Species checklists provide an important foundation for invasion management by identifying taxa of concern. However, because such checklists typically include many species, it is rarely feasible to manage all of them concurrently. This makes species prioritization essential for effective and strategic management. Our results demonstrate that while national-level checklists offer reasonably comprehensive coverage, species impact rankings often differ at regional scales, highlighting the need for region-specific prioritization. High-impact but overlooked species should be targeted for management, while low-impact species of broader concern may require monitoring rather than intensive control. Emerging invaders should be identified and closely monitored through Early Detection and Rapid Response (EDRR) frameworks (Reaser et al. Reference Reaser, Burgiel, Kirkey, Brantley, Veatch and Burgos-Rodríguez2020). Finally, the transferable methodological framework presented in this study is not limited to NWGK but can support invasive species impact assessment and management planning across different regions.
Supplementary material
To view supplementary material for this article, please visit https://doi.org/10.1017/inp.2026.10055
Data availability
The datasets used and analyzed for the current study are available in the Supplementary Material (ESM_2.xlsx) submitted with the manuscript.
Acknowledgments
The authors thank the experts who generously contributed their time by completing the questionnaire. We thank the herbaria consulted: Botanical Survey of India, Pune; Agharkar Research Institute, Pune; Shivaji University, Kolhapur; and Blatter Herbarium, Mumbai. Special thanks to Rajendra Shinde and Praveen Kale at the Blatter Herbarium and Manoj Lekhak at Shivaji University for support and assistance.
Funding statement
Intramural funding from IISER, Pune for DB; University Grants Commission fellowship for MO.
Competing interests
The authors declare no conflicts of interest.


 Open access

