Introduction
Evolution of insecticide resistance is a global problem that provides some of the most compelling examples of adaptation by natural selection (Denholm & Rowland, Reference Denholm and Rowland1992; Onstad, Reference Onstad2007; Tabashnik et al., Reference Tabashnik, Gassmann, Crowder and Carrière2008). Although nearly all techniques for analyzing inheritance of insecticide resistance focus on diploid insects, haplodiploidy is a key factor influencing evolution of resistance and other traits in some important arthropod pests, including spider mites, thrips and whiteflies (Denholm et al., Reference Denholm, Cahill, Dennehy and Horowitz1998; Carrière, Reference Carrière2003; Crowder et al., Reference Crowder, Carrière, Tabashnik, Ellsworth and Dennehy2006). Here, we develop techniques for estimating the number of genes contributing to insecticide resistance in haplodiploid arthropods and apply them to the whitefly, Bemisia tabaci (Gennadius), one of the world's most adaptable and invasive agricultural pests (Byrne & Bellows, Reference Byrne and Bellows1991; Brown et al., Reference Brown, Frohlich and Rosell1995).
In haplodiploid species such as B. tabaci that reproduce by arrhenotoky, unmated females produce only haploid male offspring, and mated females produce haploid male and diploid female offspring (Bull, Reference Bull1983; Byrne & Devonshire, Reference Byrne and Devonshire1996; Heimpel & de Boer, Reference Heimpel and de Boer2008). The inheritance of insecticide resistance in arrhenotokous species can be estimated by analyzing the response of F2 male progeny of hybrid F1 females (e.g. Brown et al., Reference Brown, Cave and Hoy1991; Herron & Rophail, Reference Herron and Rophail1993; Horowitz et al., Reference Horowitz, Gorman, Ross and Denholm2003). This type of analysis can also be applied to haplodiploid species with males that develop from fertilized diploid eggs that lose their paternal chromosomes in development (Heimpel & de Boer, Reference Heimpel and de Boer2008).
B. tabaci is a species complex, with numerous biotypes that differ in biological and genetic characteristics (Brown et al., Reference Brown, Frohlich and Rosell1995; Perring, Reference Perring2001). The B and Q biotypes are considered the most harmful by virtue of polyphagy, propensity for resistance and global spread by human transport of infected plant material (Denholm et al., Reference Denholm, Cahill, Dennehy and Horowitz1998; Horowitz et al., Reference Horowitz, Kontsedalov, Khasdan and Ishaaya2005). Resistance to the insect growth regulator, pyriproxyfen, a selective insecticide effective against B. tabaci in many countries including the USA and Israel (Ishaaya & Horowitz, Reference Ishaaya and Horowitz1992; Horowitz & Ishaaya, Reference Horowitz, Ishaaya, Gerling and Mayer1996; Palumbo et al., Reference Palumbo, Horowitz and Prabhaker2001), has evolved in the B and Q biotypes (Horowitz et al., Reference Horowitz, Mendelson, Cahill, Denholm and Ishaaya1999, Reference Horowitz, Kontsedalov, Denholm and Ishaaya2002; Dennehy et al., Reference Dennehy, Degain, Harpold and Brink2004, Reference Dennehy, Degain, Harpold, Brown, Morin, Fabrick and Nichols2005).
Barriers to interbreeding have been found between biotypes of B. tabaci, including the B and Q biotypes (Costa et al., Reference Costa, Brown, Sivasupramaniam and Bird1993; De Barro & Hart, Reference De Barro and Hart2000; Rothamsted Research, unpublished data). Information on the genetics of resistance in these biotypes can therefore be used to explore parallels in their architecture and molecular basis and improve resistance management for this pest. Here, we incorporate data from laboratory bioassays and crossing experiments exploiting the unique attributes of haplodiploidy into statistical and analytical models to estimate the number of loci affecting pyriproxyfen resistance in strains of both biotypes.
Materials and methods
Strains
The susceptible strain (YUMA 04-S) of the B biotype was derived from a cotton field in Yuma, AZ in 2004 and has since been reared on cotton plants without exposure to insecticides. The resistant strain (QC-02) of the B biotype was derived from cotton fields in Queen Creek, AZ in 2002. Two selections with a pyriproxyfen concentration of 0.1 μg ml−1 resulted in a 1000-fold increase in resistance in this strain (Dennehy et al., Reference Dennehy, Degain, Harpold and Brink2004). Since April 2003, this strain has been reared on cotton plants sprayed with 1.0 μg ml−1 of pyriproxyfen.
The susceptible strain (ALM-1) of the Q biotype was collected from tomato fields near Almeria, Spain in 1994, and the resistant strain (Pyri-R) was collected in southwestern Israel from a rose greenhouse in 1992 (Horowitz et al., Reference Horowitz, Gorman, Ross and Denholm2003). Soon after it was collected, bioassays showed that Pyri-R was highly resistant to pyriproxyfen (>500-fold resistance). Since 1992, this strain has been reared on cotton plants sprayed with 20 μg ml−1 of pyriproxyfen.
Insect types
We tested susceptible males, resistant males and F2 male progeny of F1 females from reciprocal crosses between the strains. For the reciprocal crosses, groups of ten virgin females of one strain (susceptible or resistant) were placed with 15 males of the other strain in a 20-ml scintillation vial containing agar and a cotton leaf disk to mate for 48 h. F1 females resulting from these crosses were used in bioassays. The responses of F2 male progeny of F1 females were pooled, as maternal effects were not associated with pyriproxyfen resistance in either resistant strain tested (Horowitz et al., Reference Horowitz, Gorman, Ross and Denholm2003; Crowder et al., Reference Crowder, Ellers-Kirk, Yafuso, Dennehy, Degain, Harpold, Tabashnik and Carrière2008).
Bioassays
For B biotype strains, excised cotton seedlings with one true leaf were dipped for 20 s in 0–320 μg ml−1 of formulated pyriproxyfen (Knack™ 0.86 EC; Valent USA). Ten three-day-old virgin females (susceptible, resistant, or F1) were aspirated into Petri dishes, with stems held in water (Crowder et al., Reference Crowder, Ellers-Kirk, Yafuso, Dennehy, Degain, Harpold, Tabashnik and Carrière2008). The virginity of adult females was assured by sexing and isolating females as nymphs (Horowitz et al., Reference Horowitz, Gorman, Ross and Denholm2003). Seedlings with adults were held in growth chambers (27°C, 50% RH, 16:8 h light:dark) for 48 h, after which adults were removed, eggs were counted and seedlings were placed in 20-ml scintillation vials containing tap water. To assess mortality, live nymphs were counted seven days after oviposition. This bioassay was conducted from March to April 2007. For each insect type, 4–8 replicates were performed with each concentration.
The bioassay methods for Q biotype strains (conducted in 1999 and 2000) were similar to those for the B biotype with the following modifications: (i) bioassays were conducted in clip-cages on whole cotton plants at the 3–4 node stages; (ii) adults laid eggs on untreated leaves for 48 h, after which eggs were counted and leaves were dipped for ten seconds in 0–100 μg ml−1 of formulated pyriproxyfen; and (iii) egg hatch was checked after ten days. The response of F2 male progeny of virgin F1 females was tested the same as for the B biotype. However, for the Q biotype, the response of susceptible and resistant male progeny from virgin females were not tested as in the B biotype, only the response of susceptible and resistant strains (pooled males and females) was measured. Thus, for all subsequent analyses, statistical models for the Q biotype were based on the response of the susceptible and resistant strains.
Data analysis
Mortality observed at each pyriproxyfen concentration was corrected for control mortality (Abbott, Reference Abbott1925). Probit analysis (PROC PROBIT: SAS Institute, 2002) was used to estimate slopes of the concentration-mortality lines and their standard errors, as well as the LC50 values and their 95% fiducial limits. LC50 values were considered significantly different if their 95% fiducial limits did not overlap. Resistance ratios of each insect type were calculated as their LC50 divided by the LC50 of the susceptible strain of the same biotype.
Tests of monogenic and polygenic models
We modified models for a diploid species (Tabashnik, Reference Tabashnik1991; Tabashnik et al., Reference Tabashnik, Schwartz, Finson and Johnson1992) to estimate the number of loci affecting resistance in a haplodiploid pest based on the response of F2 males. In models with one, two, five or ten loci affecting resistance, we assumed that each locus had one allele for susceptibility (S) and one for resistance (R). Models calculated expected mortality of F2 males at each concentration tested. In the one-locus model, the genotype of F1 females was SR and 50% of F2 males were S and 50% were R. The expected mortality of F2 males at concentration x=(50%×mortality of S at x+50%×mortality of R at x). The LC50 and slopes for susceptible (S) or resistant (R) males were based on the bioassay data.
In the two-locus model, the F2 male progeny of F1 females (genotype S1R1S2R2) were 25% S1S2, 25% S1R2, 25% R1S2 and 25% R1R2. In this model, the LC50 and slope for S1S2 and R1R2 were those measured in susceptible and resistant males, respectively. The log(LC50) and slope for S1R2 and R1S2 was the mean of the log(LC50) and slope in susceptible and resistant males (Tabashnik, Reference Tabashnik1991). In the five- and ten-locus models, the genotype frequency of F2 males was based on the binomial distribution. In these cases, the LC50 and slope of the most susceptible and resistant genotypes (homozygous at all loci) was the LC50 and slope for susceptible and resistant males. The log(LC50) and slope for intermediate genotypes were additive between the log(LC50) and slopes in susceptible and resistant males (Tabashnik, Reference Tabashnik1991; Tabashnik et al., Reference Tabashnik, Schwartz, Finson and Johnson1992). For example, the log(LC50) for genotype S1S2S3R4R5=(3×log[LC50][susceptible male]+2×log[LC50][resistant male])/5 and the slope=(3×slope[susceptible male]+2×slope[resistant male])/5. For all genotypes, expected mortality at each concentration was estimated based on the LC50 and slope for that genotype.
Modeling was done in SAS (SAS Institute, 2002). For models of five and ten loci, the effects of loci were equal and additive on a logarithmic scale (Tabashnik et al., Reference Tabashnik, Schwartz, Finson and Johnson1992). For two loci, we tested effects of loci equal and additive (as above), plus four additive models with unequal effects of each locus (major and minor locus) and four models with epistasis (nonadditive interactions between loci) (Tabashnik et al., Reference Tabashnik, Schwartz, Finson and Johnson1992). In the models with epistasis, the phenotypes of S1R2 and R1S2 varied among models.
We used 2×2 contingency tables to test for significant deviation between observed and expected mortality at each concentration (Sokal & Rohlf, Reference Sokal and Rohlf1995). In addition, we calculated the average absolute difference between observed and expected mortality as the mean difference between observed and expected mortality (absolute values) across all concentrations. We used multiple regression to determine the effects of the modeled number of loci and concentration (log transformed) on the average absolute difference between observed and expected mortality (log transformed). As empirical estimates of LC50 and slopes have inherent uncertainty, we also performed a sensitivity analysis by varying the slope and resistance ratios in models. Unlike the methods above, in these tests we assumed that the slope for all genotypes were equal.
Effective number of loci affecting resistance
We used Lande's (Reference Lande1981) method, adapted for haplodiploid species (Jones, Reference Jones2001), to estimate the minimum number of loci (n E) involved in resistance in both biotypes as follows:

where  and
 are the log(LC50) for resistant and susceptible strains, respectively. The actual number of genes is n. The extra genetic variance segregating in F2 males beyond that in F1 females, σs2, was estimated as:

where σs2,  ,
 ,
 and
 were, respectively, the phenotypic variances of F2 males, F1 females, the susceptible strain and the resistant strain. Each variance was estimated as the inverse of the squared slope (Tabashnik et al., Reference Tabashnik, Schwartz, Finson and Johnson1992). For the B biotype, the LC50 and slopes for parental strains were based on empirical data for males, as Crowder et al. (Reference Crowder, Ellers-Kirk, Yafuso, Dennehy, Degain, Harpold, Tabashnik and Carrière2008) observed no differences between males and females of either the QC-02 or Yuma 04-S strains. The variance for F1 females was measured in assays for the B (Crowder et al., Reference Crowder, Ellers-Kirk, Yafuso, Dennehy, Degain, Harpold, Tabashnik and Carrière2008) and Q biotypes (Horowitz et al., Reference Horowitz, Gorman, Ross and Denholm2003).
Results
Resistance levels
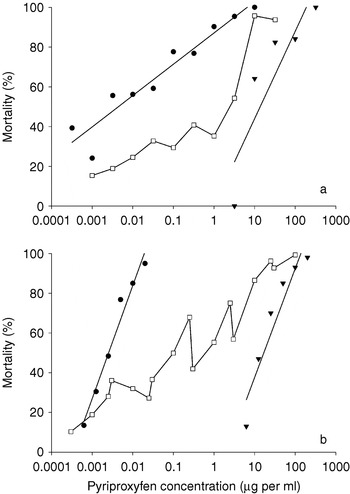
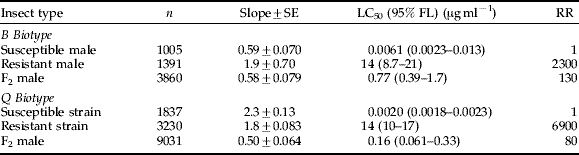
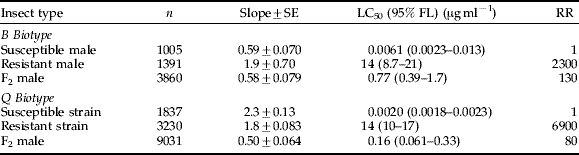
Relative to their susceptible counterparts, males of the resistant QC-02 strain (B biotype) were highly resistant to pyriproxyfen, as were individuals of the resistant Pyri-R strain (Q biotype) (table 1, fig. 1). The LC50 values for F2 males were intermediate between the susceptible and resistant individuals for both biotypes (table 1, fig. 1).
Mortality caused by pyriproxyfen for the (a) B biotype and (b) Q biotypes. For the B biotype (a), responses shown are for males only. For the Q biotype (b), responses shown are for the susceptible and resistant strains (males and females combined) and F2 males (–•–, susceptible; –▾–, resistant; –□–, F2).

Responses to pyriproxyfen for the B and Q biotypes of B. tabaci.
Indirect tests of monogenic and polygenic models
B biotype
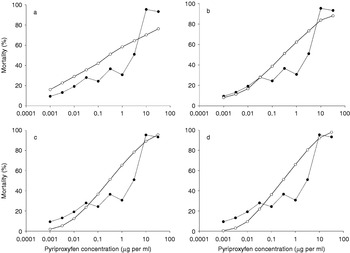
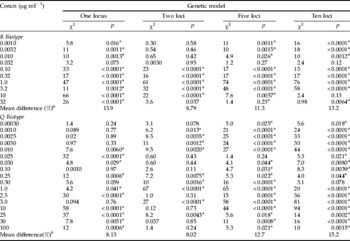
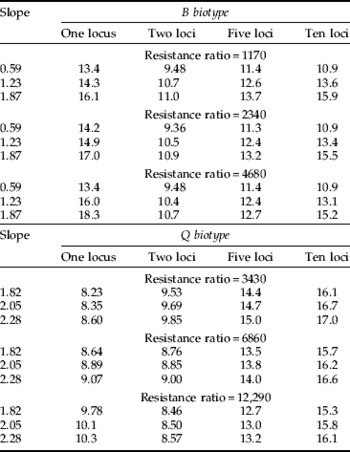
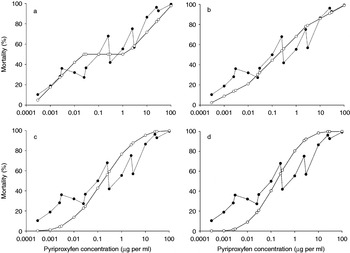
The average absolute difference between observed and expected mortality was lowest for the two-locus model (8.79%) and highest for the one-locus model (13.9%) (table 2, fig. 2). After accounting for concentration (t 35=1.99, P=0.054), the two-locus model had a significantly better fit to the observed data than the one-locus model (t 35=2.30, P=0.028) and was marginally better than the five- (t 35=1.41, P=0.16) and ten-locus models (t 35=1.68, P=0.10). The ranking of models was consistent in tests with various values for slope and resistance ratio (table 3). For the ten concentrations tested, significant deviation of observed versus expected mortality occurred at five concentrations for the two-locus model, nine concentrations for the one-locus model, and eight concentrations for the five- and ten-locus models (table 2).
Observed vs. expected mortality at each of ten pyriproxyfen concentrations tested for F2 males of the B biotype of B. tabaci ((a) –•–, observed; –○–, one locus; (b) –•–, observed; –○–, two loci; (c) –•–, observed; –○–, five loci; (d) –•–, observed; –○–, ten loci).

Tests for deviation between observed and expected mortality (df=1) for F2 males of the B and Q biotypes of B. tabaci with monogenic and additive polygenic models.

a Probability values indicating significant differences between the observed and expected mortality (P<0.05).
b Mean difference was calculated as the mean of the difference between observed and expected mortality (absolute values) across all concentrations tested.
Effects of number of loci, slope and resistance ratio on the absolute value of the mean difference (%) between observed and expected mortality across ten pyriproxyfen concentrations for F2 males of the B biotype of B. tabaci.

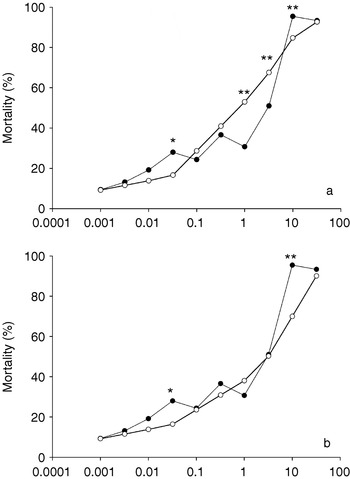
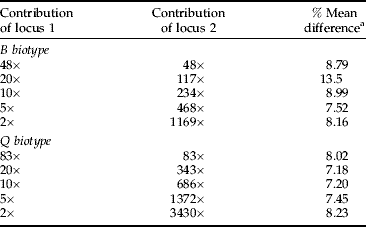
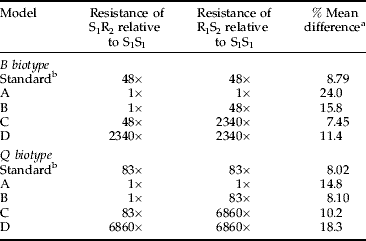
For two-locus models, the fit to the observed data improved in two of the additive models with unequal effects of loci (table 4). The best fit was obtained with a major locus conferring 468-fold resistance and a minor locus conferring fivefold resistance (fig. 3). The average absolute difference between observed and expected mortality with this model was 7.52%, compared to 8.79% in a model with equal effects of two loci. One of the four models with epistasis was a better fit to the observed data than the additive and equal two-locus model (table 5). In this model (model C), the absolute difference between observed and expected mortality was 7.45% (fig. 3). For the ten concentrations tested, significant deviation of observed versus expected mortality occurred at four concentrations for the model with a major locus conferring 468-fold resistance and a minor locus conferring fivefold resistance and two concentrations with model C, indicating that both models fit the observed data at more concentrations than the model with equal effects of two loci (fig. 3).
Observed vs. expected mortality for F2 males of the B biotype with (a) a model with a major locus conferring 468-fold resistance and a minor locus conferring five-fold resistance and (b) epistasis model C (resistance additive at one locus and dominant at a second locus). 2×2 contingency table analyses were used to test for significant deviation between observed and expected mortality at each concentration (*: P<0.05; **: P<0.001) (–•–, observed; –○–, expected).

Fit between observed and expected mortality for additive two-locus models with various relative contributions of each locus.
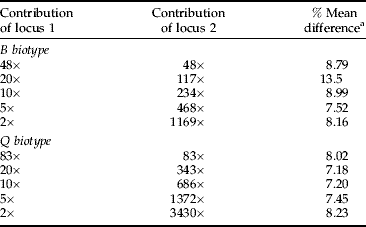
a Mean absolute difference between observed and expected mortality across all concentrations.
Fit between observed and expected mortality for two-locus models with epistasis.
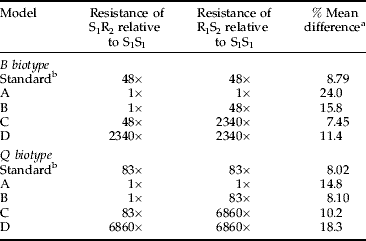
a Mean absolute difference between observed and expected mortality across all concentrations.
b Standard represents case where both loci contribute equally to resistance (no epistasis).
Q biotype
The average absolute difference between observed and expected mortality was lowest for models of one (8.13%) and two loci (8.02%) and highest for models of five (12.7%) and ten loci (15.2%) (table 2, fig. 4). After accounting for concentration (t 63=−2.84, P=0.0061), the one-locus model provided a significantly better fit to the observed data than the five (t 63=1.86, P=0.067) and ten-locus models (t 63=2.38, P=0.021) but was not different from the two-locus model (t 63=0.25, P=0.80). The ranking of models was consistent in tests with various values for slope and resistance ratio (table 3). For the 17 concentrations tested, significant deviation of observed versus expected mortality occurred at ten and nine concentrations for the one- and two-locus models, respectively, and 16 concentrations for the five- and ten-locus models (table 2).
Observed vs. expected mortality at each of 17 pyriproxyfen concentrations tested for F2 males of the Q biotype of B. tabaci ((a) –•–, observed; –○–, one locus; (b) –•–, observed; –○–, two loci; (c) –•–, observed; –○–, five loci; (d) –•–, observed; –○–, ten loci).

For two-locus models, the fit to the observed data improved in three of the additive models with unequal effects of loci (table 4). The best fit occurred with a major locus conferring 343-fold resistance and a minor locus conferring 20-fold resistance. The average absolute difference between observed and expected mortality with this model was 7.18%, compared to 8.02% in a model with equal effects of two loci. None of the models with epistasis provided a better fit to the observed data than the additive and equal two-locus model (table 5).
Effective number of loci affecting resistance
The LC50 and slope (±SE) of the probit lines for F2 males, susceptible and resistant individuals for the B and Q biotypes are shown in table 1. The slope of F1 females was 1.2±0.29 for the B biotype (Crowder et al., Reference Crowder, Ellers-Kirk, Yafuso, Dennehy, Degain, Harpold, Tabashnik and Carrière2008) and 1.5±0.11 for the Q biotype (Horowitz et al., Reference Horowitz, Gorman, Ross and Denholm2003). Based on these data, the estimated minimum number of loci affecting resistance was 1.6 in the B biotype and 1.0 in the Q biotype, consistent with model results.
Discussion
Our approach represents a new method to examine the inheritance of insecticide resistance in a haplodiploid arthropod. In haplodiploid species, if resistance is controlled by two alleles at a single locus (S for susceptibility and R for resistance), the F2 male progeny of virgin F1 females (genotype SR) are expected to be 50% S and 50% R. Analyzing the response of F2 males from virgin F1 females eliminates the need for backcrosses or crosses between F1 males and females to examine the mode of inheritance.
In diploid species, backcrosses are used to examine the mode of inheritance of a trait (e.g. Tabashnik, Reference Tabashnik1991; Tabashnik et al., Reference Tabashnik, Schwartz, Finson and Johnson1992; Alves et al., Reference Alves, Spencer, Tabashnik and Siegfried2006). Backcrosses between F1 females and males of a parental strain, or crosses between F1 males and females, can also be used to examine the mode of inheritance in a haplodiploid species if the response of F2 males and females can be assessed independently (Goka, Reference Goka1998; Van Leeuwen et al., Reference Van Leeuwen, Stillatus and Tirry2004). In these cases, the response of F2 females can be analyzed based on the principles for diploids, and F2 males can be analyzed as described above. Thus, data for F2 females and males could both be used to test for mode of inheritance independently. However, for species such as B. tabaci, where the response of females to compounds acting on immature stages cannot be assessed independently of males, analysis of the response of F2 males from virgin F1 females provides a more robust test.
While the backcross method can be used in a haplodiploid species as described above, it has also been incorrectly applied (Omer et al., Reference Omer, Tabashnik and Johnson1995; Tan et al., Reference Tan, Riley and Wolfenbarger1996). In these studies, F1 females were backcrossed to males of a parental strain, and the response of all F2 progeny (males and females) were analyzed based on the methods for a diploid species. However, haploid males cannot be analyzed the same as diploid males. Because the genotypes in haploid males and diploid females differ, pooling the data for F2 progeny is not an appropriate test.
Our results suggest that resistance is controlled by more than one locus in the QC-02 (B biotype) strain and by one or two loci in the Pyri-R (Q biotype) strain. These results were consistent for a broad spectrum of model parameters. However, even in the best fit models, we observed significant deviation between observed and expected mortality for at least 50% of concentrations tested in both the QC-02 and Pyri-R strains. For the QC-02 strain, our results suggest that the effects of different loci on resistance are unequal and additive (major and minor loci) or non-additive (epistasis). The low slope of the concentration-mortality curve for the Yuma 04-S strain may also have confounded results, as Tabashnik (Reference Tabashnik1991) showed that models are less effective when parental strains have relatively low slopes. For the Pyri-R strain, the deviation between observed and expected mortality may be explained by variation in the concentration-mortality curve for F2 males. For this strain, increasing the sample size to reduce variation may have improved the fit between observed and expected mortality under the one- and two-locus models. Still, results using Lande's equation (modified for haplodiploids) support the conclusion that resistance is controlled by more than one locus in the QC-02 strain and one or two loci in the Pyri-R strain.
Our results are supported by biochemical and molecular work that indicate that at least two loci are involved in pyriproxyfen resistance in the QC-02 strain (Xianchun Li, personal communication). Our results also support those of Horowitz et al. (Reference Horowitz, Gorman, Ross and Denholm2003), who suggested that resistance in the Pyri-R strain was controlled by a single locus. They fitted curves to bioassay data for the response of F2 males to pyriproxyfen and observed a broad plateau at 50% mortality, indicating that resistance was monogenic (Horowitz et al., Reference Horowitz, Gorman, Ross and Denholm2003). Their approach differed from the present one in that the test of monogenic resistance was based on visual inspection of the data to see if a plateau of 50% mortality for F2 males occurred at concentrations intermediate to the dose-response curves for the parental strains.
While our results support a conclusion that the mode of inheritance of resistance to pyriproxyfen may differ between the B and Q biotype strains, it is unclear if this difference is responsible for the more rapid evolution of pyriproxyfen resistance in field populations of the Q biotype in Israel compared to the B biotype in Arizona (Horowitz et al., Reference Horowitz, Mendelson, Cahill, Denholm and Ishaaya1999, Reference Horowitz, Kontsedalov, Denholm and Ishaaya2002; Li et al., Reference Li, Dennehy and Nichols2003; Dennehy et al., Reference Dennehy, Degain, Harpold and Brink2004, Reference Dennehy, Degain, Harpold, Brown, Morin, Fabrick and Nichols2005). Although the number of loci affecting resistance may differ between the QC-02 strain from Arizona and the Pyri-R strain from Israel, the intensity of resistance was similar; and resistance in both strains is inherited as a partially-dominant, autosomal trait (Horowitz et al., Reference Horowitz, Gorman, Ross and Denholm2003; Crowder et al., Reference Crowder, Dennehy, Ellers-Kirk, Yafuso, Ellsworth, Tabashnik and Carrière2007, Reference Crowder, Ellers-Kirk, Yafuso, Dennehy, Degain, Harpold, Tabashnik and Carrière2008). However, strains of the Q biotype have recently been introduced to the U.S. on ornamental and greenhouse crops (Dennehy et al., Reference Dennehy, Degain, Harpold, Brown, Morin, Fabrick and Nichols2005). These strains are more resistant to pyriproxyfen and other insecticides than either the QC-02 or Pyri-R strains (Dennehy et al., Reference Dennehy, Degain, Harpold, Brown, Morin, Fabrick and Nichols2005; T.J. Dennehy, unpublished data). Thus, the mode of inheritance of resistance in introduced strains of the Q biotype may differ from that reported here. Molecular genetic analyses can provide further insight into the mechanisms of resistance in both biotypes by identifying genes associated with resistance.
Results from the tests of models with various numbers of loci and the modified Lande's equation are based on the assumptions that the logarithm of tolerance is normally distributed for each genotype, that each locus had only two alleles (S or R) and that the parental strains were homozygous for susceptibility or resistance (Lande, Reference Lande1981; Tabashnik, Reference Tabashnik1991; Tabashnik et al., Reference Tabashnik, Schwartz, Finson and Johnson1992). Violations of these assumptions could limit the precision of both methods (Tabashnik et al., Reference Tabashnik, Schwartz, Finson and Johnson1992). The low slope observed in the YUMA 04-S susceptible strain (B biotype) indicates high phenotypic variation, suggesting that this strain may not be completely homozygous for susceptibility. This could have reduced our ability to distinguish between results with the one and multi-locus models. However, despite this uncertainty, our results strongly suggest that resistance in the QC-02 strain is not monogenic.
We modified our standard models from those of Tabashnik (Reference Tabashnik1991) to account for differences in slope between the susceptible and resistant strains of the B biotype. The threefold differences in the slope of concentration-mortality curves between susceptible and resistant males could have added bias to our models if we had averaged the slope of parental strains in indirect tests, as in Tabashnik (Reference Tabashnik1991). Instead, we used slopes estimated from bioassays of each parental strain and assumed that the slope of concentration-mortality curves for intermediate genotypes were additive. However, qualitative results as to the best-fit models were similar in the sensitivity analysis where we assumed slope of concentration-mortality curves of all genotypes were the average of the parental strains. Results for the Q biotype strain were less dependent on slope than the B biotype strain due to the similarity in slope between susceptible and resistant strains of the Q biotype.
Although the statistical and analytical methods presented here cannot produce definitive conclusions as to the mode of inheritance of pyriproxyfen resistance in strains of the B and Q biotypes, they allowed for testing of alternatives to a monogenic hypothesis. Without such alternatives, there is a high probability of incorrectly accepting or rejecting a monogenic hypothesis (Preisler et al., Reference Preisler, Hoy and Robertson1990; Tabashnik, Reference Tabashnik1991; Tabashnik et al., Reference Tabashnik, Schwartz, Finson and Johnson1992). The results from such tests can be used as a guide for molecular analysis of resistance, as relative estimates of the number of loci affecting resistance can be obtained. However, studies that link molecular data with bioassay data are needed to provide further tests of the model's predictive power. The methods presented here can be applied to studies of insecticide resistance in other haplodiploid species, including mites, ticks, thrips and hymenopterans. Through a more detailed statistical analysis of hypotheses, using data commonly collected in inheritance studies, this type of analysis can improve the rigor of studies investigating the mode of inheritance of insecticide resistance or other traits.
Acknowledgements
Thanks to Christa Ellers-Kirk for growing seedlings for the bioassays. The research was funded in part by the United States Environmental Protection Agency under the Science to Achieve Results Graduate Fellowship Program, grant FP-91648901-0, an Achievement Rewards for College Scientists scholarship and NRICGP grant 2005-00925. This publication is not officially endorsed by EPA and may not reflect the views of the agency. Rothamsted Research receives grant-aided support from the Biotechnology and Biological Sciences Research Council of the UK.