

Introduction
To improve fitness, bacteria have evolved sophisticated machinery to produce secondary metabolites with remarkable structural and functional diversities. Secondary metabolites are often produced by specific and dedicated bio-synthetic pathways activated in response to environmental stimuli. If much is understood about the enzymatic cascades and mechanisms that underlie these bio-syntheses, comparatively little is known about the cellular organization of their components (Meyer et al., Reference Meyer, Cecchi and Stolovitzky2014). There is a long-standing hypothesis that enzymes involved in a metabolic pathway must organize into supra-molecular complexes (Schmitt and An Reference Schmitt and An2017), so that secondary metabolite synthesis is orchestrated by the assembly of sequential enzymes. This process is expected to be widespread (Narayanaswamy et al., Reference Narayanaswamy, Levy, Tsechansky, Stovall, O'Connell, Mirrielees, Ellington and Marcotte2009) (including in eukaryotic cells (An et al., Reference An, Kumar, Sheets and Benkovic2008; French et al., Reference French, Jones, Deng, Pedley, Kim, Chan, Hu, Pugh, Zhao, Zhang, Huang, Fang, Zhuang and Benkovic2016)) and to play an important role in the overall bio-synthesis efficiency or regulation (An et al., Reference An, Kumar, Sheets and Benkovic2008; Castellana et al., Reference Castellana, Wilson, Xu, Joshi, Cristea, Rabinowitz, Gitai and Wingreen2014). However observations on such specific multi-protein organizations are sparse in the cellular context and most of them are resulting from microscopy co-localization observations (Schmitt and An Reference Schmitt and An2017).
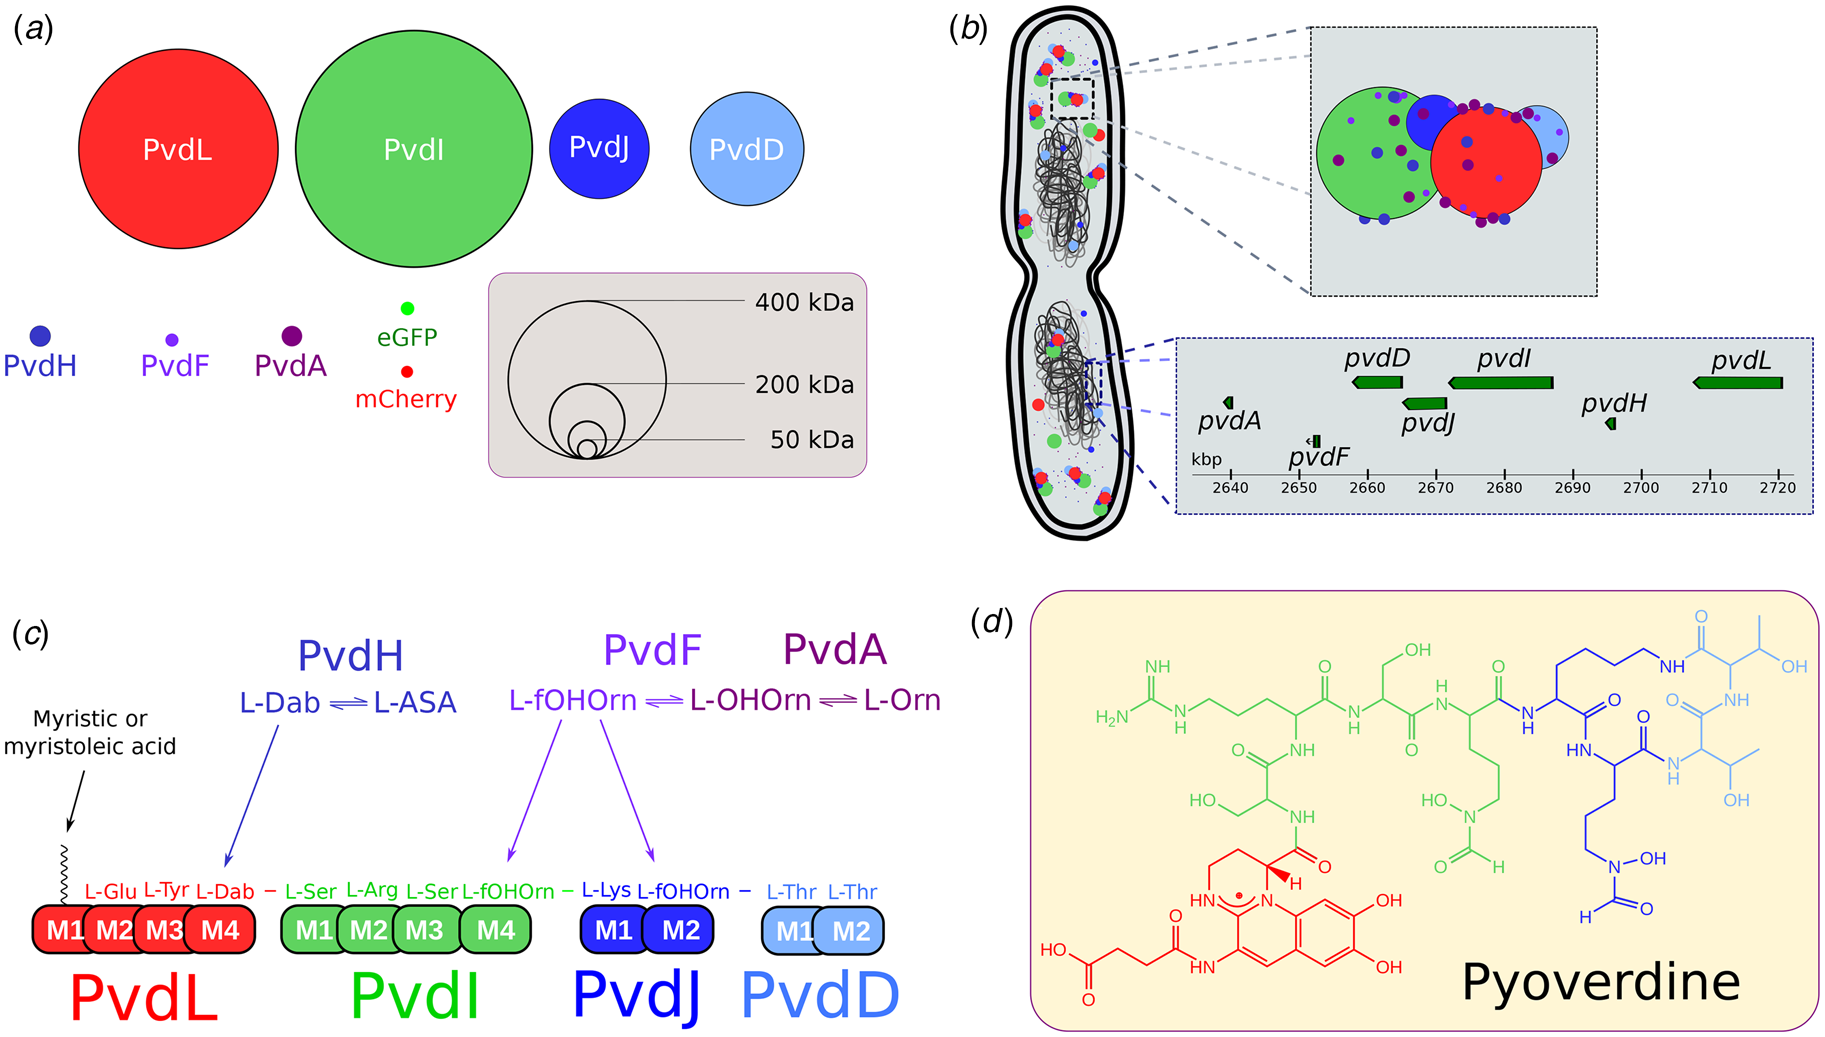
Here we used the pyoverdine (PVD) metabolic pathway of Pseudomonas aeruginosa PAO1 as a model system. PVDs are large fluorescent siderophores composed by an invariant (1S)-5-amino-2,3-dihydro-8,9-dihydroxy-1H-pyrimido(1,2-a)quinoline core grafted to a 6- to 12-amino acids chain (Meyer, Reference Meyer2000; Ravel and Cornelis, Reference Ravel and Cornelis2003). In PAO1, PVD synthesis relies on four non-ribosomal peptide synthetases (NRPSs); namely PvdL, PvdI, PvdJ, and PvdD (Georges and Meyer, Reference Georges and Meyer1995; Lehoux et al., Reference Lehoux, Sanschagrin and Levesque2000; Mossialos et al., Reference Mossialos, Ochsner, Baysse, Chablain, Pirnay, Koedam, Budzikiewicz, Fernández, Schäfer, Ravel and Cornelis2002; Ackerley et al., Reference Ackerley, Caradoc-Davies and Lamont2003; Lamont and Martin, Reference Lamont and Martin2003) (Fig. 1). NRPSs are large modular enzymes synthesizing peptides independently from ribosomes (Finking and Marahiel, Reference Finking and Marahiel2004; Strieker et al., Reference Strieker, Tanović and Marahiel2010). Each NRPS module is responsible for the incorporation of a defined monomer into the final product (Strieker et al., Reference Strieker, Tanović and Marahiel2010) (Fig. 1c). The PVD precursor in PAO1 is an 11 amino-acid (AA) peptide with the sequence L-Glu–L-Tyr–D-Dab–L-Ser–L-Arg–L-Ser–L-fOHOrn–L-Lys–L-fOHOrn–L-Thr–L-Thr. The second and third amino acids of the peptide (L-Tyr and D-amino butyric acid) will form the chromophore in the PVD mature form. The use of non-proteinogenic amino acids, including D-isomers, is the hallmark of NRPS and is responsible for the sequence diversity of non-ribosomal peptides and derived products (Marahiel et al., Reference Marahiel, Stachelhaus and Mootz1997). Accessory and tailoring enzymes are required to synthesize modified amino-acids assembled by NRPS into the final peptide. In PAO1, PvdA (Visca et al., Reference Visca, Ciervo and Orsi1994), PvdF (McMorran et al., Reference McMorran, Shanta Kumara, Sullivan and Lamont2001), and PvdH (Ikai and Yamamoto, Reference Ikai and Yamamoto1997; Lamont and Martin, Reference Lamont and Martin2003) are involved in the synthesis of L-fOHOrn and D-Dab. Their genes are found at proximity of NRPS genes in PAO1 genome (Fig. 1b) in large bio-synthetic gene clusters (BGCs) (Chiang et al., Reference Chiang, Chang, Oakley and Wang2011; Gulick, Reference Gulick2017). These cytoplasmic enzymes are thus likely co-expressed with NRPS when the PVD pathway is activated.
NRPS of P. aeruginosa PAO1. (a) Enzymes involved in the cytoplasmic bio-synthesis of the PVD precursor in PAO1. Four large NRPSs (PvdL, PvdI, PvdJ, and PvdD) are responsible for the synthesis of an 11 amino-acid (AA) peptide and for the incorporation of modified AA, produced by PvdH(L-Dab) and by PvdA and PvdF (L-fOH Orn) accessory proteins. The diameters of the enzymes are proportional to their molecular weights. eGFP and mCherry are shown for MW comparison. (b) Schematic view of the chromosomic genes and cytoplasmic proteins involved in the early steps of the PVD bio-synthetic pathway in PAO1. Genes coding for NRPSs and accessory proteins are found in a large biosynthetic gene cluster (BGC). Once the PVD pathway is activated, proteins encoded by genes in the BGC are expressed and may organize in siderophore-specific multi-enzymatic complexes called siderosomes. (c) PVD precursor sequence. During bio-synthesis, each NRPS module is responsible for the incorporation of a defined AA. PvdL (red), PvdI (green), PvdJ (blue), and PvdD (light blue) are acting sequentially to add respectively 3,4,2 and 2 AA of the 11-AA sequence of the PVD precursor. (d) PVD (type I) – the major siderophore synthesized by PAO1 – is the maturated form of the cytoplasmic precursor of 11 AA.

PvdA catalyzes the FAD-dependent hydroxylation of the amine side chain of ornithine using nicotinamide adenine dinucleotide phosphate (NADPH) as the electron donor and molecular oxygen to synthesize N5-hydroxy-ornithine (Ge and Seah, Reference Ge and Seah2006; Meneely et al., Reference Meneely, Barr, Martin Bollinger and Lamb2009). Recent fluorescence microscopy findings have shown a high cellular organization of PVD-related proteins with clusters of PvdA co-localizing with PvdD, PvdL, and PvdJ in fluorescence microscopy (Guillon et al., Reference Guillon, Mecherki, Altenburger, Graumann and Schalk2012; Imperi and Visca, Reference Imperi and Visca2013). Pull-down assays using a recombinant hexa histidine-tagged PvdA protein as a bait captured low amount of PvdJ and PvdL (Imperi and Visca, Reference Imperi and Visca2013). PvdA has also been shown to interact with PvdJ M2 isolated module in yeast double-hybrid experiments (Imperi and Visca, Reference Imperi and Visca2013). Taken together, these data suggest that PvdA is interacting with NRPS and may be part of large multi-enzymatic complexes named siderosomes (Guillon et al., Reference Guillon, Mecherki, Altenburger, Graumann and Schalk2012; Imperi and Visca, Reference Imperi and Visca2013; Gasser et al., Reference Gasser, Guillon, Cunrath and Schalk2015). However a clear biochemical characterization of these complexes is missing – possibly due to highly dynamic interactions between the proteins of the siderosomes and/or their transient formation (Gasser et al., Reference Gasser, Guillon, Cunrath and Schalk2015). Moreover only a few attempts for characterizing these complexes in the cellular environment have been reported. In this context, in cellulo characterization with high temporal and/or spatial resolution is required to capture siderosomes organization.
In this work, we investigated the localization and dynamics of PvdA in cells using single-particle tracking combined with single-molecule tracking localization using photo-activated localization microscopy (sptPALM (Manley et al., Reference Manley, Gillette, Patterson, Shroff, Hess, Betzig and Lippincott-Schwartz2008)). The statistical description of thousands of single PvdA traces in cells showed that PvdA was mostly diffusing as large complexes in the cytoplasm, except for a small restricted and exchangeable fraction diffusing with a lower diffusion rate. We additionally used Förster resonance energy transfer (FRET) measured by fluorescence lifetime imaging microscopy (FLIM (Bastiaens and Squire, Reference Bastiaens and Squire1999)) to evidence PvdA interactions with PvdJ, PvdI, PvdL, and PvdD. Although the exact determination of the complex stoichiometry was not accessible from FLIM-FRET measurements, our data are consistent with transient interactions of several PvdA on PvdI, PvdD, and PvdL whereas PvdJ interacts with PvdA in a 1 : 1 stoichiometry. Our data evidence a complex organization of siderosomes and suggest that PvdA binding sites have co-evolved with NRPS module specificity.
Materials and methods
Bacterial strains, plasmids, and growth conditions
P. aeruginosa strains used in this study are listed in Supplementary Table S1. Bacteria were grown in 5 mL lysogeny broth (Difco) at 30 °C under 220 rpm orbital shaking. To induce the expression of the PVD pathway enzymes, P. aeruginosa strains were pelleted by centrifugation, washed, and further grown overnight at 30 °C in an iron-deficient succinate medium (composition: 6 g L−1 K2HPO4, 3 g L−1 KH2PO4, 1 g L−1 (NH4)2SO4, 0.2 g L−1 MgSO4, 7H2O, and 4 g L−1 sodium succinate with the pH adjusted to 7.0 by adding NaOH). Cells were finally diluted and grown an additional 24 h. The presence of PVD in the supernatant can be visually observed as an intense yellow-green water-soluble pigment.
Mutants construction
All enzymes for deoxyribonucleic acid (DNA) manipulation were purchased from ThermoFisher Scientific and were used in accordance with the manufacturer's instructions. E. coli strain TOP10 (Invitrogen) was used as the host strain for all plasmids. The DNA fragments from P. aeruginosa used for cloning were amplified from the genomic DNA of the PAO1 strain with Phusion High-Fidelity DNA polymerase (ThermoFisher Scientific). The primers used are listed in supplementary Table S3 of the Supporting Information. As previously described (Guillon et al., Reference Guillon, Mecherki, Altenburger, Graumann and Schalk2012), the general procedure for the construction of the plasmids involved insertion of the mcherry, egfp or photo-activatable mcherry gene flanked by upstream and downstream regions of 700 bp, corresponding to the insertion site, into a pME3088 or a pEXG2 vector. For the pVEGA30 plasmid, pEXG2 was amplified by the primers pEXG2HindIIIR and pEXG2EcoRIF, and the egfp gene flanked by upstream and downstream regions of 700 bp ligated into the plasmid by blunt-end cloning. Mutations in the chromosomal genome of P. aeruginosa were generated by transferring the suicide vector from E. coli TOP10 strain into the P. aeruginosa recipient strain and allowing the plasmid to integrate into the chromosome, with selection for tetracycline resistance for pME3088 (Voisard et al., Reference Voisard, Bull, Keel, Laville, Maurhofer, Schnider, Dfago, Haas, O’Gara, Dowling and Boesten1994) or gentamicin resistance for pEXG2. A second crossing-over event excising the vector was achieved by enrichment for tetracycline-sensitive cells (pME3088) or sucrose resistant cells selection (pEXG2), to generate the corresponding mutants (Ye et al., Reference Ye, Haas, Ka, Krishnapillai, Zimmermann, Baird and Tiedje1995). All tag insertion mutants were verified by PCR and sequencing.
Wide field imaging
Wide field imaging was performed on a Micro-Manager (Edelstein et al., Reference Edelstein, Tsuchida, Amodaj, Pinkard, Vale and Stuurman2014) controlled Olympus IX-81 inverted microscope equipped with z-drift control and an auto-focus system (ZDC Olympus). Phase images were generated using a Phase3 100× 1.4NA objective (Olympus) using a 512 × 512 pixels EM-CCD (ImagEM – Hamamatsu Photonics – Japan). Epifluorescence excitation was provided by a 488 nm laser diode (spectra physics) using a 488 nm (Di01-R488 – Semrock) dichroic filter. Fluorescence signals were filtered using a 488 nm long pass filter (BLP01-488R-25 – Semrock). Live-cells were immobilized on a 1% agarose pad and imaged at 20 °C. Quantitative fluorescence measurements were performed at the cell level using a home-made imageJ plugin for cell segmentation and fluorescence quantification. Initial cell segmentation was based on a Laplacian of Gaussian (LoG) filtering of the phase image and further used to define a rod-shape contour (sphero-cylinder) based on different central moment calculations. Initial rod-shape contours were then refined based on the isotropic 3 × 3 gradient of the initial image to adjust bacteria contours.
Photo-activated localization microscopy (PALM) and single particle tracking-PALM (sptPALM)
PALM and sptPALM (Manley et al., Reference Manley, Gillette, Patterson, Shroff, Hess, Betzig and Lippincott-Schwartz2008) were performed on a home-built Micro-Manager (Edelstein et al., Reference Edelstein, Tsuchida, Amodaj, Pinkard, Vale and Stuurman2014) controlled inverted-microscope based on a Nikon Eclipse II equipped with a 100× 1.49 objective (Nikon – Japan) and a drift focus compensator (Perfect Focus System – Nikon – Japan). Photo-activable mCherry (PA-mCherry) was excited with a 561 nm diode laser (Oxxius – France) and activated with a 405 nm laser diode (Spectra Physics – Germany) selected by an acousto-optic tunable filter (AOTFnC 400-650 TN, AA Otpo Electronic- France). Fluorescence emission of PA-mCherry was collected through a quadri-band dichroic filter (FF405/496/560/651-Di01-25 × 36 – Semrock – USA) and further filtered with a 561 nm long-pass filter (561 nm RazorEdge, Semrock – France). The wavefront distortions of the emission signal were corrected using an adaptive optics device (MicAO, Imaging Optics – France) before being imaged on a 512 × 512 pixels EM-CCD (ImagEM – Hamamatsu Photonics – Japan) operating at −65 °C with an ADU to photon conversion factor of about 60. Image stacks ranging from 2000 to 5000 frames with an exposure time of 16 to 50 ms were typically recorded for sptPALM using a home-written Beanshell acquisition script. Molecule localizations were retrieved using Peakfit, an open source software package for Fiji and further analyzed using self-written script in R. Tracking traces were generated using the simple Linear Assignment Problem (LAP) tracker (Jaqaman et al., Reference Jaqaman, Loerke, Mettlen, Kuwata, Grinstein, Schmid and Danuser2008) implemented in TrackMate plugin (Tinevez et al., Reference Tinevez, Perry, Schindelin, Hoopes, Reynolds, Laplantine, Bednarek, Shorte and Eliceiri2017) for Fiji. The simple LAP is well suited for tracking molecules undergoing Brownian motion or for low density of molecules undergoing non-Brownian motion. Data were further analyzed in R according to a jump distance analysis (Weimann et al., Reference Weimann, Ganzinger, McColl, Irvine, Davis, Gay, Bryant and Klenerman2013) assuming the mean square displacement is proportional to the two-dimensional diffusion coefficient D (in 2-D Brownian motion) such that ⟨r 2(Δt)⟩ = 4D j × Δt. Diffusion coefficients were retrieved from the empirical cumulative distribution function (ecdf) of the particles’ displacements in a set time interval according to:

The choice the ecdf rather than the discrete probability density function (pdf) histogram for fitting was motivated by the dependence of the pdf histogram to the user input for bin-size selection – possibly biasing the fitting parameters.
Hidden Markov model (HMM) estimates were obtained using the Baum–Welch algorithm (Baum et al., Reference Baum, Petrie, Soules and Weiss1970) and the Viterbi algorithm (Viterbi, Reference Viterbi1967), both implemented in the R HMM package (https://cran.r-project.org/package=HMM) that predict the most likely sequence of Markov states given the observed dataset. Diffusion coefficients were obtained from the HMM exponential rates. HMM parameter confidence intervals (exponential rates and transition matrix) were obtained by bootstrap.
The tracking analysis procedure was challenged using data of the Particle Tracking Challenge (http://www.bioimageanalysis.org/track/) found in Supplementary Video 1 of reference (Chenouard et al., Reference Chenouard, Smal, de Chaumont, Maška, Sbalzarini, Gong, Cardinale, Carthel, Coraluppi, Winter, Cohen, Godinez, Rohr, Kalaidzidis, Liang, Duncan, Shen, Xu, Magnusson, Jaldén, Blau, Paul-Gilloteaux, Roudot, Kervrann, Waharte, Tinevez, Shorte, Willemse, Celler, van Wezel, Dan, Tsai, Ortiz de Solórzano, Olivo-Marin and Meijering2014) corresponding to simulated images of vesicles undergoing Brownian motions with a medium particle density and a signal-to-noise ratio of four. Retrieved parameters were in excellent agreement with the ground truth as shown in Supplementary Fig. S5.
Fluorescence lifetime imaging microscopy (FLIM)
Time-correlated single-photon counting FLIM measurements were performed on a home-made two-photon excitation scanning microscope based on an Olympus IX70 inverted microscope with an Olympus 60 × 1.2 NA water immersion objective operating in de-scanned fluorescence collection mode (Batisse et al., Reference Batisse, Guerrero, Bernacchi, Richert, Godet, Goldschmidt, Mély, Marquet, de Rocquigny and Paillart2013; El-Meshri et al., Reference El-Meshri, Dujardin, Godet, Richert, Boudier, Darlix, Didier, Mély and de Rocquigny2015). Two-photon excitation at 930 nm was provided by a Ti:Sapphire oscillator (Mai Tai® DeepSee™, Spectra Physics – 80 MHz repetition rate, ≈70 fs pulse width) at 10–20 mW. Fluorescence photons were collected through a 680 nm short pass filter (F75-680, AHF, Germany) and a 525/50 nm band-pass filter (F37-516, AHF, Germany) and directed to a fiber-coupled avalanche photo-diode (SPCM-AQR-14-FC, Perkin Elmer) connected to a time-correlated single photon counting module (SPC830, Becker & Hickl, Germany). Cells grown for 48 h in succinate media were immobilized on a 1% agarose pad and rapidly imaged. Typically, area of 50 × 50 µm in the samples was scanned at 4 µs per pixel (1024 × 1024 pixels) for 100 to 600 s to reach the Nyquist–Shannon sampling criteria and to achieve the appropriate photon statistics to investigate the fluorescence decays. Fluorescence decays were processed using a commercial software package (SPCImage V2.8, Becker & Hickl, Germany). A binning of two was applied before processing the fluorescence decays. FLIM data were further analyzed using a homemade ImageJ plugin and R scripts as described in reference (Godet and Mely, Reference Godet and Mely2019).
Results
PvdA diffuses within large complexes in the cytoplasm
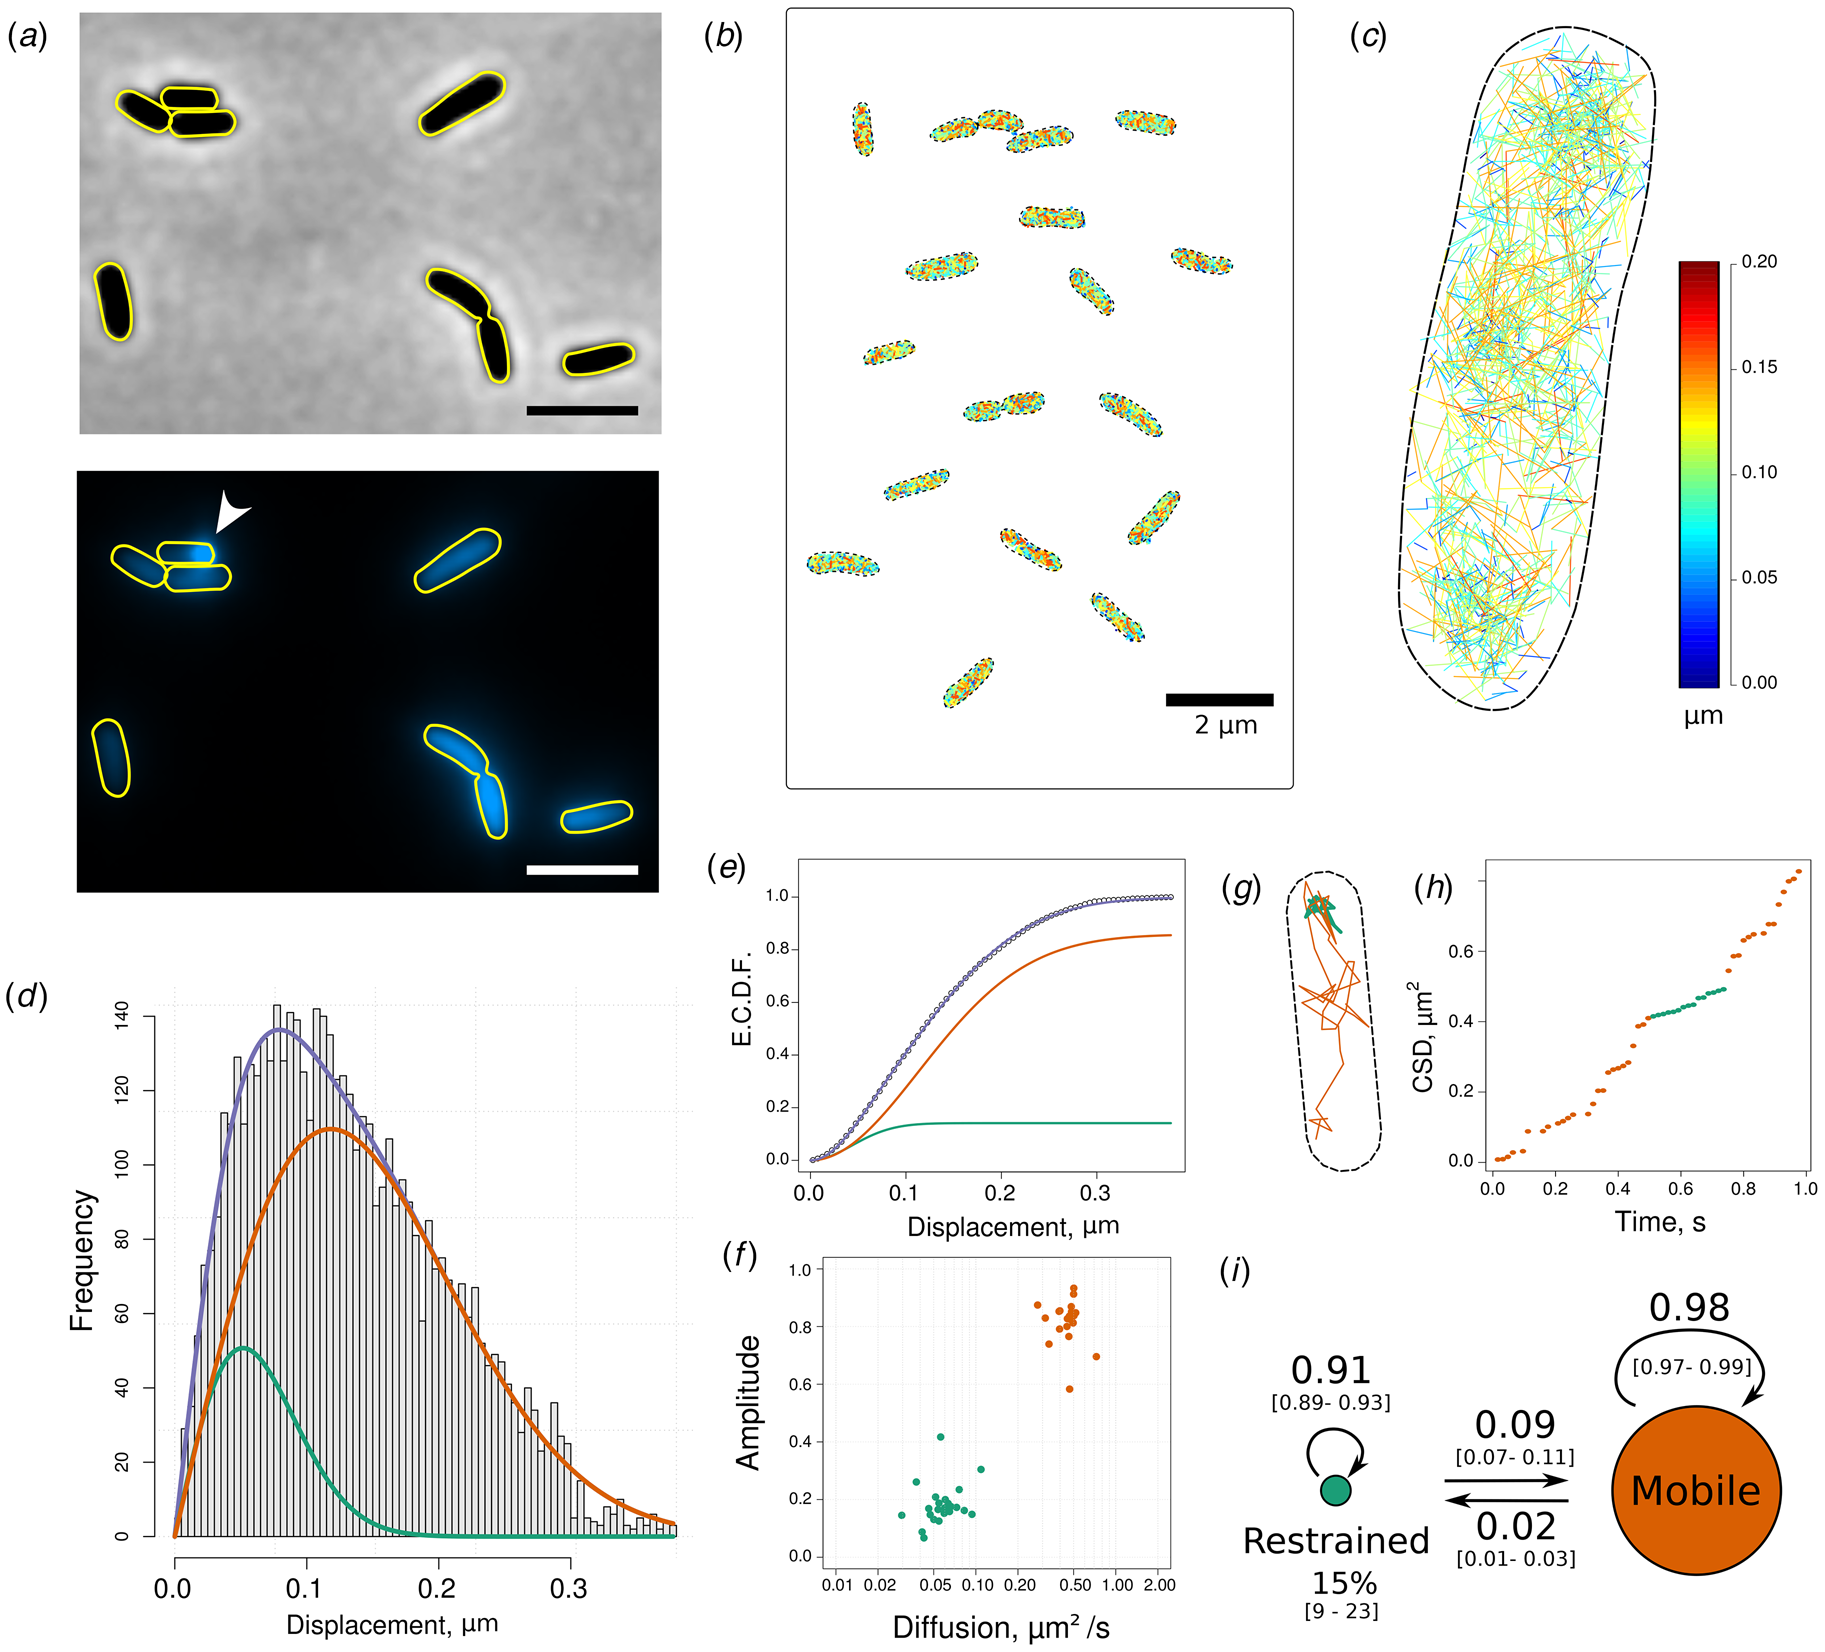
To localize PvdA enzyme in its intracellular environment, we produced strains expressing at the chromosomal level PvdA fused to eGFP, eYFP or PAmCherry at its C-terminus as previously described (Guillon et al., Reference Guillon, Mecherki, Altenburger, Graumann and Schalk2012; Gasser et al., Reference Gasser, Guillon, Cunrath and Schalk2015). These strains genetically expressed fluorescent PvdA at physiological levels as shown by quantitative reverse transcription PCR (RT-qPCR) (Guillon et al., 2012; Gasser et al., Reference Gasser, Baco, Cunrath, August, Perraud, Zill, Schleberger, Schmidt, Paulen, Bumann, Mislin and Schalk2016). The expression of fluorescent PvdA was increased in iron-deprived growing conditions. These strains were able to produce PVD (see Supplementary Fig. S1). Epifluorescence microscopy showed that PvdA-eGFP was localized in the cytoplasm. The level of expression of PvdA-eGFP was heterogeneous from cell to cell. No spatial organization was observed along the cell cycle, except for some unilateral polar spots in few cells (Fig. 2a and b). However, the resolution of epifluorescence microscopy is too low to rule out sub-diffraction limit (~250 nm) organizations. To explore more in detail the localization and diffusion of single PvdA in live cells, we used photoactivated localization microscopy (PALM) – a single molecule localization microscopy method allowing to determine the position of individual fluorescent molecules with nanometer accuracy in live cells (Betzig et al., Reference Betzig, Patterson, Sougrat, Wolf Lindwasser, Olenych, Bonifacino, Davidson, Lippincott-Schwartz and Hess2006). In PALM, tiny fractions of PvdA-PAmCherry are photo-activated at each acquisition frame, allowing determining their localizations with sub-diffraction precision. Thousands of sparse subsets of molecule coordinates pinpointed sequentially in time can then be accumulated within an imaged area. Using TIRF illumination limiting the observation, the cytoplasmic zone immediately above the membrane contacting the surface, PvdA-PAmCherry was found to localize homogeneously in the cytoplasm. Despite a retrieved density of 2000–3000 molecule localizations per μm2, high enough to define spatial arrangements at a resolution of ~40 nm resolution, no particular structural organization was observed for PvdA, with the exception of preferential accumulation at one pole in some cells (Guillon et al., Reference Guillon, Mecherki, Altenburger, Graumann and Schalk2012). We also used PALM to perform high-density sptPALM to explore PvdA molecular trajectories within the cell. About 6000 individual trajectories were computed from ~54 000 linkable individual localizations in 42 cells, allowing the construction of single molecule diffusion maps at the single cell level. Diffusion patterns appeared very similar from cell to cell (Fig. 2b), with traces of heterogeneous velocities scattered throughout the cytoplasm (Fig. 2c). We were not able to identify exclusion areas. To take advantage of the large number of short trajectories obtained with PvdA-PAmCherry in live cells, we computed jump-distances (JDs) defined as the distance travelled by a single molecule during a fixed time lag Δt (from 16 to 50 ms). Over the population of molecules, JD distribution reflects the fine features of the underlying diffusion mechanisms and/or the number of diffusing species (Fig. 2d) (Weimann et al., Reference Weimann, Ganzinger, McColl, Irvine, Davis, Gay, Bryant and Klenerman2013). JD histograms of PvdA were found very similar to the different cells. Assuming PvdA underwent Brownian motions, a nice adjustment of the empirical cumulative distribution of the JD was obtained with a two-populations model (Fig. 2e), suggesting the presence of two diffusing populations of PvdA. Diffusion coefficients were 0.06 (0.02; 0.08) and 0.47 (0.39–0.54) μm2 s−1. We assigned these values to trapped and diffusing species, respectively (Fig. 2f). Due to the finite localization precision (localization error of ~30–40 nm), PvdA molecules diffusing at 0.06 μm2 s−1 could indiscriminately correspond to trapped, restrained or immobile fractions and were therefore referred as restrained hereafter. This fraction was found to represent about 10 to 24% (median 15%) of the total tracked PvdA. The value of 0.47 (0.39–0.54) μm2 s−1 is about one order of magnitude slower as compared to the observed or calculated diffusion of free cytoplasmic proteins with the same molecular weight in E. coli (Kalwarczyk et al., Reference Kalwarczyk, Tabaka and Holyst2012). Although the viscosity of the cytoplasm of PAO1 might be slightly increased due to its smaller volume and its larger genome size as compared to E. coli, it is unlikely to explain such a difference. PvdA must therefore diffuse in the cytoplasm bound to a large complex.
Single molecule tracking of PvdA-PAmCherry in live P. aeruginosa PAO1. (a) Phase-contrast (upper) and fluorescence (lower) images of PvdA-eGFP in PAO1 grown in succinate media at 30 °C for 48 h. PvdA-eGFP is found homogeneously distributed in the cytoplasm. Some cells presented fluorescent spots at one pole (white arrow), as previously described (Guillon et al., Reference Guillon, Mecherki, Altenburger, Graumann and Schalk2012; Imperi and Visca, Reference Imperi and Visca2013; Gasser et al., Reference Gasser, Guillon, Cunrath and Schalk2015). Scale bars = 2 µm. (b) Concatenated image of representative PvdA-PAmCherry cell diffusion maps obtained by sptPALM at 20 °C and (c) magnification of a representative single cell diffusion map. Trajectories steps are color-coded to indicate instantaneous jump distances (JDs) (μm observed during Δt = 16 ms time interval). (d) JD distribution representing the Euclidean distances travelled by ~23 800 PvdA-PAmCherry molecules during a 16 ms time interval. These data correspond to the JD observed in 29 cells measured in four independent experiments. (e) The corresponding ecdf was fitted assuming a two-population diffusion model. Diffusion coefficients of 0.06 (0.02–0.08) μm2 s−1 and 0.47 (0.39–0.54) μm2 s−1 [median (IQR)] were determined for the restrained (green) and mobile (orange) complexes, respectively. (f) Scatter plot of the amplitude of the restrained and mobile forms of PvdA-PAmCherry as a function of their corresponding diffusion coefficients (n = 23 cells). (g) Single PvdA-PAmCherry tracking trace observed at 62.5 Hz and (h) its cumulative square distance (CSD) as a function of time. The trace and the CSD are color-encoded according to their diffusion regime defined by a discrete two-state HMMs. (i) Schematic representation of the probability transition matrix retrieved from the HMM. The diameters of the diffusion regimen are proportional to their steady-state amplitudes. The probability of transition from mobile to restrained regimen was 2%. The bootstrapped 2.5 and 97.5% percentiles of the transition matrix parameters are in squared brackets.

To explore possible transitions between these two populations, we adjusted the square of the displacement values with a discrete two-state HMMs assuming an exponential probability distribution. The HMM provides information about the average duration time in a state before transition, the probabilities for molecules to transition from one state to the other and the mean diffusion value of each state. A representative tracking trace (although much longer than the 128 ms median trace duration) is presented in Fig. 2g for illustration, together with its cumulative square displacement (CSD) plotted over time (Chung et al., Reference Chung, Akita, Vandlen, Toomre, Schlessinger and Mellman2010) (Fig. 2h) to provide a visual representation of the HMM model output. An overall linear increase of CSD for a given time window indicates that the JDs are distributed around their average value and therefore that the molecule diffuses uniformly. Break points defined by changes in slopes are likely to correspond to state transitions. It is clearly illustrated in Fig. 2g and h that the HMM model properly identifies the two states and their transitions. The transition probability matrix Pi of the model is presented in Fig. 2i. A PvdA in the restrained state has a probability of about 9% to transition to the mobile fraction on the next frame whereas only about 2% of the mobile PvdA are expected to become restrained. Although the probabilities are low, about 260 events of mobile-to-restrained and restrained-to-mobile transitions were observed within traces showing the two diffusion regimen are exchangeable. Finally, the amplitudes of the two populations were calculated as the steady-state probability distribution of the stationary Markov chain. A value of 15% [CI95% = (9;23)%] was associated with the constrained state, in very good agreement with the estimation made by fitting the JD empirical cumulative distribution. All these results were reproduced using PvdA-eYFP to rule out any quantification artefacts possibly resulting from PAmCherry photo-physical properties (see Supplementary Fig. S2).
Taken together, these data clearly demonstrate that PvdA was mostly diffusing in the cytoplasm bound to large protein complexes without evidence for any spatial organization pattern nor cytoplasmic exclusion areas at a ~40 nm resolution (TIRF illumination). A small fraction estimated at ~15% exhibited a reduced diffusion rate. We assigned it to trapped complexes. The diffusing and trapped complexes were found exchangeable.
PvdI interacts with many PvdA
PvdA is an ornithine hydroxylase (Meneely et al., Reference Meneely, Barr, Martin Bollinger and Lamb2009) working in tandem with the hydroxy-ornithine transformylase PvdF (McMorran et al., Reference McMorran, Shanta Kumara, Sullivan and Lamont2001) to generate fOH-Ornithine used as a building block by PvdI and PvdJ. To explore whether NRPSs are cytoplasmic partners of PvdA, we sought to explore the physical interactions between PvdA and PvdI in live cells producing PVD. We used FLIM to measure FRET. FLIM is a general technique to probe changes in fluorophores’ local environment. In time-domain FLIM, a pulsed laser periodically excites the fluorophores in the sample. Following excitation, fluorophores relax into their ground-state either by emitting a photon (radiative decay) or through a non-radiative pathway. The fluorescence lifetime τ is defined as the average time a fluorophore remains in the excited state after excitation according to:

in which k r and k nr are the radiative and the non-radiative rate constants, respectively.
Experimentally, each detected fluorescence photon is tagged with its arrival time relative to the last excitation laser pulse. The fluorescence lifetime τ can thus be retrieved by adjusting the experimental fluorescence decay with a sum of exponentials defined by rates inversely proportional to their fluorescence lifetimes. In the presence of a fluorescence acceptor (as mCherry) in the close vicinity of a fluorescence donor (as eGFP), FRET can occur – increasing the non-radiative de-excitation rate k nr of the donor and thus decreasing its fluorescence lifetime. FRET can only occur if the acceptor is only a few apart from the donor, a distance range implying physical interaction between the labeled molecules. FLIM FRET is therefore particularly well suited to probe protein–protein interactions in living cells (Bastiaens and Squire, Reference Bastiaens and Squire1999; Day et al., Reference Day, Periasamy and Schaufele2001; Sengupta and Lippincott-Schwartz, Reference Sengupta and Lippincott-Schwartz2012). Moreover, as the fluorescence lifetime is an intrinsic parameter of the fluorophore independent of concentration, FRET-FLIM is more robust than intensity-based methods to measure FRET when concentrations of interacting partners cannot be controlled.
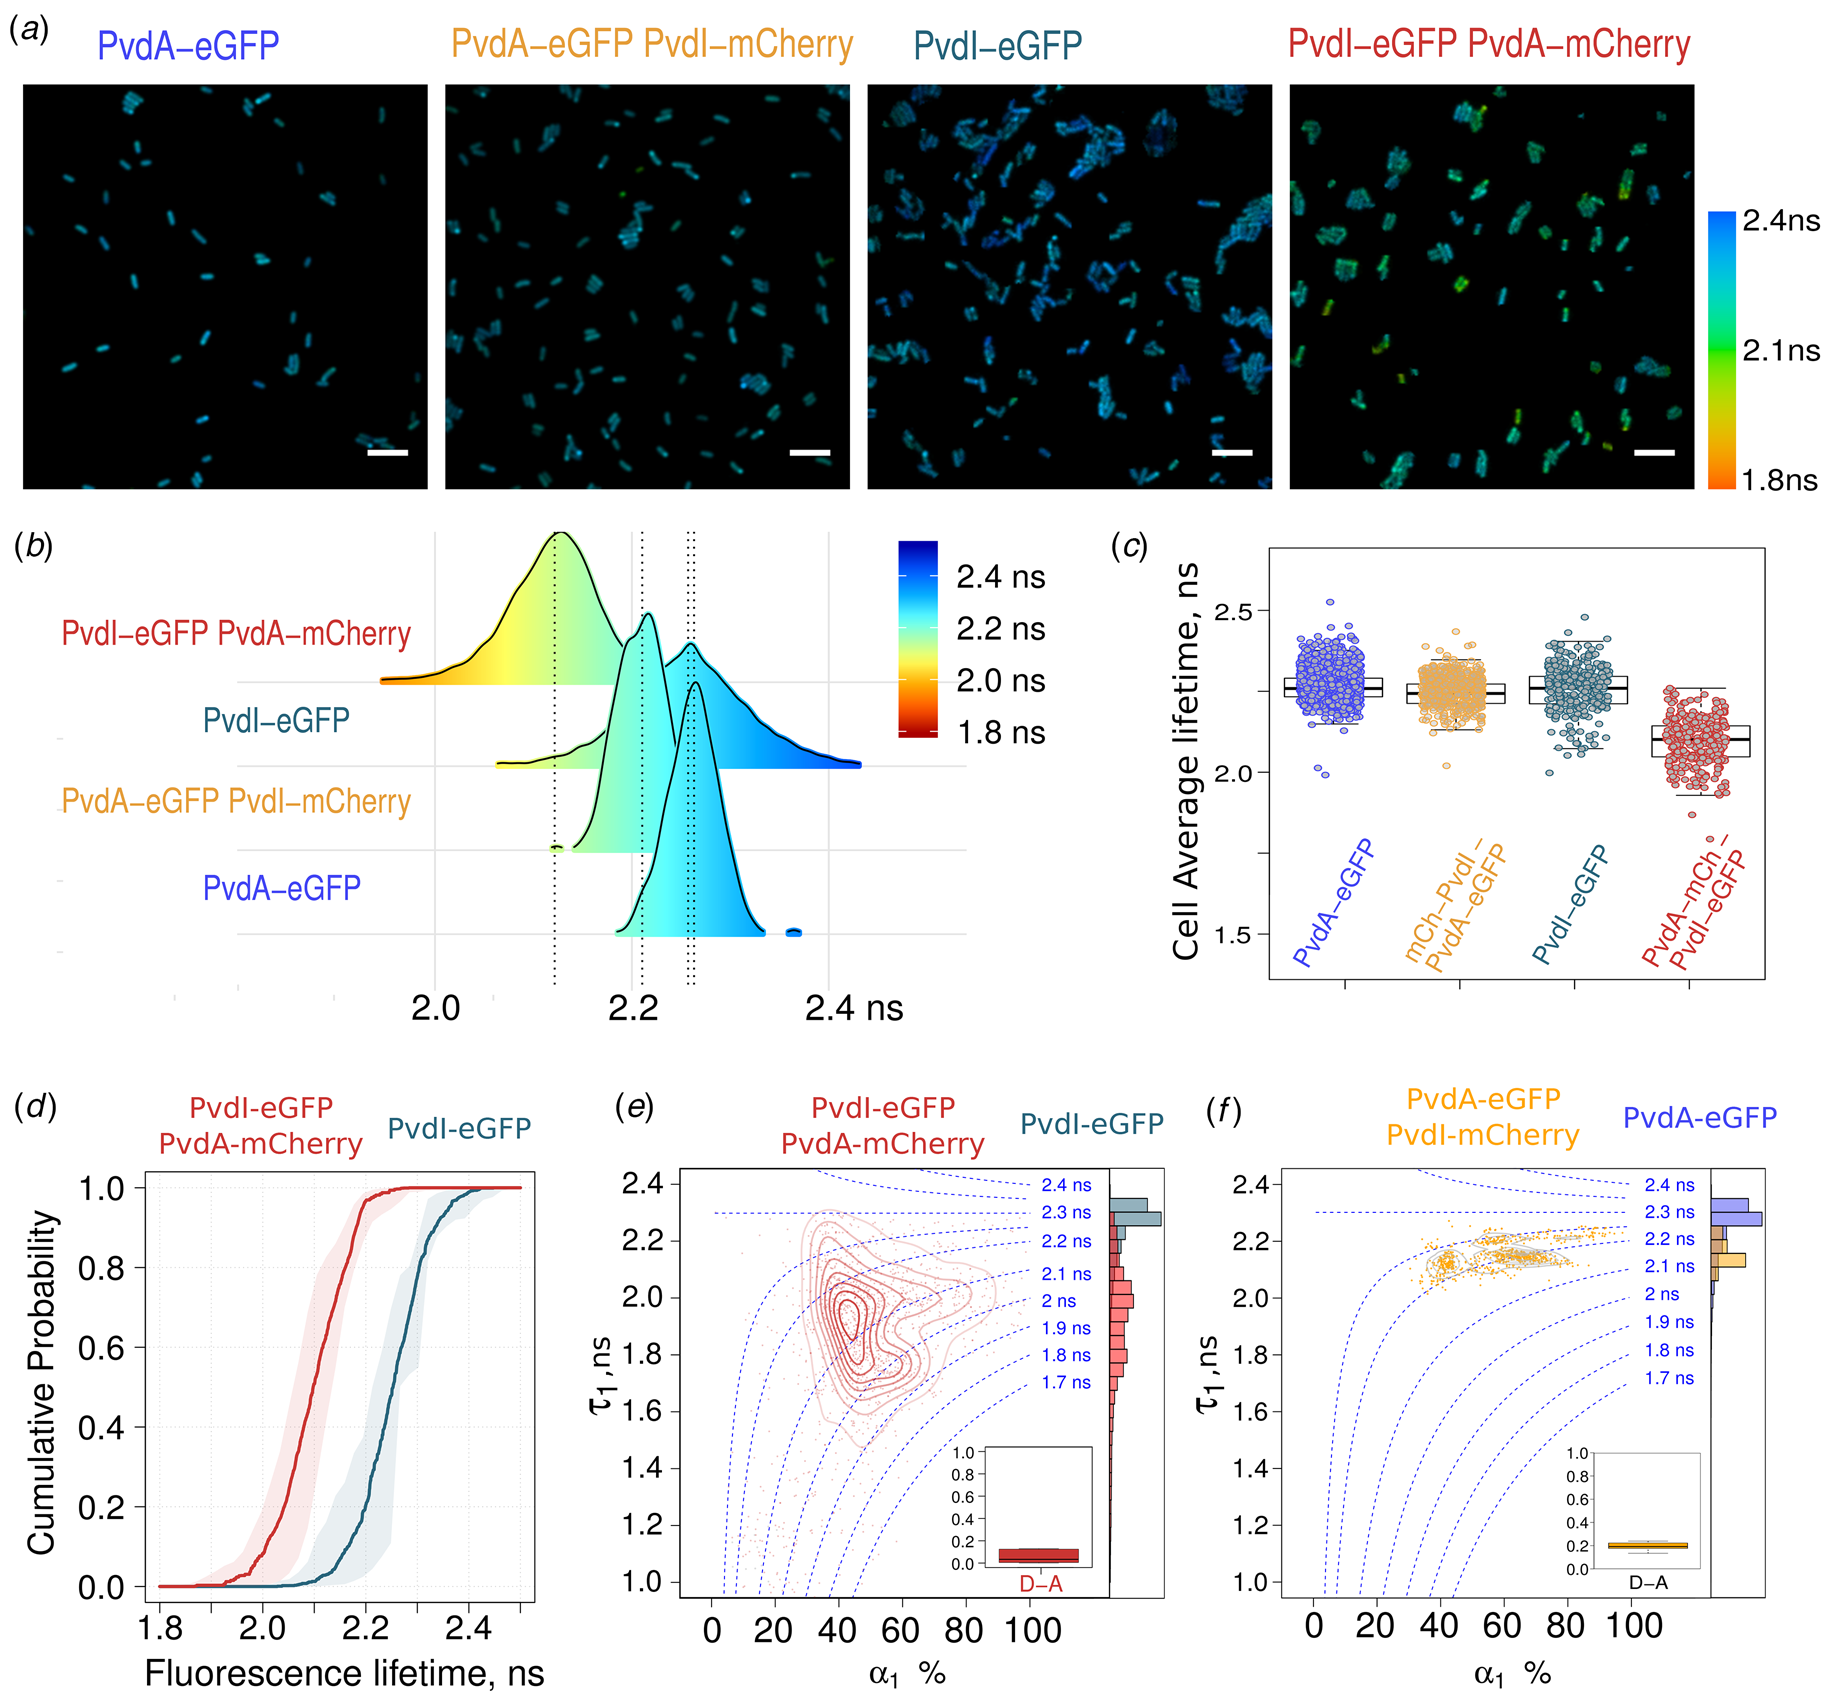
Strains expressing only PvdA-eGFP or PvdI-eGFP cultured in succinate media for 48 h were imaged using FLIM (Fig. 3a). Their fluorescence decays were adjusted with a single exponential model to retrieve their average fluorescence lifetime. The expression level of PvdA-eGFP, measured by the fluorescence intensity of cells on the microscopy images, was higher than that of PvdI-eGFP (see also Supplementary Fig. S3). But the fluorescence lifetime values of PvdA-eGFP or PvdI-eGFP were very similar with a median value of about 2.25 ns (Fig. 3b and c).
FRET-FLIM measurement of the PvdA–PvdI interaction in live PAO1. (a) Representative FLIM images of (from left to right) PvdA-eGFP, PvdA-eGFP PvdI-mCherry, PvdI-eGFP, and PvdI-eGFP PvdA-mCherry strains showing limited shortening in the average lifetime of PvdA-eGFP co-expressed with PvdI-mCherry in PAO1 but a larger effect for PvdI-eGFP co-expressed with PvdA-mCherry. All images are color-encoded according to the pixel fluorescence lifetime values. The same color scale (on the right) is used for the four images. Scale bar = 5 µm. (b) Probability density distribution of the mean fluorescence lifetime of pixels of (from bottom to top) PvdA-eGFP (n = 10 863), PvdA-eGFP PvdI-mCherry (n = 13 127), PvdI-eGFP (n = 6962), and PvdI-eGFP PvdA-mCherry (n = 14 456) strains from at least N = 3 independent experiments (n = number of pixels). (c) Average fluorescence lifetime of individual cells of (from left to right) PvdA-eGFP (n cell = 1154; N = 8), PvdA-eGFP PvdI-mCherry (n cell = 486; N = 3), PvdI-eGFP (n cell = 291; N = 3), and PvdI-eGFP PvdA-mCherry (n cell = 303; N = 3) (n cell = number of analyzed cells; N = number of independent experiments). (d) Empirical cumulative probability distribution of the fluorescence lifetime of PvdI-eGFP and PvdI-eGFP PvdA-mCherry (data from panel B). (a), (b), (c), and (d) provide evidence for a physical interaction between PvdA and PvdI. (e) and (f) Density map with contour lines of (τ 1, α 1) fitting parameters showing clusters of pixels with similar decay signature for (e) PvdI-eGFP PvdA-mCherry (red) and (f) PvdA-eGFP PvdI-mCherry (orange). The histograms of the short-lived lifetime (τ 1) of the donor–acceptor couple and the average lifetime〈τ〉of the corresponding donor-only conditions are plotted as marginal histograms. Inset: box plot of the fraction per cell of pixels better fitted with a single exponential decay model – corresponding to decays with no energy transfer.

Co-expression of PvdI-mCherry with PvdA-eGFP resulted in a limited shortening of the average lifetime of PvdA-eGFP (Fig. 3b and c), suggesting poor interaction or long inter-dyes distances. In sharp contrast, the average lifetime of cells expressing PvdI-eGFP was significantly shortened in the presence of PvdA-mCherry. Energy transfer between PvdI-eGFP and PvdA-mCherry can be evidenced by comparing the lifetime distributions of PAO1 expressing PvdI-eGFP versus PvdI-eGFP PvdA-mCherry (Fig. 3b) or by comparing their corresponding empirical cumulative distributions (Fig. 3d). FRET can also be evidenced by comparing the lifetimes averaged by cells (Fig. 3c). It seems unlikely that the mere exchange of eGFP for mCherry or mCherry for eGFP has such a dramatic effect on PvdA/PvdI interaction. Indeed, both strains retain the ability of producing PVD with similar efficiencies (although lower than that of the wild-type PAO1 (see Supplementary Fig. S1)). The apparent contradiction in the above findings can be reconciled if we consider the expression levels of the two proteins with an expression of PvdA-eGFP far higher than that of PvdI-eGFP (see Supplementary Fig. S3). It can then be envisioned that PvdA-eGFP used as a donor coexists as a minor fraction transferring energy to mCherry and a major fraction free of transfer, both forms exhibiting different fluorescence lifetimes. Because the time resolved fluorescence decay sums photons emitted by the different species, the resulting fluorescence decay of PvdA-eGFP–PvdI-mCherry will thus tend towards the decay of PvdA-eGFP as the relative amount of non-transferring PvdA-eGFP increases. In contrast, the fluorescence decay of cells co-expressing PvdI-eGFP and PvdA-mCherry will be shifted to lower lifetimes, as the less abundant PvdI-eGFP protein is transferring to the nearby PvdA-mCherry. To take this species mixture into account, fluorescence decays were fitted with a two-exponential component model in which the average lifetime is defined as a weighted sum of two decays according to:

To limit over-fitting and improve fitting convergence, the long-lived lifetime τ 2 was fixed at the 90th percentile of PvdA-eGFP or PvdI-eGFP lifetimes defined using a single exponential decay (2.25–2.30 ns), whereas the lifetime value of the fast decay τ 1 and the relative contribution of each component defined by α 1 and α 2 could float. For a two-component model α 2 = 1 − α 1 and 〈τ〉 can thus be rewritten as:

A successful fit procedure will converge toward 〈τ〉 by adjusting τ 1 and α 1 and will provide τ 1 and α 1 conditional probability distributions given the fixed τ 2 value. A plot of τ 1 as a function of α 1 can be drawn as a diagram to represent observations made over all fitted pixels. An estimation of the 2D density of the pixel spatial distribution in this plot provides an estimation of the average lifetime (center of the density map contour plot) but also the bivariate distribution of (τ 1, α 1) parameters. The distribution of (τ 1, α 1) measurements of PvdI-eGFP PvdA-mCherry was scattered with a significant part of the distribution showing shortened τ 1 as compared to PvdI-eGFP lifetime – with values ranging from about 2.2 ns down to 1.6 ns (Fig. 3e). This confirmed a pronounced energy transfer between the two fluorophores. The fraction of pixel decays better adjusted with a single exponential was only about 5% (Fig. 3e inset). These FLIM data clearly showed that PvdA is physically interacting with PvdI.
In sharp contrast, the distribution of (τ 1, α 1) parameters of PvdA-eGFP–PvdI-mCherry was mostly positioned in an area corresponding to an average lifetime of about 2.2 ns with τ 1 values about 2.1 ns (Fig. 3f). If an equimolar complex of PvdA and PvdI was formed, the two (τ 1, α 1) maps for PvdI-eFGP–PvdA-mCherry and PvdA-eGFP–PvdI-mCherry should look very similar, only being shifted along the α 1 axis due to the difference in the relative amount of energy transferring species. Indeed, if we consider the difference in the expression level of the two enzymes, almost all the PvdI molecules should be bound to PvdA (high value for α 1) while only a small fraction of PvdA should be bound to PvdI (low value of α 1) but in both cases τ 1 should not be affected because the structure of the interacting complex should remain the same. Our observations largely differed from this situation with τ 1 values being also affected. This difference is likely explained by the presence of multiple acceptors, further shortening the average lifetime according to:

in which n is the number of acceptors and k i and τ D, the rate of energy transfer and the donor lifetime, respectively. The short τ 1 values observed for PvdI-eGFP PvdA-mCherry (compare red contour lines in Fig. 3e and orange ones in Fig. 3f) are likely explained by the presence of the complexes of several PvdA-mCherry surrounding PvdI-eGFP in a range of distances compatible with FRET. One can thus infer that multiple PvdA-mCherry proteins are bound per PvdI-eGFP NRPS.
Taken together, these observations provide evidence for a physical interaction between PvdA and PvdI and suggest that multiple PvdA are bound to one molecule of PvdI.
PvdA interacts with PvdJ
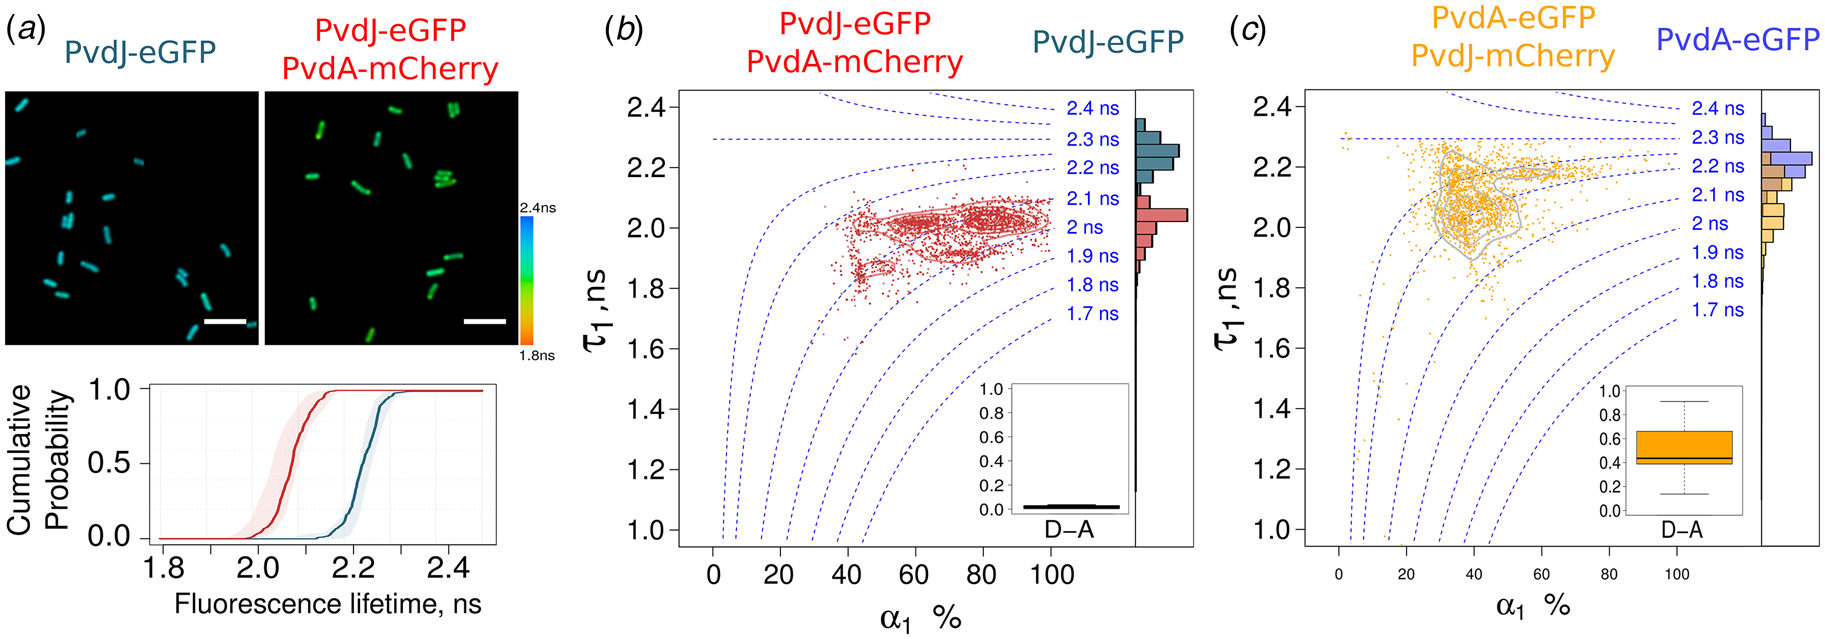
As PvdJ also contains a module responsible for the addition of L-fOH-Ornithine in the PVD peptide, we decided to monitor FLIM-FRET between PvdA and PvdJ (Fig. 4a). The lifetime of PvdJ-eGFP PvdA-mCherry estimated from a single exponential decay model was shortened by about 10–15% (2.0–2.1 ns) as compared to the PvdJ-eGFP fluorescence lifetime (Fig. 4a). As for PvdA–PvdI interaction, we could not define any preferential area where the interaction takes place. Using a two-exponential decay model, the fraction of decays better adjusted with a single exponential model was close to zero (Fig. 4b inset). The distribution of τ 1 was centered at about 2.0 ns and the amplitude of the short-lived component was representing about 60 to 80%. Interestingly, a similar τ 1 value was observed for the fraction of PvdA-eGFP molecules interacting with PvdJ-mCherry but associated with a α 1 value of ~40%. Therefore, the same τ 1 value observed for the both labeling schemes of the two enzymes. This strongly suggests the presence of a unique complex with a well-defined binding site for PvdA on PvdJ that governs the interaction. This conclusion is in line with a previous report showing by double-hybrid experiment that PvdA interacts with PvdJ M2 isolated module (Imperi and Visca, Reference Imperi and Visca2013) – the module responsible for incorporation of formyl-OHOrn (Fig. 1c). The high value of α 1 observed for PvdJ-eGFP PvdA-mCherry indicated that in the cellular context, the PvdA binding site of PvdJ is saturated with the ornithine hydroxylase. Unfortunately, we cannot infer from our data if it corresponds to a site with strong affinity and a long residence time of PvdA on PvdJ or to a situation of fast exchange of PvdA molecules on this binding site.
FRET-FLIM measurement of the PvdA–PvdJ interaction in live PAO1. (a) Representative FLIM images of PvdJ-eGFP and PvdJ-eGFP PvdA-mCherry strains. Using a single exponential analysis, a shortening of the lifetime of PvdJ-eGFP co-expressed with PvdA-mCherry is observed in live PAO1. The cumulative probability of the fluorescence lifetime of these two strains demonstrates the interaction of PvdA with PvdJ in live cells. (b) Density map with contour lines of (τ 1, α 1) fitting parameters of PvdJ-eGFP (grey) and PvdJ-eGFP PvdA-mCherry (red). (c) Density map with contour lines of (τ 1, α 1) fitting parameters of PvdA-eGFP (blue) and PvdA-eGFP PvdJ-mCherry (orange). (b) and (c) provide evidence for a major and possibly unique binding site for PvdA on PvdJ.

PvdA interacts with PvdL and PvdD in cells
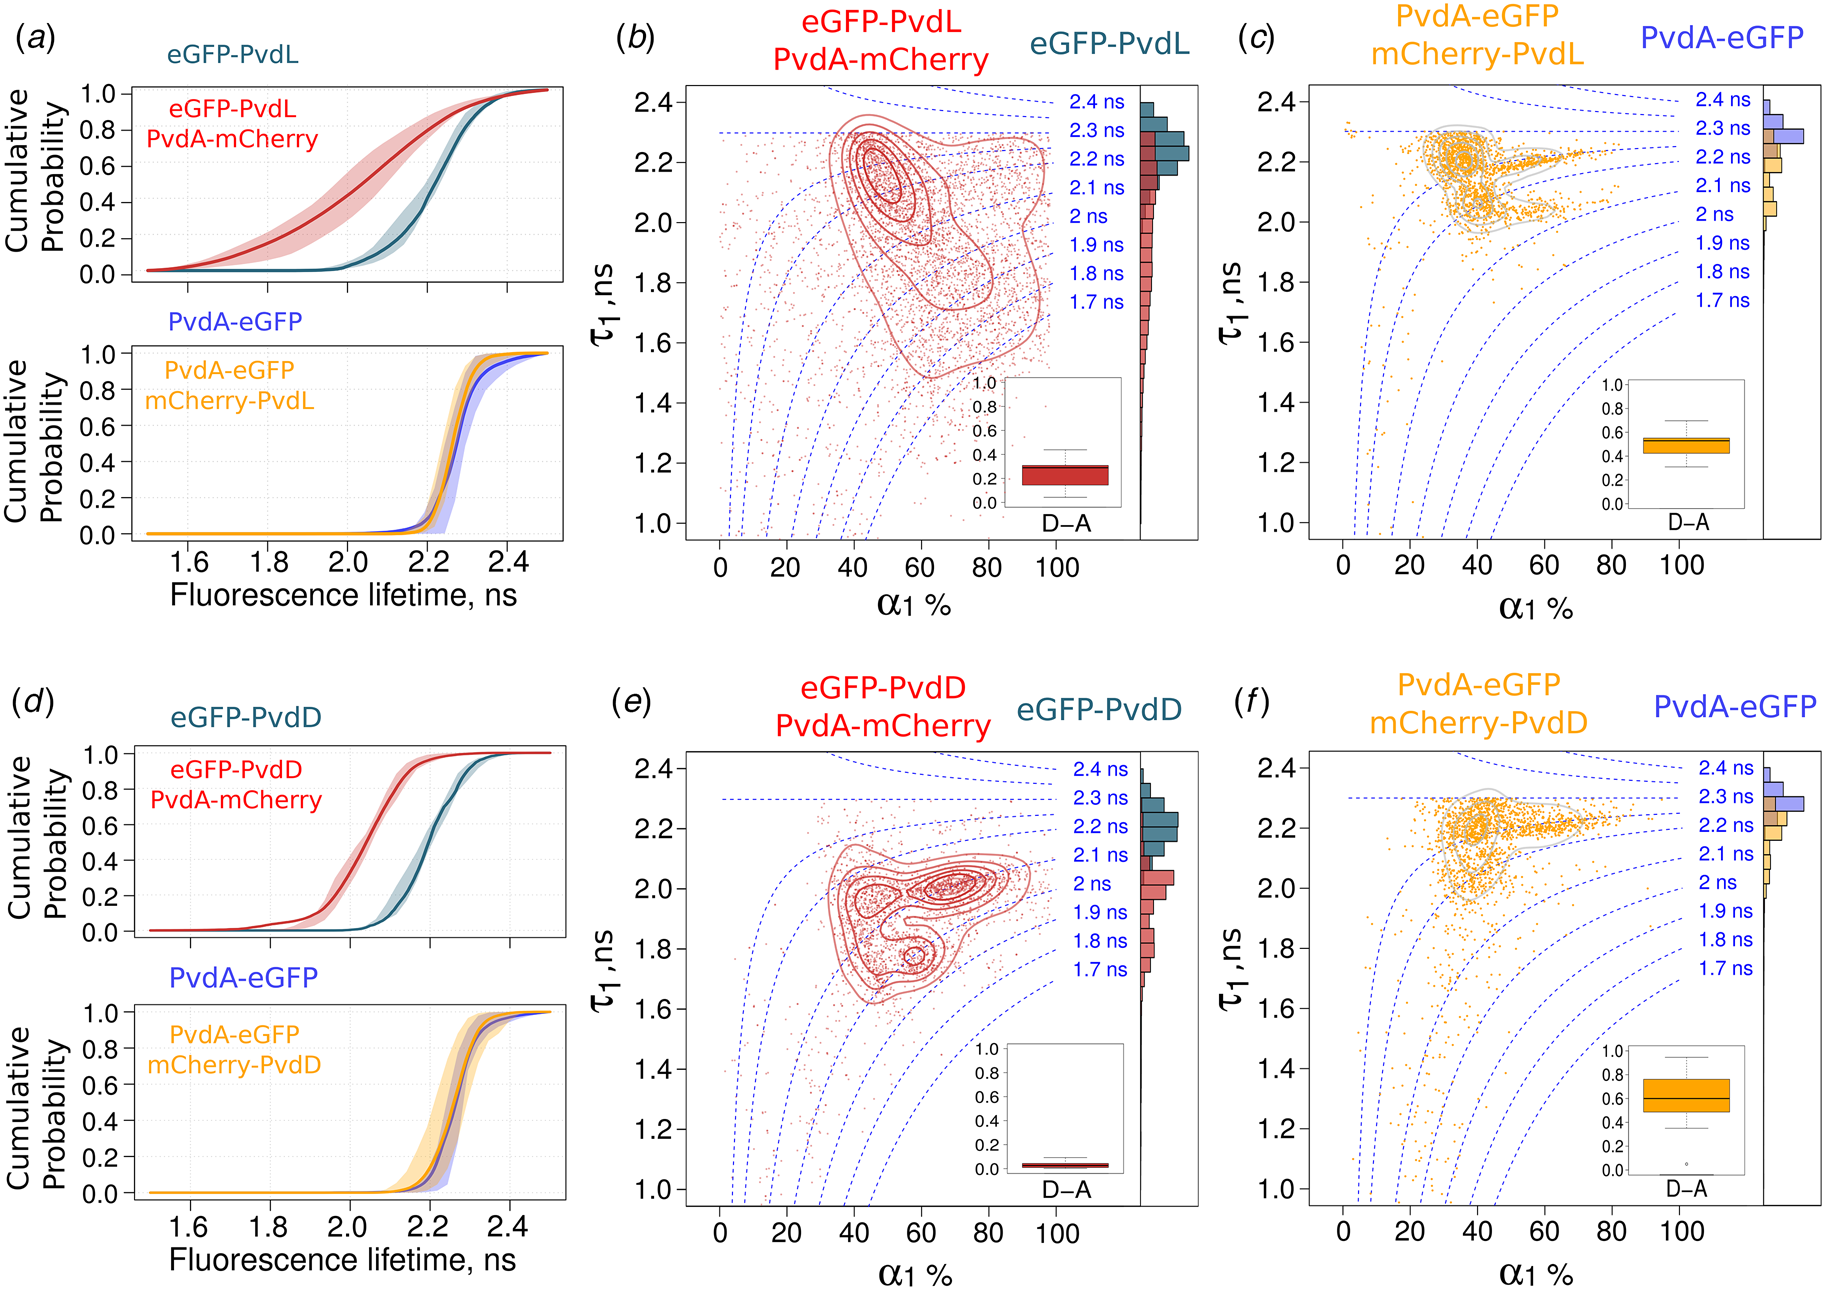
We further investigated the interaction of PvdA with PvdL (Fig. 5a–c) and PvdD (Fig. 5d–f). None of these two NRPSs are using PvdA product as a building block. We were nevertheless able to evidence physical interactions between PvdA and PvdL (Fig. 5a–c) and between PvdA and PvdD (Fig. 5d–e). It clearly appeared that the binding mode of PvdA to PvdL differed from the binding of PvdA to PvdD. It was also visible that results observed for PvdL (Fig. 5a–c) were very similar to that observed for PvdI (Fig. 3d–f). On the other hand, observations made for PvdD (Fig. 5d–f) were broadly like PvdJ (Fig. 4a–c) with a significant amount of interacting eGFP-PvdD characterized by a τ 1 value of about 2.0 ns – the same τ 1 value than that measured for the small fraction of PvdA-eGFP interacting with mCherry-PvdD Fig. 5f. But in contrast to PvdJ, a second binding site with a shorter τ 1 value (about 1.8 ns) was also present (Fig. 5e) – suggesting that PvdD can accommodate more than one PvdA protein.
FRET-FLIM measurement of the PvdA–PvdL and PvdA–PvdD interactions in live PAO1. Cumulative probability of the fluorescence lifetime of the PvdA–PvdL (a) and PvdA–PvdD complexes (d). Larger fluorescence lifetime decrease was observed when PvdL or PvdD was labelled with eGFP. Density map with contour lines of (τ 1, α 1) fitting parameters of (in B) eGFP-PvdL (grey) and eGFP-PvdL PvdA-mCherry (red) and (in C) PvdA-eGFP (blue) and PvdA-eGFP mCherry-PvdL (orange). Density map with contour lines of (τ 1, α 1) fitting parameters of (in e) eGFP-PvdD (grey) and eGFP-PvdD PvdA-mCherry (red) and (in f) PvdA-eGFP (blue) and PvdA-eGFP mCherry-PvdD (orange).

Discussion
In this work, we constructed PAO1 strains with modified genes coding for PvdA and NRPS fluorescent proteins (see Supplementary Table S1) inserted at the chromosomal level. These tagged enzymes retained the expression levels and functions of the endogenous ones (Gasser et al., Reference Gasser, Baco, Cunrath, August, Perraud, Zill, Schleberger, Schmidt, Paulen, Bumann, Mislin and Schalk2016). We used these strains to explore interactions between PvdA and the four NRPS responsible for the bio-synthesis of the PVD peptide backbone. We found that PvdA was not existing as a free protein in the cytoplasm but was engaged in large complexes. We inferred from FLIM data the physical interactions of PvdA with PvdI and PvdJ but also with PvdL and PvdD and demonstrated different binding modes of PvdA on the different NRPSs.
Based on the differences in FRET distributions between strains expressing PvdA tagged with the fluorescent donor (PvdA-eGFP) as compared to strains expressing PvdA tagged with the acceptor mCherry, we evidenced the simultaneous binding of multiple PvdA bound to several NRPSs and clearly distinguished this situation from complexes with 1:1 stoichiometry. Interestingly, the interaction of PvdA with PvdI and with PvdJ, the two NRPSs using fOHOrn as a building block, differed in extent and nature. The presence of several binding sites has to be considered to explain our FLIM observations with PvdI. The interaction of several PvdA with PvdI may fulfill the need for an excess of substrate locally available to optimize the activity of the PvdI enzyme. An unbalanced binding stoichiometry may also compensate fOHOrn dilution in the cell cytoplasm. On the contrary, a major binding site for PvdA was found on PvdJ. The M2 module previously identified by two-hybrid as an interacting partner of PvdA (Imperi and Visca, Reference Imperi and Visca2013) and responsible for fOHOrn insertion is a good candidate to harbor this binding site for PvdA. The difference in binding mechanism of the two NRPSs is striking if we consider that both PvdI and PvdJ require the action of PvdA. Since PvdL exhibits a global binding behavior very similar to PvdI, the molecular size of the NRPS could be an element explaining the binding mode – the larger the NRPS the higher the number of PvdA binding sites the enzyme can accommodate. Additional speculations can be made. For instance, a connection could be made between (i) the conserved position of fOH-Orn in the PVD sequence of Pseudomonas aeruginosa and (ii) the presence or not of a single or multiple binding sites. PVD production is a characteristic of the fluorescent pseudomonads. But Pseudomonas species produce slightly different PVDs. P. aeruginosa strains are able to produce three different PVDs, PVD I, PVD II and PVD III with a different peptide sequences. Amongst the PVD sequences of P. aeruginosa, the module 2 of PvdJ is well conserved and the fOHOrn is highly conserved at that position 9 in the PVD precursor sequence. On the contrary, the position where the fOHOrn is inserted by PvdI in the PVD precursor is more variable and corresponds either to module 2, 3 or 4 of PvdI in the different P. aeruginosa strains (Kilz et al., Reference Kilz, Lenz, Fuchs and Budzikiewicz1999; Meyer, Reference Meyer2000). In this context, evolving multiple binding sites outside the modules provides the necessary flexibility to ensure that the product produced by PvdA is available whatever the fOH ornithine module position within PvdI. It suggests additionally that rather than physical coordination between active sites of tailoring enzymes and NRPS modules, only co-localization of sequential enzymes seems to be enough to promote metabolic efficiency. Taken together, we can then envisage binding sites have co-evolved with module specificity.
Although we did not interrogate direct interactions between the different NRPS in this work, our findings provide strong evidence for siderosomes. Such organization has been previously hypothesized based on biochemical observations, but the difficulty to handle these complexes limits their explorations in vitro. The reversibility of spatial assemblies of sequential metabolic enzymes – proposed as a general mechanism to regulate metabolic activities – may explain why their in-vitro study remains extremely challenging. Our data demonstrate the possibility to capture rich information on protein–protein interactions which allows to directly characterize siderosomes in the cellular environment even if their formation is transient. This type of observation is susceptible to provide valuable data regarding the importance of maintaining effective protein–protein interactions in recombinant NRPS templates (Brown et al., Reference Brown, Calcott, Owen and Ackerley2018), or more generally recombinant metabolic machinery. But our work also raised some questions in particular regarding the slow diffusion of PvdA and the fraction with restrained diffusion. Does it correspond to complexes interacting with PvdE, the transporter responsible for the PVD precursor exports to the periplasm (Yeterian et al., Reference Yeterian, Martin, Guillon, Journet, Lamont and Schalk2010)? Are siderosomes interacting with the inner membrane and can they therefore be considered as metabolons? In both cases, the exploration of the possible additional regulation resulting from specific spatial partitioning within the bacterial cytoplasm will require three-dimensional multi-color explorations in the cellular context.
Taken together, our data clearly evidence that secondary metabolite pathways are much more organized than initially envisioned, with multiple interactions and multiple binding modes between accessory proteins and NRPSs. If clustering of all the PVD bio-synthesis machinery in a single complex is possibly increasing the synthesis efficiency, notably by sequestrating intermediate products, the understanding of how metabolic enzymes interact and coordinate with each other in space and time to ensure their metabolic functions is mostly at its infancy. But due to their non-vital nature and their experimentally tractable expression, siderosomes are good candidates to be used as model systems to demonstrate the functional significance of highly orchestrated enzyme organizations in the cellular context. Additional general knowledge gained from siderosome will likely contribute further to the general understanding of mechanisms ruling widespread metabolic pathways and cellular organizations.
Supplementary material
The supplementary material for this article can be found at https://doi.org/10.1017/S0033583519000155
Acknowledgements
We acknowledge Dr Ludovic Richert for his valuable assistance on FLIM data acquisition and for the technical maintenance and development of the FLIM setup.
Financial support
This work was funded by Fondation pour la Recherche en Chimie (https://icfrc.fr/). The funders had no role in study design, data collection, and interpretation, or the decision to submit the work for publication. YM is grateful to the Institut Universitaire de France (IUF) for support and providing additional time to be dedicated to research.
Conflicts of interest
Authors declare none.