1 Introduction
Although one of the oldest problems in fluid mechanics, roughness in turbulent flows remains an active area of research. The seminal works by Nikuradse (Reference Nikuradse1933) and Colebrook & White (Reference Colebrook and White1937), offering a systematic study of rough surfaces, set the foundations for the field. Based upon Nikuradse’s results on pipes roughened with sand of equal grain size, Schlichting (Reference Schlichting1936) introduced the concept of equivalent sand-grain size,
 $k_{s}$
, in order to classify rough surfaces. Surfaces with different roughness height
 $k$
that produce the same friction as a particular sand-grain size would share the same
 $k_{s}$
. However, there are two important shortcomings in this strategy. First, as stated by Bradshaw (Reference Bradshaw2000), it ‘simply defines a useful common currency for roughness size – like paper money, valueless in itself but normally acceptable as a medium of exchange’, i.e.
 $k_{s}$
is merely a classifier, an a posteriori parameter that is of limited use for prediction purposes. Second, Colebrook (Reference Colebrook1939) observed that, despite sharing the same value of
 $k_{s}$
in the fully rough regime, the ratio
 $k_{s}/k$
varies for a given surface along the transitionally rough regime. In other words, different surfaces depart from the hydraulically smooth regime differently. In figure 1, these differences are highlighted by using
 $k_{s_{\infty }}^{+}$
(Jiménez Reference Jiménez2004). In this figure, a roughness length scale
 $k_{s_{\infty }}$
, of fixed proportion to
 $k$
, is chosen so that in the fully rough regime
 $k_{s}=k_{s_{\infty }}$
and the roughness function
 $\unicode[STIX]{x0394}U^{+}$
depends only on
 $k_{s_{\infty }}^{+}$
. Figure 1 highlights that, while such length scale can collapse the results in the fully rough regime, differences can still be observed in the transitionally rough regime. It is also worth nothing that
 $k_{s_{\infty }}$
can only be obtained a posteriori from experimental or numerical results with varying
 $k_{s_{\infty }}^{+}$
. Many studies in recent years have aimed to find a suitable combination of parameters to describe roughness surfaces and predict their friction. Some authors have explored the effective slope, the solidity, as well as different moments of the roughness height, mainly the mean, the standard deviation and the skewness (Flack & Schultz Reference Flack and Schultz2010). On the simulation front, it has recently been proposed that
 $\unicode[STIX]{x0394}U^{+}$
can be calculated from direct numerical simulations (DNS) in minimal boxes, which reduces their cost significantly (Chung et al.
Reference Chung, Chan, MacDonald, Hutchins and Ooi2015; MacDonald et al.
Reference MacDonald, Chung, Hutchins, Chan, Ooi and García-Mayoral2017). Predictive models are also beginning to emerge. Yang et al. (Reference Yang, Sadique, Mittal and Meneveau2016) and Yang & Meneveau (Reference Yang and Meneveau2016) have recently proposed a model based on the flow sheltering by the roughness elements, capturing the behaviour of
 $k_{s}^{+}$
for a wide variety of roughness elements. In the transitionally rough regime, however, the gradual changes in the flow that lead to the eventual departure from hydraulically smooth friction have not been fully understood, and a quantitative account of the different
 $\unicode[STIX]{x0394}U^{+}$
observed for different surfaces with the same
 $k_{s_{\infty }}^{+}$
would be needed. The approach taken in this work is to understand the modifications produced on the flow by the roughness texture. As stated by Marusic et al. (Reference Marusic, McKeon, Monkewitz, Nagib, Smits and Sreenivasan2010), ‘without further theoretical advances, there is a risk of needing a catalogue of roughness results’.
Roughness function
 $\unicode[STIX]{x0394}U^{+}$
in the transitionally rough regime as a function of
 $k_{s_{\infty }}^{+}$
: ○, uniform sand (Nikuradse Reference Nikuradse1933); ▵, uniform packed spheres (Ligrani & Moffat Reference Ligrani and Moffat1986);
 $\cdots \cdots$
, galvanized iron; – – – –, tar-coated cast iron; — ⋅ —, wrought iron; ——, interpolation (Colebrook Reference Colebrook1939). Adapted from Jiménez (Reference Jiménez2004).

In the hydraulically smooth regime, roughness is of small size and has a negligible effect on the flow, causing no change in terms of wall friction. As a result, the flow is effectively equivalent to canonical smooth-wall turbulence. In the fully rough regime, on the other hand, roughness dominates. The friction coefficient becomes independent of viscosity and the roughness size determines the skin friction drag. Between these two regimes, in the so-called transitionally rough regime, both the viscous and the rough effects have comparable importance. Nikuradse (Reference Nikuradse1933) observed that sand-grain roughness was hydraulically smooth for
 $k_{s}^{+}<5$
, fully rough for
 $k_{s}^{+}>70$
and transitional between those extremes. However, Flack & Schultz (Reference Flack and Schultz2010) compiled experimental results for typologies of roughness other than sand-grain roughness, finding that the limits vary considerably. In particular, the literature shows the transitionally rough regime spanning
 $1.4{-}15<k_{s}^{+}<18{-}70$
. The lower bound of this regime has classically been seen as a threshold below which the surface completely behaves as hydraulically smooth. However, Bradshaw (Reference Bradshaw2000) proposes a gradual transition between these regimes, without a defined, hard boundary. A recent work by Thakkar, Busse & Sandham (Reference Thakkar, Busse and Sandham2018) also seems to point in this direction. The interest in transitional roughness resides in understanding the effects that small surface texture starts having on the flow; effects that, as size increases, will lead to the departure from its smooth-wall behaviour and eventually to the fully rough regime. This interest is also growing amongst the high-Reynolds-number community (Marusic et al.
Reference Marusic, McKeon, Monkewitz, Nagib, Smits and Sreenivasan2010). Apparently, smooth surfaces, with a well-controlled microtexture, may eventually enter the transitionally rough regime as viscous scales become sufficiently small for increasing Reynolds number.
Far enough above conventionally rough walls, the mean velocity profile exhibits the same logarithmic region found over smooth walls. Effectively, roughness only modifies the intercept of the logarithmic velocity profile, while the Kármán constant,
 $\unicode[STIX]{x1D705}$
, and the wake function are unaffected (Nikuradse Reference Nikuradse1933; Clauser Reference Clauser1956). In the logarithmic layer, the mean velocity profile,
 $U$
, can then be expressed as
 $$\begin{eqnarray}U^{+}=\unicode[STIX]{x1D705}^{-1}\ln (y^{+})+B+\unicode[STIX]{x0394}U^{+}=U_{0}^{+}+\unicode[STIX]{x0394}U^{+},\end{eqnarray}$$
where
 $B$
is the smooth-wall intercept of the logarithmic velocity profile. The roughness function,
 $\unicode[STIX]{x0394}U^{+}$
(Hama Reference Hama1954), depends on the roughness texture and its size. The 0 subscript denotes smooth-wall flow quantities. The
 $+$
superscript indicates scaling in wall units, with the friction velocity,
 $u_{\unicode[STIX]{x1D70F}}$
, and the kinematic viscosity,
 $\unicode[STIX]{x1D708}$
. The change in friction coefficient,
 $\unicode[STIX]{x0394}C_{f}$
, can be directly related to
 $\unicode[STIX]{x0394}U^{+}$
. At the centreline of a channel or at the edge of the boundary layer, denoted by the subscript
 $\unicode[STIX]{x1D6FF}$
, equation (1.1) becomes
 $$\begin{eqnarray}(2/C_{f})^{1/2}=U_{\unicode[STIX]{x1D6FF}}^{+}=U_{\unicode[STIX]{x1D6FF}_{0}}^{+}+\unicode[STIX]{x0394}U^{+}.\end{eqnarray}$$
From the above equation, the relative change in drag
 $\unicode[STIX]{x0394}C_{f}$
(Spalart & McLean Reference Spalart and McLean2011; García-Mayoral, Gómez-de-Segura & Fairhall Reference García-Mayoral, Gómez-de-Segura and Fairhall2019) is
 $$\begin{eqnarray}\frac{\unicode[STIX]{x0394}C_{f}}{C_{f_{0}}}=-\frac{1}{(1+\unicode[STIX]{x0394}U^{+}/U_{\unicode[STIX]{x1D6FF}_{0}}^{+})^{2}}-1.\end{eqnarray}$$
The above expression shows the dependence of the drag on the roughness function. Notice that
 $\unicode[STIX]{x0394}C_{f}/C_{f_{0}}$
also depends weakly on the Reynolds number through
 $U_{\unicode[STIX]{x1D6FF}_{0}}^{+}$
. Equation (1.3) shows that an increase in friction is accompanied by a downward displacement of the velocity profile towards the wall, and vice versa. In the context of drag reduction, for small
 $\unicode[STIX]{x0394}C_{f}$
, linearised forms of (1.3) have often been used (Luchini Reference Luchini1996; García-Mayoral & Jiménez Reference García-Mayoral and Jiménez2011a
). In this work, we characterise the change in drag using
 $\unicode[STIX]{x0394}U^{+}$
, rather than
 $\unicode[STIX]{x0394}C_{f}/C_{f_{0}}$
, to avoid the dependence on the Reynolds number mentioned above. Note also that in periodic, numerical channels, the drag force can only be defined unambiguously if the cross-sectional area is homogeneous (MacDonald et al.
Reference MacDonald, Ooi, García-Mayoral, Hutchins and Chung2018).
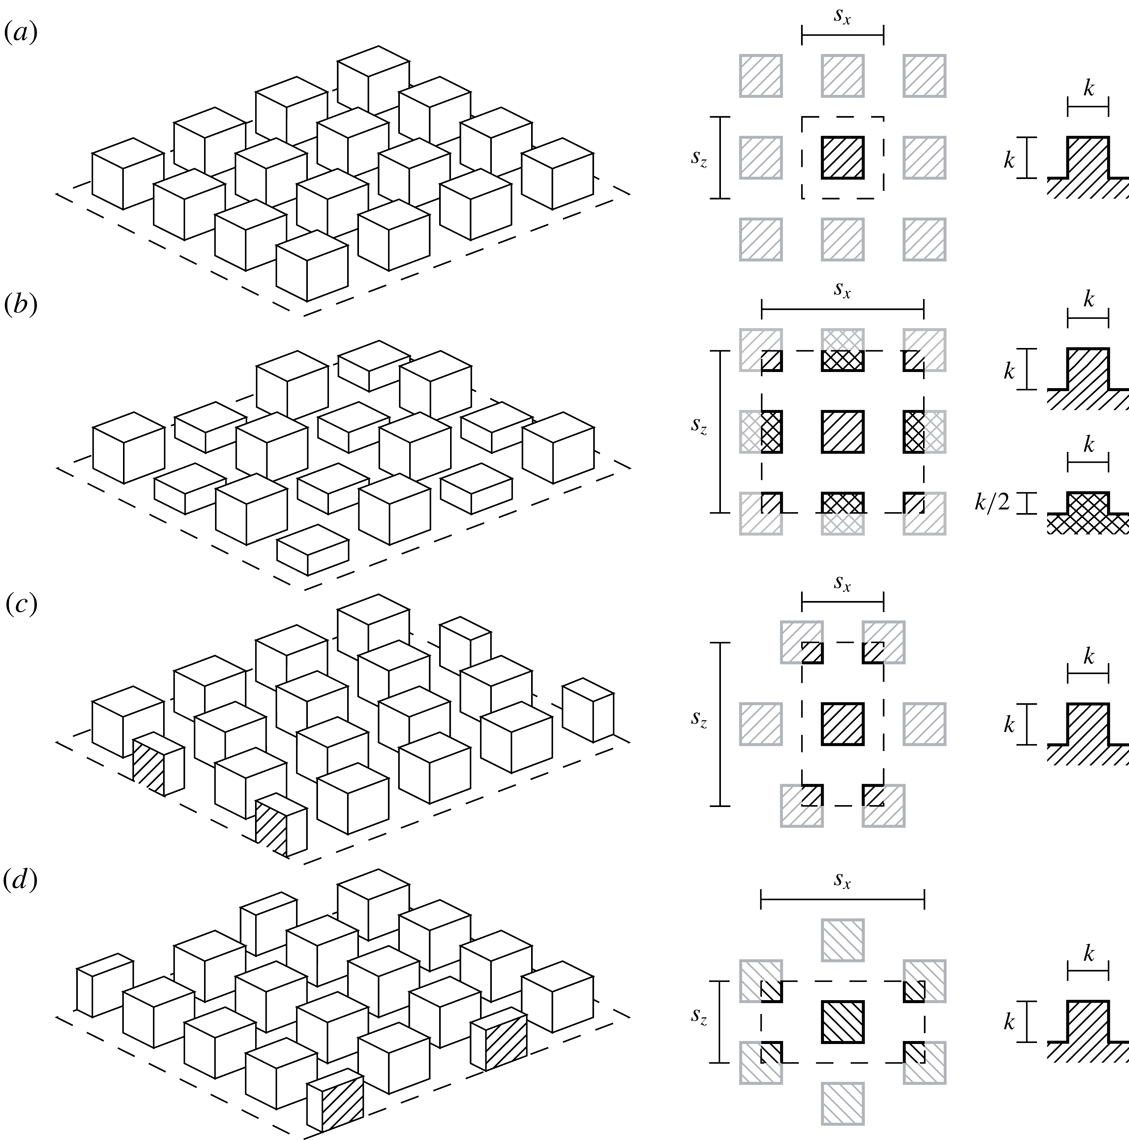
Schematics of the roughness patterns studied: (a) collocated; (b) collocated with two heights; (c) spanwise-staggered; and (d) streamwise-staggered. Left panels, three-dimensional representation of the roughness surface, where the mean flow is from bottom left to top right. Central panels, top view of a periodic unit element of the pattern. Right panels, side view of an isolated post; where the mean flow is from left to right.

In this work we explore the transitionally rough regime. The ultimate goal is to understand and predict the effect of transitionally rough surfaces on the flow. The range of roughness sizes covered is therefore small, but of more general relevance, as this regime marks the onset of the rough behaviour. To explore it, we conduct a campaign of DNS of turbulent channels. The channels are symmetric, with roughness on both walls. Four different geometries are considered, as depicted in figure 2. To explore the behaviour of each geometry, DNS are conducted for different values of
 $k$
, while their shape is kept fixed, also resulting in constant solidity and effective slope. These surfaces exhibit the classic
 $k$
-roughness behaviour, which is characteristic of most three-dimensional rough surfaces (Jiménez Reference Jiménez2004).
This paper is organised as follows. In § 2 the details of the numerical method are presented. A novel decomposition of the flow is presented in § 3 and it is used in §§ 4 and 5 to study the two components of the velocity. In § 6 the appearance of a shear-flow instability is discussed, and the relationship between the roughness function and the virtual origin of turbulence is analysed in § 7. The key conclusions are discussed in § 8.
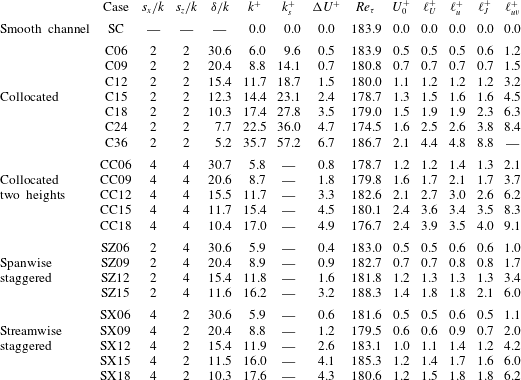
Main characteristics of the simulations. The roughness-element width and maximum height is
 $k$
, and the streamwise and spanwise pitches of the pattern are
 $s_{x}$
and
 $s_{z}$
. The half-height of the channel, measured from the roughness crests, is denoted by
 $\unicode[STIX]{x1D6FF}$
. The mean velocity at the roughness crests is
 $U_{0}$
;
 $\ell ^{+}$
denotes the depth of virtual origins, measured from the tips, as introduced in § 5, where
 $\ell _{U}^{+}$
refers to the virtual origin of the mean velocity profile;
 $\ell _{u}^{+}$
is the virtual origin of the streamwise r.m.s. fluctuations;
 $\ell _{J}^{+}$
is Jackson’s displacement height (Jackson Reference Jackson1981); and
 $\ell _{uv}^{+}$
refers to the virtual origin of the Reynolds shear stress.

2 Methodology
The numerical experiments are conducted in an incompressible, turbulent channel with roughness on the top and bottom walls. The domain is periodic in the wall-parallel directions. The channel half-height is
 $\unicode[STIX]{x1D6FF}$
measured from the roughness crests, and the length and width are
 $L_{x}=2\unicode[STIX]{x03C0}\unicode[STIX]{x1D6FF}$
and
 $L_{z}=\unicode[STIX]{x03C0}\unicode[STIX]{x1D6FF}$
, respectively. The streamwise, wall-normal and spanwise coordinates are
 $x$
,
 $y$
and
 $z$
, with
 $u$
,
 $v$
and
 $w$
the corresponding components of the velocity
 $\boldsymbol{u}$
. The origin of the wall-normal coordinate,
 $y=0$
, is set at the roughness crests of the bottom wall.
Table 1 includes the geometric parameters used in our simulations. Note that, although in this work
 $\unicode[STIX]{x1D6FF}$
only includes the height above the roughness crests, for the largest roughness cases studied, C24 and C36, the roughness-to-channel-height ratio is
 $\unicode[STIX]{x1D6FF}/k<10$
. Under these conditions, roughness can be expected to perturb the whole logarithmic region (Jiménez Reference Jiménez2004). Nevertheless, previous works have shown that such low
 $\unicode[STIX]{x1D6FF}/k$
produce acceptable results for the dynamics within the first few roughness heights above the surface and for the resulting
 $\unicode[STIX]{x0394}U^{+}$
(García-Mayoral & Jiménez Reference García-Mayoral and Jiménez2012; Chung et al.
Reference Chung, Chan, MacDonald, Hutchins and Ooi2015; MacDonald et al.
Reference MacDonald, Chung, Hutchins, Chan, Ooi and García-Mayoral2017). In all the present simulations, we observe that outer-layer similarity (Townsend Reference Townsend1976) is recovered no later than
 $y^{+}\approx 90$
.
The numerical method is adapted from that of García-Mayoral & Jiménez (Reference García-Mayoral and Jiménez2011b
) for riblet channels to simulate fully three-dimensional roughness and is briefly summarised here. The temporal integrator is a fractional-step method combined with a three-substep Runge–Kutta and with pressure correction at the final substep only (Le & Moin Reference Le and Moin1991; Perot Reference Perot1993). The spatial discretisation is pseudo-spectral. The two periodic directions,
 $x$
and
 $z$
, are discretised using Fourier series, while the wall-normal direction,
 $y$
, is discretised using a second-order finite-difference scheme in a collocated grid. The chequerboard effect, typical of collocated grids (Ferziger & Perić Reference Ferziger and Perić2002), is addressed using a quasi-divergence-free formulation (Nordström, Mattsson & Swanson Reference Nordström, Mattsson and Swanson2007; García-Mayoral & Jiménez Reference García-Mayoral and Jiménez2011b
). Near the walls, the high velocity gradients and the roughness texture require a high spatial resolution for the flow to be correctly resolved, while for the core of the channel, a coarser, less costly resolution would suffice. To alleviate the computational cost of the method while still resolving all scales, two strategies are implemented. Along the wall-normal direction the finite-difference discretisation allows for the grid to be stretched, with a higher density of points near the walls. Above the roughness, the wall-normal grid spacing is
 $\unicode[STIX]{x0394}y_{min}^{+}\approx 0.3$
at the roughness crests, and progressively grows to
 $\unicode[STIX]{x0394}y_{max}^{+}\approx 3.1$
at the centre of the channel. Within the roughness region, i.e. between roughness crests and troughs, the grid spacing is
 $\unicode[STIX]{x0394}y^{+}\approx 0.3$
. Additionally, to increase the
 $x$
and
 $z$
resolutions near the walls, the domain is vertically divided into three blocks. This multi-block technique allows a high number of grid points to be set near the walls, with a coarser resolution in the block resolving the core of the channel. In this latter region, the resolution is set to resolve all turbulent scales. In the blocks containing the walls, it is also necessary to resolve the flow around the roughness elements, which requires a higher resolution for small
 $k^{+}$
. The resolution in the central block is
 $\unicode[STIX]{x1D6E5}_{x_{c}}^{+}\approx 6$
and
 $\unicode[STIX]{x1D6E5}_{z_{c}}^{+}\approx 3$
along the
 $x$
and
 $z$
directions, respectively, while in the two wall blocks a finer resolution is used to represent each roughness element, with at least 12 points along
 $x$
and
 $z$
. The roughness elements are resolved using a direct-forcing immersed boundary method (Mohd-Yusof Reference Mohd-Yusof1997; Fadlun et al.
Reference Fadlun, Verzicco, Orlandi and Mohd-Yusof2000; Iaccarino & Verzicco Reference Iaccarino and Verzicco2003). The unit element is a cube of side
 $k$
, repeated along
 $x$
and
 $z$
on both walls. These unit elements are described using
 $12\times 12$
points for the cases with
 $k^{+}\lesssim 9$
,
 $24\times 24$
points for the cases with
 $12\lesssim k^{+}\lesssim 25$
, and
 $48\times 48$
points for the case with
 $k^{+}\approx 36$
. This choice results from the need to solve both the turbulent scales as well as the flow around the roughness elements while keeping a moderate computational cost. Note that, although the resolution for the smallest
 $k^{+}$
values is marginal, the simulations carried out by Thakkar et al. (Reference Thakkar, Busse and Sandham2018) on random roughness, performed using a 12 point-per-element discretisation, are in good agreement with experimental results.
The simulations are conducted at constant mass flow rate, which is adjusted to achieve a friction Reynolds number
 $Re_{\unicode[STIX]{x1D70F}}\approx 185$
for all simulations;
 $Re_{\unicode[STIX]{x1D70F}}$
is computed using
 $\unicode[STIX]{x1D6FF}^{\prime }=\unicode[STIX]{x1D6FF}+\ell _{U}$
, where
 $\ell _{U}$
is the virtual origin of the mean velocity profile, i.e. where the mean velocity profile tends to zero when extrapolated from
 $y>0$
. The friction velocity
 $u_{\unicode[STIX]{x1D70F}}$
is obtained by extrapolating the total shear stress to
 $\unicode[STIX]{x1D6FF}^{\prime }$
. Statistically converged initial conditions are obtained by simulating and discarding the flow during
 $10\unicode[STIX]{x1D6FF}/u_{\unicode[STIX]{x1D70F}}$
. Statistics are then collected over at least
 $15\unicode[STIX]{x1D6FF}/u_{\unicode[STIX]{x1D70F}}$
. Relevant parameters and results of the simulations are given in table 1.
3 Flow decomposition
In the proximity of the wall, roughness induces fluctuations that alter, and even destroy, the near-wall cycle (Jiménez Reference Jiménez2004). The intensity of these fluctuations decreases exponentially away from the surface, and they are generally considered to be confined within a region near the wall of height
 ${\sim}3k$
, known as the roughness sublayer (Raupach, Antonia & Rajagopalan Reference Raupach, Antonia and Rajagopalan1991; Flack, Schultz & Connelly Reference Flack, Schultz and Connelly2007). In this region the fluctuations induced by roughness cannot be neglected and their effect is noticeable in the flow. These roughness-coherent fluctuations are of the same order of magnitude as the background turbulence fluctuations, leaving their footprint on the velocity field and the energy spectrum.
Instantaneous realisation of the streamwise velocity, for case C06, at
 $y^{+}=0.3$
, in a section of constant
 $z^{+}$
through the middle of a row of posts: (a) —— (black), full signal; – – – – (black), background turbulent component; —— (red), ensemble average over time and over the relative position in the periodic unit of texture; (b) —— (red), full signal minus the ensemble average; – – – – (black), background turbulence; (c) —— (black), low-pass-filtered full signal; —— (red), difference between the latter and the full signal. The left panels represent the signals in physical space, and the right panels those in Fourier space, where
 $\unicode[STIX]{x1D6FC}$
is the wavenumber.

In the roughness sublayer the flow can be thought of as formed of a roughness-coherent component, which is coherent in time and space with the roughness surface, and a background-turbulent component of a chaotic nature. This is analogous to the decomposition from Reynolds & Hussain (Reference Reynolds and Hussain1974) into a coherent and a turbulent component. To illustrate this concept, figure 3(a i) displays an instantaneous realisation of the streamwise velocity close to the roughness crests. We observe two contributions. The first, with longer wavelengths, has a characteristic length scale of the order of turbulent eddies. The second, whose dominant wavelength is that of the roughness texture, smaller than the overlying eddies, can be obtained by ensemble averaging over time and over the relative position in the periodic unit of texture. If the roughness-coherent component is subtracted from the full velocity, as in figure 3(b i), we observe that the footprint of the roughness elements does not completely disappear. The reason can be explained by means of their corresponding Fourier transform, shown in figures 3(a ii) and 3(b ii). The ensemble average is composed of the wavelength of the texture and its subharmonics. The full velocity exhibits these same wavelengths, induced by the texture; however, they are modulated in amplitude and thereby surrounded by energy in the neighbouring wavelengths. When the ensemble average is subtracted from the full velocity, the most energetic part, which corresponds to the wavelength of the texture and its subharmonics, is removed, but all the energy neighbouring these wavelengths is not, failing to remove the footprint as observed in figure 3(b i). In figures 3(c i) and 3(c ii) we set a threshold to identify what wavelengths correspond to background turbulence and thus what the remainder represents in physical space. The wavelengths are then divided into long and short ones. In figure 3(c i), we observe that the contribution from long wavelengths closely resembles smooth-wall turbulence. Wavelengths shorter than those of turbulence are similar to the ensemble average, shown in figure 3(a i), but they appear to be modulated in amplitude by the overlying, long-wavelength signal of the background turbulence.
Following the above analysis, in Abderrahaman-Elena & García-Mayoral (Reference Abderrahaman-Elena and García-Mayoral2016) we proposed that the flow over a roughness texture of small size is not simply the sum of the ensemble average plus a turbulent component. Instead, the roughness-coherent flow is modulated by the overlying turbulence. For a particular roughness size, inducing a coherent flow
 $u_{RC,u}$
, and with a background turbulence
 $u_{BT}$
, the instantaneous velocity can intuitively be modelled as
 $$\begin{eqnarray}u\approx U+u_{BT}+\frac{U+u_{BT}}{U}u_{RC,u},\end{eqnarray}$$
where
 $U$
is the temporal and
 $x$
–
 $z$
spatial averaged streamwise velocity.
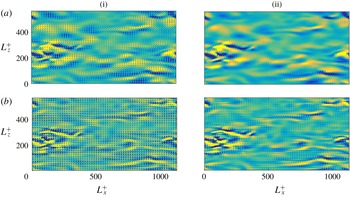
Instantaneous streamwise velocity at a distance
 $y^{+}\approx 0.3$
above the roughness crests, for case C09. (a) Full signal. (b) Turbulent contribution obtained using triple decomposition,
 $u{-}U{-}u_{RC,u}$
. (c) Turbulent contribution obtained using (3.1).

Equation (3.1) can also be inferred by considering small roughness in the viscous limit. In the spirit of Luchini, Manzo & Pozzi (Reference Luchini, Manzo and Pozzi1991), the vanishingly small roughness limit reduces the problem to a shear-driven, purely viscous flow, which results in a self-similar solution that scales with
 $k$
and with the overlying shear, proportional to
 $U+u_{BT}$
.
The triple decomposition proposed by Reynolds & Hussain (Reference Reynolds and Hussain1974) is similar to (3.1) except for the amplitude modulation by
 $U+u_{BT}$
. The triple decomposition has been widely used to characterise the texture-coherent flow in turbulence over a variety of complex surfaces (Choi, Moin & Kim Reference Choi, Moin and Kim1993; Jiménez et al.
Reference Jiménez, Uhlmann, Pinelli and Kawahara2001; García-Mayoral & Jiménez Reference García-Mayoral and Jiménez2011b
; Jelly, Jung & Zaki Reference Jelly, Jung and Zaki2014; Seo, García-Mayoral & Mani Reference Seo, García-Mayoral and Mani2015). However, if we are to study the modifications in the background turbulence, the modulation of the roughness-coherent component needs to be accounted for. Figure 4(a) shows the streamwise velocity above the roughness crests within the roughness layer, where the coherent signal of the roughness elements is strong. If the ensemble average, the roughness-coherent contribution, is subtracted we observe in figure 4(b) that, although reduced, the footprint of the surface texture remains. However, when we account for the modulation of the coherent flow, using (3.1), the signature of the roughness-coherent flow on the background turbulence is substantially weaker, as shown in figure 4(c), where it is negligible.
The instantaneous overlying flow induces around roughness elements a velocity field with components in all three directions. At the same time, the background turbulent flow has components in all three directions, so for instance the spanwise background shear induces a texture-coherent cross-flow. Hence, the three velocity components have a roughness contribution induced by all components of the overlying flow. Let us take the streamwise velocity signal as an example. It would have contributions from the mean streamwise velocity,
 $U$
, the background-turbulent (BT) streamwise component,
 $u_{BT}$
, a roughness-coherent (RC) component,
 $u_{RC,u}$
, driven and modulated by
 $U+u_{BT}$
, and a roughness-coherent component,
 $u_{RC,w}$
, driven and modulated by the background-turbulent spanwise component,
 $w_{BT}$
. The simplified model presented in (3.1) can then be extended to all components of the full velocity,
 $$\begin{eqnarray}\displaystyle & \displaystyle u\approx U+u_{BT}+\frac{U+u_{BT}}{U}u_{RC,u}+\frac{w_{BT}}{\widetilde{w}}u_{RC,w}+\frac{v_{BT}}{\widetilde{v}}u_{RC,v}, & \displaystyle\end{eqnarray}$$
 $$\begin{eqnarray}\displaystyle & \displaystyle w\approx w_{BT}+\frac{U+u_{BT}}{U}w_{RC,u}+\frac{w_{BT}}{\widetilde{w}}w_{RC,w}+\frac{v_{BT}}{\widetilde{v}}w_{RC,v}, & \displaystyle\end{eqnarray}$$
 $$\begin{eqnarray}\displaystyle & \displaystyle v\approx v_{BT}+\frac{U+u_{BT}}{U}v_{RC,u}+\frac{w_{BT}}{\widetilde{w}}v_{RC,w}+\frac{v_{BT}}{\widetilde{v}}v_{RC,v}, & \displaystyle\end{eqnarray}$$
Instantaneous realisation for case C09. (a) Spanwise velocity, at
 $y^{+}\approx 0.3$
, above the roughness crests. (b) Wall-normal velocity at
 $y^{+}\approx 1$
. Left panels, full signals; right panels, turbulent contributions obtained using (3.2).

where
 $u_{RC,w}$
is the roughness-coherent streamwise velocity induced by the overlying, background spanwise shear of
 $w_{BT}$
, etc. Note that, while the modulating signal
 $U+u_{BT}$
is always positive,
 $w_{BT}$
and
 $v_{BT}$
can be either positive or negative, and, due to symmetry, their mean values cancel out. To obtain a measure of the intensity of these components,
 $\widetilde{w}$
and
 $\widetilde{v}$
denote the conditional averages of
 $w$
and
 $v$
, which account for their mean direction over individual roughness elements, such that they are only included into the average when they are positive (García-Mayoral & Jiménez Reference García-Mayoral and Jiménez2011b
). In the cube roughness geometries studied in this work, we observe no significant flow induced by
 $v$
in the streamwise and spanwise directions, although the corresponding terms have been included in (3.2) for completeness. In textures with inclined planes, such as pyramids or cones, for instance, we would expect these contributions,
 $u_{RC,v}$
and
 $w_{RC,v}$
, to be relevant. Also, the principal directions of the surfaces studied in the present work are aligned with
 $x$
and
 $z$
. In a more general case, the tensorial relationship between the driving mean pressure gradient and the resulting mean flow (Kamrin, Bazant & Stone Reference Kamrin, Bazant and Stone2010; Luchini Reference Luchini2013) would cause the latter to have a component in
 $z$
. This would introduce additional terms in the decomposition of (3.2), but would not alter its spirit. The effect would be small in irregular surfaces with no clear preferential directions, but could be important in patterned surfaces.
Figures 4 and 5 show instances of all three velocity components and their corresponding turbulent contributions, obtained by removing the roughness-coherent terms following (3.2). The present decomposition, accounting for the modulation of the overlying turbulence, reduces significantly the signature of the roughness-coherent flow. The remaining signature is overall much weaker than in the full signal, and is mostly prevalent in
 $v_{BT}$
. For
 $u_{BT}$
, our results show essentially no footprint of the texture, even for the larger
 $k^{+}$
studied. In any event, the decomposition is based on a fundamentally linearised approach, assuming that the roughness length scales are much smaller than those over which the background overlying shear varies (Zhang & Chernyshenko Reference Zhang and Chernyshenko2016), and can be expected to fail eventually as
 $k^{+}$
increases.
The modulation of the roughness-coherent flow by the background turbulence is analogous to the modulation of near-wall turbulence by the outer-layer dynamics (Mathis, Hutchins & Marusic Reference Mathis, Hutchins and Marusic2009). Zhang & Chernyshenko (Reference Zhang and Chernyshenko2016) have recently revisited this problem, and propose a formulation similar to (3.2). Also recently, Anderson (Reference Anderson2016) observed that the modulation of near-wall turbulence is present in flows over rough surfaces. In our DNS,
 $Re_{\unicode[STIX]{x1D70F}}$
is not sufficiently high to reproduce large-scale dynamics, so the background turbulence is essentially that of near-wall, small-scale dynamics. The larger scales would be significant at higher
 $Re_{\unicode[STIX]{x1D70F}}$
and if the simulation domain was sufficiently large (Flores & Jiménez Reference Flores and Jiménez2010). In such case, we could expect a cascading modulation, where large scales modulate small scales in the background turbulence, and the full background turbulence modulates the texture-coherent flow.
Premultiplied energy spectra of the full velocity signal and its background turbulent component,
 $k_{x}k_{z}E_{uu}^{+}$
,
 $k_{x}k_{z}E_{vv}^{+}$
and
 $k_{x}k_{z}E_{ww}^{+}$
, and cospectrum of the Reynolds stress,
 $k_{x}k_{z}E_{uv}^{+}$
, for case C06, at
 $y^{+}=2$
for
 $v$
and
 $y^{+}=0.5$
for the rest.

Premultiplied energy spectra of the full velocity signal and its background turbulent component,
 $k_{x}k_{z}E_{uu}^{+}$
,
 $k_{x}k_{z}E_{vv}^{+}$
and
 $k_{x}k_{z}E_{ww}^{+}$
, and cospectrum of the Reynolds stress,
 $k_{x}k_{z}E_{uv}^{+}$
, for case C18, at
 $y^{+}=2$
for
 $v$
and
 $y^{+}=0.5$
for the rest.

Beyond instantaneous realisations, the spectral densities of the different flow variables provide quantitative, statistical evidence to evaluate the proposed decomposition. Figures 6 and 7 show premultiplied spectra and cospectra of the full velocity, as well as those of the background turbulence variables, for a roughness of
 $k^{+}\approx 6$
and one of
 $k^{+}\approx 18$
, with
 $s_{x}^{+}=s_{z}^{+}\approx 12$
and 36, respectively. The full flow signals exhibit a large spike at the wavelengths of the texture,
 $s_{x}$
and
 $s_{z}$
, as well as its corresponding subharmonics. However, the surrounding wavelengths also contain a substantial amount of energy, in a similar fashion to the effect observed in figure 3 in one dimension. These regions are the signature of the amplitude modulation of the roughness-coherent flow. Using the classical triple decomposition, without the modulation of the roughness-coherent component, removes the wavelength of the texture only, as shown in figure 3(b ii). In addition to the wavelengths of the roughness-coherent flow and the background turbulence, we observe very elongated regions with the wavelength of the roughness in
 $z$
and the range of wavelengths of the background turbulence in
 $x$
, or vice versa. These are the signature of cross-terms BT–RC in equation (3.2). Let us take for instance the term
 $u_{BT}u_{RC,u}$
, which essentially arises from the interaction of overlying streaks with the texture. In figure 4(a), it can be observed that the region of high
 $u$
corresponding to a streak is broken down by the canyons formed by the roughness, so that within the footprint of the streak there are streamwise-aligned, alternating stripes of high and low
 $u$
. The signature of this in spectral space will have the streamwise wavelength of streaks, but the spanwise wavelength of the texture.
For small roughness textures, as in figure 6, the scale separation between the turbulent and roughness contributions is large enough that they can essentially be extracted by Fourier filtering. We exploited this in the example shown in figures 3(c i) and 3(c ii). However, for larger
 $k^{+}$
, as shown in figure 7, the elongated regions mentioned above overlap with the turbulent contribution, which makes a pass-band filter ill-suited. Nevertheless, equations (3.2), interpreted as a filter, provide a tool to extract the turbulent contribution when Fourier filtering is not possible due to an overlap of wavelengths. In § 5 this decomposition is used to extract the background turbulence component and analyse the effects of roughness on it. Before that, in § 4, the roughness-coherent contribution is characterised, and a model to predict it is proposed.
4 The roughness-coherent component
In smooth walls, the mean velocity is a function of the wall-normal coordinate alone. However, in rough surfaces, we can define a time-averaged mean velocity that not only depends on
 $y$
, but is also a function of the
 $x$
and
 $z$
coordinates. This space-dependent mean flow minus the conventional mean velocity,
 $U(y)$
, is the roughness-coherent contribution introduced in the previous section, which is steady and coherent in space with the roughness texture. If we focus on individual roughness elements, the coherent flow can be thought of as the flow around the obstacles of the roughness geometry driven by the overlying shear. As the flow is deflected from and surrounds the obstacles, it generates a three-dimensional velocity field. The roughness-coherent component can be obtained by averaging the flow in time. Since all geometries in the present work are made up of a periodic pattern, the roughness-coherent contribution will also be periodic, with the same wavelength as the roughness texture. This contribution is therefore obtained by ensemble averaging over time and over the periodic texture units as in Seo et al. (Reference Seo, García-Mayoral and Mani2015).
The coherent flow thus obtained decays above the roughness crests with height. In all our cases, the roughness-coherent components of the velocity have heavily decayed at a distance of
 ${\sim}k$
, shorter than the commonly accepted height of the roughness sublayer,
 ${\sim}3k$
(Raupach et al.
Reference Raupach, Antonia and Rajagopalan1991; Flack et al.
Reference Flack, Schultz and Connelly2007). The root mean square (r.m.s.) of the roughness-coherent components of the velocity, whose squares are commonly referred to as dispersive stresses (Raupach & Shaw Reference Raupach and Shaw1982), are depicted in figure 8 for several roughness textures and sizes. The decay is of the form
 ${\sim}\exp (-y/k)$
and is observed to scale with the roughness height,
 $k$
, rather than the spacing,
 $s$
. The rate of decay is observed to be different for the three velocities, and is fastest for
 $u$
and slowest for
 $v$
. For all DNS, the magnitude of the fluctuations, and in particular that of the wall-normal component, is below 2 % of
 $u_{\unicode[STIX]{x1D70F}}$
at one roughness height above the roughness crests. These results are consistent with experiments, where dispersive stresses are found to vanish at
 $y\approx k$
(Cheng & Castro Reference Cheng and Castro2002; Florens, Eiff & Moulin Reference Florens, Eiff and Moulin2013).
R.m.s. of the roughness-coherent velocity components above the roughness crests: —— (blue), collocated posts; —— (green) spanwise-staggered posts; —— (purple) streamwise-staggered posts; —— (red), collocated posts of two heights. The reference lines, – – – –, have slopes of
 $1.5\unicode[STIX]{x03C0}$
,
 $1\unicode[STIX]{x03C0}$
and
 $1.25\unicode[STIX]{x03C0}$
, respectively.

For vanishingly small
 $k$
, the roughness-coherent flow can be thought of as the flow induced around the roughness elements driven by a steady, homogeneous overlying shear. This concept was already used by Luchini et al. (Reference Luchini, Manzo and Pozzi1991), where they considered riblets of a vanishingly small size, so that they perceive the overlying turbulence as steady and homogeneous. Notice that, for small roughness, in the transitionally rough regime, the time scales and length scales of the overlying background-turbulent fluctuations are much larger than those of roughness. These latter fluctuations are quasi-steady and quasi-homogeneous with respect to the characteristic scales of the surface, i.e. they vary slowly and over long distances. The concept of a quasi-steady, quasi-homogeneous limit was formalised by Zhang & Chernyshenko (Reference Zhang and Chernyshenko2016) for the interaction between the overlying large scales of the outer region and the smaller and faster near-wall fluctuations, and a similar framework would apply here.
Wall-normal velocity for cases (a) C09, (b) C18 and (c) C24. Shaded, roughness-coherent contribution from DNS; contours, steady laminar model. Red and solid indicate positive values; blue and dashed indicate negative values.

R.m.s. of the roughness-coherent contribution for the collocated and streamwise-staggered roughness. Solid, results from DNS; dashed, results from the laminar model simulations. Blue to red, cases C06 to C18 (a–c) and SX06 to SX18 (d–f).

(a) Mean streamwise velocity at the roughness crests. (b) Maximum streamwise roughness-coherent velocity as a function of the mean streamwise velocity at the roughness tips. Symbols: ●, collocated posts; ♦, spanwise-staggered posts; ▴, streamwise-staggered posts; ▪, collocated posts of two heights. Empty symbols correspond to estimations from the laminar model. Linear regression with slopes 0.82 (– – – –) and 0.47 (— ⋅ —).

The roughness-coherent flow for small
 $k^{+}$
, as suggested above, can be modelled as the flow induced by a steady and homogeneous overlying background flow. Therefore, to approximate the roughness-coherent contribution, we conduct steady, laminar simulations using the numerical methodology described in § 2, but where the periodic domain only contains one texture element. The mean shear and viscosity are adjusted to match the same
 $k^{+}$
of the corresponding DNS. For small but finite values of
 $k^{+}$
, these numerical domains are too small to sustain turbulence (Jiménez & Moin Reference Jiménez and Moin1991), and result in laminar, steady flows, which provide estimates of the roughness-coherent contribution. For instance, figure 9 compares the wall-normal roughness-coherent velocity obtained from the DNS by ensemble averaging to the laminar model. Laminar simulations begin to deviate for the intermediate case, C18, but they still exhibit good qualitative agreement for the larger case, C24. Notice that, even for the smallest
 $k^{+}$
, the flow is not symmetric and does not behave as purely viscous. It is therefore necessary to consider the advective terms, in contrast with the Stokes-flow analysis of Luchini et al. (Reference Luchini, Manzo and Pozzi1991). This model also allows us to predict the r.m.s. fluctuations of the roughness-coherent flow. Figure 10 depicts data from our DNS compared against those from the laminar model, and shows good agreement for
 $k^{+}\lesssim 15$
for all our roughness surfaces. Notice that this method can also be used to estimate properties of the mean velocity profile close to the rough surface, such as the mean streamwise velocity at the roughness crests, by averaging along the
 $x$
and
 $z$
directions, as shown in figure 11.
5 The background turbulence component
Roughness does not only excite the wavelengths of the surface texture, but also modifies the background turbulence. This can be observed in the r.m.s. fluctuations that incorporate effects from both the roughness contribution, studied in the previous section, and the background turbulence. The streamwise r.m.s. fluctuations, shown in figure 12, decrease in the near-wall region, with the peak of intensity lowering as the roughness size increases, while a significant growth occurs at the roughness crests in a similar fashion to that in figure 10. The decrease in the peak of intensity can only be caused by a decrease, and therefore modification, of the r.m.s. fluctuations of the background-turbulent component. This decrease is consistent with the destruction of the near-wall peak of intensity of the streamwise r.m.s. fluctuations observed in the fully rough regime (Ligrani & Moffat Reference Ligrani and Moffat1986). The wall-normal and spanwise r.m.s. fluctuations present an increase of intensity across the entire roughness sublayer, from the roughness crests to their near-wall intensity peak. The near-wall intensity peak of the streamwise vorticity fluctuation also increases, save for the largest case, which flattens in magnitude and almost disappears, this being a symptom of roughness altering the near-wall cycle. Notice that these modifications of the r.m.s. fluctuations extend to a distance of
 ${\sim}2k$
, larger than the decay distance of the roughness-coherent signal observed in the previous section. However, beyond that distance, the r.m.s. fluctuations resemble those in smooth-wall turbulence, in agreement with the outer-layer similarity hypothesis (Townsend Reference Townsend1976).
Full r.m.s. fluctuations. Blue to red, cases C06 to C36; black, smooth channel. The arrows indicate increasing roughness size. (a) Streamwise, wall-normal and spanwise velocity fluctuations; (b) Reynolds stress; (c) streamwise vorticity fluctuations.

In this section, we analyse the effect of roughness on the background turbulence and, in particular, on the r.m.s. fluctuations. The r.m.s. fluctuations of the full signal, as shown in figure 12, contain contributions from both the turbulent-background and roughness-coherent components. However, the decomposition of (3.2) can be used to derive approximate expressions for the r.m.s. velocities from which the r.m.s. fluctuations of the background turbulence can be extracted. For the geometries studied in this paper, the leading terms are
 $$\begin{eqnarray}\displaystyle \langle u^{\prime 2}\rangle & = & \displaystyle \langle u_{BT}^{2}\rangle +\langle u_{RC,u}^{2}\rangle \nonumber\\ \displaystyle & & \displaystyle +\,\langle u_{RC,u}^{2}\rangle \left\langle \frac{u_{BT}^{2}}{U^{2}}\right\rangle +\langle u_{RC,v}^{2}\rangle \left\langle \frac{v_{BT}^{2}}{\widetilde{v}^{2}}\right\rangle +\langle u_{RC,w}^{2}\rangle \left\langle \frac{w_{BT}^{2}}{\widetilde{w}^{2}}\right\rangle ,\end{eqnarray}$$
 $$\begin{eqnarray}\displaystyle \langle v^{\prime 2}\rangle & = & \displaystyle \langle v_{BT}^{2}\rangle +\langle v_{RC,u}^{2}\rangle \nonumber\\ \displaystyle & & \displaystyle +\,\langle v_{RC,u}^{2}\rangle \left\langle \frac{u_{BT}^{2}}{U^{2}}\right\rangle +v_{RC,v}^{2}\left\langle \frac{v_{BT}^{2}}{\widetilde{v}^{2}}\right\rangle +v_{RC,w}^{2}\left\langle \frac{w_{BT}^{2}}{\widetilde{w}^{2}}\right\rangle ,\end{eqnarray}$$
 $$\begin{eqnarray}\displaystyle \langle w^{\prime 2}\rangle & = & \displaystyle \langle w_{BT}^{2}\rangle +\langle w_{RC,u}^{2}\rangle \nonumber\\ \displaystyle & & \displaystyle +\,\langle w_{RC,u}^{2}\rangle \left\langle \frac{u_{BT}^{2}}{U^{2}}\right\rangle +\langle w_{RC,v}^{2}\rangle \left\langle \frac{v_{BT}^{2}}{\widetilde{v}^{2}}\right\rangle +\langle w_{RC,w}^{2}\rangle \left\langle \frac{w_{BT}^{2}}{\widetilde{w}^{2}}\right\rangle ,\end{eqnarray}$$
 $$\begin{eqnarray}\displaystyle \langle u^{\prime }v^{\prime }\rangle & = & \displaystyle \langle u_{BT}v_{BT}\rangle +\langle u_{RC,u}v_{RC,u}\rangle \nonumber\\ \displaystyle & & \displaystyle +\,\langle u_{RC,u}v_{RC,u}\rangle \left\langle \frac{u_{BT}^{2}}{U^{2}}\right\rangle +\langle u_{RC,v}v_{RC,v}\rangle \left\langle \frac{v_{BT}^{2}}{\widetilde{v}^{2}}\right\rangle +\langle u_{RC,w}v_{RC,w}\rangle \left\langle \frac{w_{BT}^{2}}{\widetilde{w}^{2}}\right\rangle \nonumber\\ \displaystyle & & \displaystyle +\,\langle u_{RC,u}v_{RC,v}\rangle \left\langle \frac{u_{BT}v_{BT}}{U\widetilde{v}}\right\rangle ,\end{eqnarray}$$
 $x$
–
 $z$
spatial averaging, and the prime refers to fluctuations with respect to the mean. The full expressions including the terms that are negligible for our geometries can be found in appendix A. Equations (5.1) are adequate approximations only for small roughness, as long as (3.2) hold. The coherent–background cross-terms, which are zero in the conventional triple decomposition, can be of the same order of magnitude as the coherent–coherent terms. Equations (5.1) can be used to extract the r.m.s. fluctuations of the background-turbulent contribution from the full and the roughness-coherent signals.
R.m.s. fluctuations of the background turbulent flow. (a) Reynolds stress,
 $u_{BT}v_{BT}$
; (b) streamwise velocity,
 $u_{BT}$
; (c) wall-normal velocity,
 $v_{BT}$
; (d) spanwise velocity,
 $w_{BT}$
. Blue to red, cases C06 to C24; black, smooth channel; the arrow indicates increasing
 $k^{+}$
.

Virtual origins for different geometries and
 $k^{+}$
:
 $\times$
,
 $\ell _{U}^{+}$
; ○,
 $\ell _{u}^{+}$
; and
 $+$
,
 $\ell _{J}^{+}$
. Blue, collocated posts; green, spanwise-staggered posts; purple, streamwise-staggered posts; red, collocated posts of two heights.

Compared to the flow over a smooth wall that was located at the plane of the crests,
 $y^{+}=0$
, the r.m.s. fluctuations of the background turbulence are shifted towards the surface, as if they perceived a smooth wall, or a virtual origin, below the roughness crests. In the left panels in figure 13, the r.m.s. fluctuations of the background turbulence are compared with those in smooth-wall turbulence. The decomposition of (5.1) removes from the background turbulence r.m.s. values the peaks in the immediate vicinity of the surface observed for the full signal in figure 12. For the
 $uv$
Reynolds stress, those peaks are already negligible for the full signal, suggesting that dispersive stresses do not play an essential role in the onset of roughness effects. The fluctuations are shifted towards the roughness surface, but otherwise display a similar shape to those of smooth-wall turbulence close to the wall. We refer to these displacements as virtual origins, since the r.m.s. fluctuations behave as if they had an origin below the roughness crests. This can be interpreted as the height below the roughness crests at which they would go to zero if extended as smooth-wall r.m.s. fluctuations.
The virtual origin of the streamwise r.m.s. fluctuations,
 $\ell _{u}^{+}$
, is obtained as the depth below the roughness crests at which
 $u_{BT}^{\prime +}$
would zero out, when extrapolated from its profile above the crests. When
 $u_{BT}^{\prime +}$
is portrayed versus the height measured from that origin, as in figure 13(b ii), a good collapse with smooth-wall data is observed in the first few wall units of height. However, this collapse does not extend outside the roughness sublayer, where all curves should converge to the smooth-wall case. According to Townsend’s outer-layer similarity hypothesis (Townsend Reference Townsend1976), sufficiently far from the surface, effectively outside the roughness sublayer, all turbulent fluctuations are independent of the surface condition when normalised in wall units. In the central panels of figure 13, the origin of the r.m.s. fluctuations is set at
 $\ell _{u}^{+}$
for all variables. We observe that this virtual origin does not adequately collapse any r.m.s. fluctuation other than that of the streamwise velocity very near the surface.
We observe that the streamwise virtual origin,
 $\ell _{u}$
, is related to the apparent origin of the mean velocity profile. Determining the correct zero plane for the law of the wall is a question that has always been present in roughness studies. This reference level for the mean velocity profile is usually referred to as displacement height, and it is in essence equivalent to what we have defined as virtual origins, as it is a shift in the
 $y$
coordinate. Jackson (Reference Jackson1981) proposed a displacement height,
 $\ell _{J}$
, based on the centroid of the friction and pressure forces acting on the wall, that is, the height where the mean drag appears to act for the overlying flow (Leonardi & Castro Reference Leonardi and Castro2010). This can also be calculated from the average displacement of the total shear stress (Jackson Reference Jackson1981),
 $$\begin{eqnarray}\ell _{J}^{+}=\int _{k^{+}}\left(\frac{\text{d}U^{+}}{\text{d}y^{+}}-\langle uv\rangle _{}^{+}\right)\text{d}y^{+}.\end{eqnarray}$$
Similarly, since this displacement is essentially a virtual origin, we can also define another virtual origin for the mean velocity profile,
 $\ell _{U}^{+}$
, as the distance from the roughness crests at which the mean velocity would go to zero. This definition is equivalent to that used above for
 $\ell _{u}^{+}$
, where
 $\ell _{U}^{+}$
can be obtained by linearly extrapolating the mean velocity profile at the wall. In figure 14, we observe that
 $\ell _{U}^{+}$
,
 $\ell _{u}^{+}$
and
 $\ell _{J}^{+}$
are generally similar for different roughness configurations and sizes.
Further away from the wall, where the influence of the roughness-coherent flow is negligible, the r.m.s. fluctuations suggest that turbulence behaves as smooth-wall, canonical turbulence with a virtual origin
 $\ell _{uv}^{+}$
. The virtual origin of the Reynolds shear stress,
 $\ell _{uv}$
appears to be the virtual origin of turbulence outside the roughness sublayer (Fairhall, Abderrahaman-Elena & García-Mayoral Reference Fairhall, Abderrahaman-Elena and García-Mayoral2019; Gómez-de-Segura et al.
Reference Gómez-de-Segura, Fairhall, Macdonald, Chung and García-Mayoral2018a
). Unlike the r.m.s. velocity fluctuations, the near-wall Reynolds shear stress does not change significantly with roughness. In figure 13(a iii), we observe that using the virtual origin of its r.m.s. fluctuations,
 $\ell _{uv}$
, collapses not only the region near the surface, but the entire curve. In the right panels of figure 13, the origin of the r.m.s. fluctuations is set at
 $\ell _{uv}$
for all variables. The r.m.s. fluctuations, including the streamwise ones, converge to smooth-wall turbulence r.m.s. fluctuations outside the roughness sublayer. Very near the rough surface, different variables would extrapolate to zero at different heights, as is particularly evident for
 $u_{BT}^{\prime +}$
and
 $w_{BT}^{\prime +}$
, which experience virtual origins shallower than
 $\ell _{uv}^{+}$
. Beyond this, up to at least
 $k^{+}\approx 15$
, the curves show an excellent collapse with smooth-wall data. This suggests that, up to that
 $k^{+}$
, turbulence remains essentially canonical, i.e. smooth-wall-like.
To further explore the modifications of the background turbulence by roughness within the roughness sublayer, we analyse its two-dimensional energy spectra and cospectra. As introduced in § 3, the decomposition can be used to obtain the two-dimensional energy spectra of the background turbulence, without the footprint of roughness. Figure 15 shows the turbulent premultiplied spectra of
 $u_{BT}$
,
 $v_{BT}$
and premultiplied cospectra of
 $u_{BT}v_{BT}$
, together with smooth-wall results at the equivalent height accounting for the corresponding virtual origin. For this roughness, the spectra present only small changes for
 $k^{+}\lesssim 12$
. As size increases, the spectra and cospectra start to be modified: the energy at large
 $\unicode[STIX]{x1D706}_{x}^{+}$
decreases, while at smaller
 $\unicode[STIX]{x1D706}_{x}^{+}$
there is an increase of energy. The decrease of energy at large wavelengths is particularly clear for the streamwise velocity component. There is also a noticeable change in the spanwise direction. The spectra and cospectra, especially that of
 $v$
, display an increase of energy at small
 $\unicode[STIX]{x1D706}_{x}^{+}$
and a wider range of
 $\unicode[STIX]{x1D706}_{z}^{+}$
. This increase of energy is centred approximately at
 $\unicode[STIX]{x1D706}_{x}^{+}\approx 150$
, being particularly clear for
 $E_{vv}$
.
Two-dimensional premultiplied spectra of the streamwise and wall-normal velocity components, and cospectrum of the Reynolds stress at
 $y^{+}=8$
; from (a) to (d), cases C12, C15, C18 and C24. Shaded, background-turbulent component; ——, smooth-wall data at the equivalent height above the corresponding virtual origin; – – – – (red) and – – – – (blue), positive and negative difference between the rough and smooth-wall results. Vertical dashed lines indicate
 $\unicode[STIX]{x1D706}_{x}^{+}=100$
and 250. Contours indicate the same value in wall units.

6 Shear-flow instability
The spectral energy densities in figure 15 indicate the regions where energy increases or decreases with respect to smooth-wall turbulence. Energy increases at short streamwise wavelengths,
 $\unicode[STIX]{x1D706}_{x}$
, for a broad range of
 $\unicode[STIX]{x1D706}_{z}$
, both larger and smaller than the characteristic
 $\unicode[STIX]{x1D706}_{z}$
of smooth-wall turbulence. The values of
 $\unicode[STIX]{x1D706}_{x}$
at which energy increases,
 $\unicode[STIX]{x1D706}_{x}^{+}\approx 100{-}200$
, appear to be independent of
 $k^{+}$
. Although significantly more intense, similar modifications of the energy spectra were observed on riblets, a particular case of roughness. This increase in energy was found to be due to the formation of a shear-flow instability (García-Mayoral & Jiménez Reference García-Mayoral and Jiménez2011b
). These instabilities are a common feature in obstructed flows (Ghisalberti Reference Ghisalberti2009), and have been observed on flows over plant canopies (Finnigan Reference Finnigan2000) and permeable substrates (Breugem, Boersma & Uittenbogaard Reference Breugem, Boersma and Uittenbogaard2006). Although we do not observe them directly in our numerical simulations, the concentration of energy for a narrow range of
 $\unicode[STIX]{x1D706}_{x}^{+}$
suggests a receptivity to these wavelengths that could be connected to a similar shear-flow instability of the mean velocity profile, for which we analyse the stability properties in this section.
We focus on Kelvin–Helmholtz-like instabilities, which are essentially spanwise coherent, linear and inviscid. Previous studies have shown that the instability is essentially a property of the mean profile (Beneddine et al.
Reference Beneddine, Sipp, Arnault, Dandois and Lesshafft2016), although it is modulated by the effect of the complex substrate on the fluctuating flow (Raupach et al.
Reference Raupach, Antonia and Rajagopalan1991; White & Nepf Reference White and Nepf2007; Zampogna et al.
Reference Zampogna, Pluvinage, Kourta and Bottaro2016), as well as by viscous effects (Jiménez et al.
Reference Jiménez, Uhlmann, Pinelli and Kawahara2001; Luminari, Airiau & Bottaro Reference Luminari, Airiau and Bottaro2016; Gómez-de-Segura, Sharma & García-Mayoral Reference Gómez-de-Segura, Sharma and García-Mayoral2018b
). Since we aim to assess this phenomenon only qualitatively, we conduct a simplified analysis, two-dimensional in
 $x$
and
 $y$
, inviscid and linear, where the flow is allow to fluctuate freely around the mean profile, neglecting the presence of the solid obstacles. We seek wavelike solutions for the velocity and pressure perturbations, of the form
 $f=\hat{f}\exp [\text{i}(\unicode[STIX]{x1D6FC}_{x}x+\unicode[STIX]{x1D6FC}_{z}z-\unicode[STIX]{x1D714}t)]$
, which allows for a modal analysis. The linearised problem becomes then Rayleigh’s equation (Rayleigh Reference Rayleigh1879)
 $$\begin{eqnarray}((U-c)(\unicode[STIX]{x2202}_{yy}-k^{2})-\unicode[STIX]{x2202}_{yy}U)\hat{v}=0,\end{eqnarray}$$
where
 $\unicode[STIX]{x1D6FC}_{x}$
and
 $\unicode[STIX]{x1D6FC}_{z}$
are the wavenumbers in the streamwise and spanwise directions, respectively,
 $\hat{v}$
is the corresponding perturbation mode of the wall-normal velocity, with
 $\hat{v}=0$
at the troughs,
 $k^{2}=\unicode[STIX]{x1D6FC}_{x}^{2}+\unicode[STIX]{x1D6FC}_{z}^{2}$
,
 $\unicode[STIX]{x1D714}$
is the complex frequency, and
 $c$
is the complex phase velocity defined as
 $\unicode[STIX]{x1D714}=\unicode[STIX]{x1D6FC}_{x}c$
. Note that, according to Squire’s theorem, for any streamwise wavelength
 $\unicode[STIX]{x1D6FC}_{x}$
the most amplified mode is two-dimensional,
 $\unicode[STIX]{x1D6FC}_{z}=0$
. The mean velocity profiles,
 $U$
, are directly extracted from our DNS, and include the region below the roughness crests. Notice that the effect of roughness is exclusively introduced through the mean velocity profile. More precise studies include, for instance, a drag force model below the roughness or canopy tips (Py, De Langre & Moulia Reference Py, De Langre and Moulia2006; Luminari et al.
Reference Luminari, Airiau and Bottaro2016; Sharma, Gomez-de Segura & Garcia-Mayoral Reference Sharma, Gomez-de Segura and Garcia-Mayoral2017), at the cost of an increased cost and complexity.
(a) Growth rate
 $\unicode[STIX]{x1D70E}^{+}=\text{Im}(\unicode[STIX]{x1D714}^{+})$
of the most amplified mode as a function of the longitudinal wavelength
 $\unicode[STIX]{x1D706}_{x}^{+}$
. The arrow indicates increasing
 $k^{+}$
. (b) Maximum growth rate
 $\unicode[STIX]{x1D70E}^{+}$
as a function of the roughness height. Blue to red, results for the mean velocity profiles for cases C06 to C36.

The results of the stability analysis, portrayed in figure 16(a), show an instability for the mean flow predominantly for wavelengths
 $\unicode[STIX]{x1D706}_{x}^{+}\approx 100{-}150$
. This result is in rough agreement with the modifications observed in the energy spectra and cospectra in figure 15, where energy concentrates at
 $\unicode[STIX]{x1D706}_{x}^{+}\sim 150$
, and does not significantly change with
 $k^{+}$
. This could be expected, as previous studies have shown that the length scales of the instability are set by the curvature of the mean velocity profile, independently of the length scales in the substrate geometry (White & Nepf Reference White and Nepf2007; García-Mayoral & Jiménez Reference García-Mayoral and Jiménez2011b
; Gómez-de-Segura et al.
Reference Gómez-de-Segura, Sharma and García-Mayoral2018b
). However, our simplified model exhibits a maximum for the instability at
 $k^{+}\approx 15$
, as depicted in figure 16(b), while the changes in the energy spectra increase monotonically with
 $k^{+}$
. Nevertheless, the results suggest that the wavelengths in which energy concentrates in the DNS are the most receptive from the point of view of the stability of the mean flow.
7 Skin friction: towards a predictive model
Roughness function represented versus (a) roughness height, (b) Jackson’s displacement height, (c) wall-normal velocity fluctuations at the roughness crests, and (d) virtual origin of turbulence: ●, collocated posts; ♦, spanwise-staggered posts; ▴, streamwise-staggered posts; ▪, collocated posts of two heights; – – – –, linear regressions
 $16.6v_{t}^{\prime +}$
and
 $0.78\ell _{uv}^{+}$
.

In § 1 we have discussed the main drawbacks of the equivalent sand roughness,
 $k_{s}^{+}$
, which for historical reasons has been widely used to characterise rough surfaces. However, predictive models for
 $k_{s}^{+}$
are only beginning to appear (Yang & Meneveau Reference Yang and Meneveau2016; Yang et al.
Reference Yang, Sadique, Mittal and Meneveau2016), and the ratio
 $k_{s}/k$
, which becomes constant once fully rough conditions are reached, varies through the transitionally rough regime. This is explicitly highlighted by Jiménez (Reference Jiménez2004), who shows that a collapse of the fully rough regime does not guarantee such a collapse in the transitionally rough regime, as shown in figure 1. Therefore,
 $k_{s}^{+}$
is not a suitable parameter to predict
 $\unicode[STIX]{x0394}U^{+}$
. Likewise,
 $k^{+}$
presents similar problems, as it is roughly proportional to
 $k_{s}^{+}$
(Schlichting Reference Schlichting1936). Figure 17 shows
 $\unicode[STIX]{x0394}U^{+}$
as a function of the roughness element height,
 $k^{+}$
, and of Jackson’s displacement height,
 $\ell _{J}^{+}$
. Both capture the trend of increasing
 $\unicode[STIX]{x0394}U^{+}$
for increasing roughness size, but display a strong dependence with the type of roughness surface. Orlandi & Leonardi (Reference Orlandi and Leonardi2006) find a strong linear correlation between
 $\unicode[STIX]{x0394}U^{+}-U_{0}^{+}$
and the r.m.s. fluctuations of the wall-normal velocity at the roughness crests,
 $v_{t}^{\prime +}$
, as shown in figure 17(c) for our simulations. Similarly, a linear relationship between
 $\unicode[STIX]{x0394}U^{+}-U_{0}^{+}$
and
 $\ell _{uv}^{+}$
is also observed in figure 17(d). As introduced earlier,
 $\ell _{uv}^{+}$
is the shift of the Reynolds stress below the roughness crests, and can be interpreted as the apparent position of the origin for turbulence. Both
 $v_{t}^{\prime +}$
and
 $\ell _{uv}^{+}$
establish a connection between the roughness function and the effect of the roughness surface on the flow.
The mean momentum equation is used below to explore this relationship between the roughness function,
 $\unicode[STIX]{x0394}U^{+}$
, and the virtual origin of the Reynolds shear stress,
 $\ell _{uv}^{+}$
. The goal is to obtain an expression for the roughness function. The procedure followed here is similar to that in García-Mayoral & Jiménez (Reference García-Mayoral and Jiménez2011b
) to study the contributions to
 $\unicode[STIX]{x0394}U^{+}$
. In a turbulent channel the mean momentum equation along the streamwise direction is
 $$\begin{eqnarray}-\langle uv\rangle +\unicode[STIX]{x1D708}\frac{\text{d}U}{\text{d}y}=u_{\unicode[STIX]{x1D70F}}^{2}\frac{\unicode[STIX]{x1D6FF}^{\prime }-y_{r}}{\unicode[STIX]{x1D6FF}^{\prime }},\end{eqnarray}$$
where
 $y_{r}$
is the wall-normal coordinate measured from the virtual origin of the mean velocity profile,
 $y_{r}=y-\ell _{U}$
, and the apparent half-height of the channel has previously been defined as
 $\unicode[STIX]{x1D6FF}^{\prime }=\unicode[STIX]{x1D6FF}+\ell _{U}$
. This allows us to define a common origin
 $y_{r}=0$
for the mean velocity profiles under different set-up configurations. Note that
 $\ell _{U}$
is positive and
 $\unicode[STIX]{x1D6FF}^{\prime }>\unicode[STIX]{x1D6FF}$
. Scaling (7.1) in viscous units gives
 $$\begin{eqnarray}-\langle uv\rangle _{}^{+}+\frac{\text{d}U^{+}}{\text{d}y^{+}}=\frac{\unicode[STIX]{x1D6FF}^{\prime +}-y_{r}^{+}}{\unicode[STIX]{x1D6FF}^{\prime +}}.\end{eqnarray}$$
This expression is valid above the roughness crests,
 $y^{+}>0$
or
 ${y^{+}}_{r}>\ell _{U}^{+}$
. Integrating (7.2) allows us to obtain
 $U^{+}$
, and thus an expression for the roughness function,
 $\unicode[STIX]{x0394}U^{+}$
, as the difference in
 $U^{+}$
between rough- and smooth-wall cases. At a distance
 $H^{+}$
sufficiently far above the surface, where outer-layer similarity holds and the mean velocity profile is logarithmic, the roughness function is
 $\unicode[STIX]{x0394}U^{+}=U_{r}^{+}(H^{+})+U_{s}^{+}(H^{+})$
. Let us denote by the subscripts ‘
 $r$
’ and ‘
 $s$
’ the variables in a rough- and smooth-wall channel, respectively. Equation (7.2) can then be integrated between two heights,
 $$\begin{eqnarray}\displaystyle \int _{h_{s}^{+}}^{H^{+}}-\langle uv\rangle _{s}^{+}\,\text{d}y^{+}+U_{s}^{+}(H^{+})-U_{s}^{+}(h_{s}^{+}) & = & \displaystyle (H^{+}-h_{s}^{+})-\frac{1}{2}\frac{{H^{+}}^{2}-{h_{s}^{+}}^{2}}{\unicode[STIX]{x1D6FF}_{s}^{\prime +}},\end{eqnarray}$$
 $$\begin{eqnarray}\displaystyle \int _{h_{r}^{+}}^{H^{+}}-\langle uv\rangle _{r}^{+}\,\text{d}y^{+}+U_{r}^{+}(H^{+})-U_{r}^{+}(h_{r}^{+}) & = & \displaystyle (H^{+}-h_{r}^{+})-\frac{1}{2}\frac{{H^{+}}^{2}-{h_{r}^{+}}^{2}}{\unicode[STIX]{x1D6FF}_{r}^{\prime +}},\end{eqnarray}$$
 $h_{r}^{+}$
and
 $h_{s}^{+}$
, can in principle be different for the rough and the reference smooth case, but for (7.1) to hold,
 $h_{r}^{+}\geqslant \ell _{U}^{+}$
is required. An expression for the roughness function,
 $\unicode[STIX]{x0394}U^{+}$
, can be obtained by subtracting (7.3a
) from (7.3b
). Taking
 $h^{+}=h_{s}^{+}=h_{r}^{+}=\ell _{U}^{+}$
, we then have
 $$\begin{eqnarray}\unicode[STIX]{x0394}U^{+}=U_{r}^{+}(H^{+})-U_{s}^{+}(H^{+})={\mathcal{T}}_{1}+{\mathcal{T}}_{2}+{\mathcal{T}}_{3},\end{eqnarray}$$
where
 $$\begin{eqnarray}\displaystyle {\mathcal{T}}_{1} & = & \displaystyle -\left(\int _{h^{+}}^{H^{+}}-\langle uv\rangle _{r}^{+}\,\text{d}y^{+}-\int _{h^{+}}^{H^{+}}-\langle uv\rangle _{s}^{+}\,\text{d}y^{+}\right),\end{eqnarray}$$
 $$\begin{eqnarray}\displaystyle {\mathcal{T}}_{2} & = & \displaystyle U_{r}^{+}(h^{+})-U_{s}^{+}(h^{+}),\end{eqnarray}$$
 $$\begin{eqnarray}\displaystyle {\mathcal{T}}_{3} & = & \displaystyle -\frac{1}{2}\left(\frac{{H^{+}}^{2}-{h^{+}}^{2}}{\unicode[STIX]{x1D6FF}_{r}^{\prime +}}-\frac{{H^{+}}^{2}-{h^{+}}^{2}}{\unicode[STIX]{x1D6FF}_{s}^{\prime +}}\right).\end{eqnarray}$$
The first term,
 ${\mathcal{T}}_{1}$
, encapsulates the increase in Reynolds stress that roughness produces compared to that over a smooth wall. Over conventional roughness, the Reynolds stress increases near the wall and hence the negative contribution of this term towards
 $\unicode[STIX]{x0394}U^{+}$
. Drag-reducing surfaces produce large slip velocities that overcome the effect of
 ${\mathcal{T}}_{1}$
, resulting in a net reduction of drag. Similarly, roughness also displays a mean velocity at the roughness crests, which is captured by the first term in
 ${\mathcal{T}}_{2}$
. However, when the change in the virtual origin of the mean velocity profile is accounted for, by the second term in
 ${\mathcal{T}}_{2}$
, the net result is generally negative. The first contribution is simply the mean velocity at the roughness crests,
 $U_{0}$
. The other contribution to
 ${\mathcal{T}}_{2}$
is the mean velocity of the smooth-wall channel at the roughness crests equivalent height, which is what the mean velocity would be at the tips if the rough wall had no effect on the mean velocity profile. The term
 ${\mathcal{T}}_{2}$
then represents the difference between the actual mean velocity at the roughness crests and the ideal velocity that would have been achieved at such height without roughness. Notice that for small roughness,
 ${\mathcal{T}}_{2}\approx 0$
. As size increases, the advective terms gain relevance at the roughness crests and the magnitude of
 ${\mathcal{T}}_{2}$
increases. Finally,
 ${\mathcal{T}}_{3}$
accounts for Reynolds-number discrepancies between the different simulations, being zero if
 $\unicode[STIX]{x1D6FF}_{r}^{\prime +}=\unicode[STIX]{x1D6FF}_{s}^{\prime +}$
. In essence, the term
 ${\mathcal{T}}_{3}$
is obtained by integrating the total stress, i.e. the linear, right-hand side of (7.2). The intersect of the linear total stress at different
 $\unicode[STIX]{x1D6FF}^{+}$
causes relative variations in
 ${\mathcal{T}}_{3}$
of order
 $\unicode[STIX]{x1D6FF}_{r}^{\prime +}/\unicode[STIX]{x1D6FF}_{s}^{\prime +}$
.
In our simulations,
 ${\mathcal{T}}_{3}$
contributes significantly to
 $\unicode[STIX]{x0394}U^{+}$
. The simulations are at slightly different
 $Re_{\unicode[STIX]{x1D70F}}$
, which generates set-up-dependent contributions to this term. To isolate these effects, we propose an alternative breakdown,
 $\unicode[STIX]{x0394}U^{+}=T1+T2+T3$
, where
 $$\begin{eqnarray}\displaystyle T1 & = & \displaystyle -\left(\frac{\unicode[STIX]{x1D6FF}_{s}^{\prime +}}{\unicode[STIX]{x1D6FF}_{r}^{\prime +}}\int _{h^{+}}^{H^{+}}-\langle uv\rangle _{r}^{+}\,\text{d}y^{+}-\int _{h^{+}}^{H^{+}}-\langle uv\rangle _{s}^{+}\,\text{d}y^{+}\right),\end{eqnarray}$$
 $$\begin{eqnarray}\displaystyle T2 & = & \displaystyle U_{r}^{+}(h^{+})-U_{s}^{+}(h^{+}),\end{eqnarray}$$
 $$\begin{eqnarray}\displaystyle T3 & = & \displaystyle \left(\frac{\unicode[STIX]{x1D6FF}_{s}^{\prime +}}{\unicode[STIX]{x1D6FF}_{r}^{\prime +}}-1\right)\int _{h^{+}}^{H^{+}}-\langle uv\rangle _{r}^{+}\,\text{d}y^{+}\underbrace{-\frac{1}{2}\left(\frac{{H^{+}}^{2}-{h^{+}}^{2}}{\unicode[STIX]{x1D6FF}_{r}^{\prime +}}-\frac{{H^{+}}^{2}-{h^{+}}^{2}}{\unicode[STIX]{x1D6FF}_{s}^{\prime +}}\right)}_{{\mathcal{T}}_{3}}.\end{eqnarray}$$
 $(\unicode[STIX]{x1D6FF}_{s}^{\prime +}/\unicode[STIX]{x1D6FF}_{r}^{\prime +})\int \langle uv\rangle _{r}^{+}$
to (7.5c
), and rearranging. In this form, the term
 $|T3|\ll |T1|,|T2|$
, and the expression
 $\unicode[STIX]{x0394}U^{+}={\mathcal{T}}_{1}+{\mathcal{T}}_{2}$
is still recovered for
 $\unicode[STIX]{x1D6FF}_{r}^{\prime +}=\unicode[STIX]{x1D6FF}_{s}^{\prime +}$
. By rescaling
 $-\langle uv\rangle _{r}^{+}$
by the ratio of channel heights,
 $\unicode[STIX]{x1D6FF}_{s}^{+}/\unicode[STIX]{x1D6FF}_{r}^{+}$
,
 $T1$
is less dependent on small variations of the frictional Reynolds number, and thus cases with slightly different
 $\unicode[STIX]{x1D6FF}^{+}$
can be more fairly compared. Results of (7.6c
) used on our rough geometries are portrayed in figure 18. The term
 $T1$
contributes the most towards
 $\unicode[STIX]{x0394}U^{+}$
. In our geometries, the term
 $T2$
is observed to always be negative. However, some particular cases with two-dimensional roughness, such as riblets, have also proven to induce a positive, and therefore drag-reducing,
 $T2$
term (García-Mayoral & Jiménez Reference García-Mayoral and Jiménez2011b
).
For
 $\unicode[STIX]{x1D6FF}_{r}^{+}=\unicode[STIX]{x1D6FF}_{s}^{+}$
, equations (7.5c
) and (7.6c
) simplify to
 $$\begin{eqnarray}\displaystyle T1 & = & \displaystyle {\mathcal{T}}_{1}=\int _{h^{+}}^{\unicode[STIX]{x1D6FF}_{s}^{\prime +}}(\langle uv\rangle _{r}^{+}-\langle uv\rangle _{s}^{+})\,\text{d}y^{+},\end{eqnarray}$$
 $$\begin{eqnarray}\displaystyle T2 & = & \displaystyle {\mathcal{T}}_{2}=U_{r}^{+}(h^{+})-U_{s}^{+}(h^{+}).\end{eqnarray}$$
 $\unicode[STIX]{x0394}U^{+}$
, as it is caused by the change in Reynolds stress as well as the difference between the mean velocity at the roughness crests and that over a reference smooth wall at the same height from the virtual origin. Figure 18 indicates that the main contribution to the departure from the hydraulically smooth regime is
 $T1$
, the change in Reynolds stress. In figure 13, we observe that up to
 $\unicode[STIX]{x0394}U^{+}\approx 2$
the difference embodied in
 $T1$
is simply caused by the offset of the Reynolds stress, rather than by a change in curve shape.
Contributions to
 $\unicode[STIX]{x0394}U^{+}$
for (a) collocated posts, (b) collocated posts of two heights, (c) spanwise-staggered posts, and (d) streamwise-staggered posts: ▴,
 $T1$
; ▪,
 $T2$
; ♢,
 $T3$
; ●,
 $\unicode[STIX]{x0394}U^{+}=T1+T2+T3$
.

Now we explore the potential of (7.7) for predicting
 $\unicode[STIX]{x0394}U^{+}$
. Based on the discussion in §§ 4 and 5, we suggest a model for the contributions
 ${\mathcal{T}}_{1}$
and
 ${\mathcal{T}}_{2}$
to estimate
 $\unicode[STIX]{x0394}U^{+}$
. Let us assume that the statistics for a turbulent flow over a smooth wall at the desired
 $Re_{\unicode[STIX]{x1D70F}}$
are available. Therefore, only the terms from roughness,
 $U_{r}^{+}(h^{+})$
and
 $\langle uv\rangle _{r}^{+}(y^{+})$
, need to be modelled. For small roughness size, the velocity at the roughness crests,
 $U_{r}^{+}(h^{+})$
, can be estimated from the laminar model for the coherent flow presented in § 4. In § 5 we discuss how for small
 $k^{+}$
the main effect of roughness on the Reynolds stress,
 $\langle uv\rangle _{r}^{+}$
, is a shift
 $\ell _{uv}^{+}$
towards the surface, but otherwise the Reynolds stress closely resembles that of smooth-wall turbulence. As a result the effective displacement of the Reynolds stress is
 $\ell _{uv}^{+}-\ell _{U}^{+}$
, since the origin is at a depth
 $\ell _{U}^{+}$
below the roughness tips. We can express this relation as if the Reynolds stress of a rough wall was that of smooth-wall turbulence shifted to the corresponding virtual origin, i.e.
 $\langle uv\rangle _{r}^{+}(y^{+})\approx \langle uv\rangle _{s}^{+}({y^{+}}_{\star })$
, where
 ${y^{+}}_{\star }$
is an auxiliary wall-normal coordinate that displaces
 $\langle uv\rangle _{s}^{+}$
. This auxiliary coordinate
 ${y^{+}}_{\star }$
is defined such that near the surface, at
 ${y^{+}}_{r}=h^{+}$
,
 $\langle uv\rangle _{r}^{+}({y^{+}}_{r}=h^{+})\approx \langle uv\rangle _{s}^{+}({y^{+}}_{r}=h^{+}+\ell _{uv}^{+}-\ell _{U}^{+})$
. Notice that a mere shift of
 $\langle uv\rangle _{s}^{+}$
leads to a new
 $\unicode[STIX]{x1D6FF}^{\prime +}$
. Instead, to keep
 $\unicode[STIX]{x1D6FF}^{\prime +}$
constant,
 ${y^{+}}_{\star }$
is linearly transformed, with
 $\langle uv\rangle _{r}^{+}({y^{+}}_{r}=\unicode[STIX]{x1D6FF}^{\prime +})\approx \langle uv\rangle _{s}^{+}({y^{+}}_{r}=\unicode[STIX]{x1D6FF}^{\prime +})$
. The change in Reynolds stress, accounted for in the term
 ${\mathcal{T}}_{1}$
, can therefore be expressed as
 $$\begin{eqnarray}{\mathcal{T}}_{1}\approx \int _{h^{+}}^{\unicode[STIX]{x1D6FF}^{+}}(\langle uv\rangle _{s}^{+}({y^{+}}_{\star })-\langle uv\rangle _{s}^{+}(y^{+}))\,\text{d}y^{+},\end{eqnarray}$$
where
 $$\begin{eqnarray}{y^{+}}_{\star }=\left(\frac{\unicode[STIX]{x1D6FF}^{\prime +}-\ell _{uv}^{+}}{\unicode[STIX]{x1D6FF}^{\prime +}-\ell _{U}^{+}}\right)({y^{+}}_{r}-\ell _{U}^{+})+\ell _{uv}^{+}.\end{eqnarray}$$
Results of this model are portrayed in figure 19. In addition, the values of
 $h_{r}^{+}$
and
 $U_{0}$
, used to estimate
 ${\mathcal{T}}_{2}$
, are estimated from the laminar model for the roughness-coherent contribution, presented in § 4. The model appears to estimate the initial trend of
 $\unicode[STIX]{x0394}U^{+}$
with relatively good agreement up to values of
 $-\unicode[STIX]{x0394}U^{+}\lesssim 2$
, i.e. capturing the region of initial increase of drag with
 $\unicode[STIX]{x0394}C_{f}/C_{f}\lesssim 25\,\%$
. For larger roughness, the results begin to deviate more significantly, as the roughness-coherent flow becomes intense enough to disrupt the background turbulence, causing a modification of the background Reynolds stress more profound than a mere displacement (Fairhall et al.
Reference Fairhall, Abderrahaman-Elena and García-Mayoral2019). These modifications would become even more significant in the fully rough regime, for which the model can be expected to fail.
Results from DNS and estimates based on (7.7): ▴,
 ${\mathcal{T}}_{1}$
; ▪,
 ${\mathcal{T}}_{2}$
; ●,
 $\unicode[STIX]{x0394}U^{+}$
. (a) Collocated posts; (b) collocated posts of two heights; (c) spanwise-staggered posts; and (d) streamwise-staggered posts. Solid symbols, estimates; empty symbols, DNS.

In any event, the above results show the potential of the model described by (7.7) and (7.8) to estimate
 $\unicode[STIX]{x0394}U^{+}$
as it departs from the smooth, zero value. Further work needs to be undertaken in order to extend the model to the entire transitionally rough regime, as well as to obtain an estimate for
 $\ell _{uv}^{+}$
. Additionally, its applicability to random roughness must be analysed, especially for the purpose of industrial applications.
8 Conclusions
In the present work we have investigated the interaction between roughness and near-wall turbulence. We have focused on the transitionally rough regime, to capture the effects that trigger the departure from the hydraulically smooth regime. We propose a triple decomposition where the roughness-coherent contribution is modulated in amplitude by the overlying background-turbulent flow. Using this decomposition, a background turbulence component, essentially free of any footprint from the roughness texture, can be extracted.
The roughness-coherent component, resulting from the ensemble average of the flow field, is systematically studied as roughness size increases. This component presents an exponential decay with
 $y/k$
. The rate of decay depends on the velocity component, with the wall-normal velocity experiencing the slowest decay. All components seem to essentially vanish for
 $y\gtrsim k$
. However, the region where background turbulence is affected by the roughness surface, the roughness sublayer, extends to a height of
 $y/k\approx 2{-}3$
. A laminar model is proposed to estimate the roughness-coherent component. The model results agree well with DNS results for roughness sizes that produce offsets of
 $\unicode[STIX]{x0394}U^{+}\lesssim 2$
. It also provides estimates for the mean velocity at the roughness crests,
 $U_{0}^{+}$
, and the virtual origin of the mean velocity profile,
 $\ell _{U}^{+}$
.
Using the proposed triple decomposition, the roughness-coherent contribution is extracted and the changes produced in the background turbulence can be isolated and analysed. For a large extent of the transitionally rough regime,
 $\unicode[STIX]{x0394}U^{+}\lesssim 4$
, the main effect of roughness is a displacement of the r.m.s. fluctuations and the Reynolds stress in the negative
 $y$
direction, towards the surface. This can be interpreted as turbulence perceiving the wall at a certain virtual origin below the roughness crests. We observe a good agreement between
 $\ell _{U}^{+}$
,
 $\ell _{u}^{+}$
and
 $\ell _{J}^{+}$
, the origins perceived by the mean flow, the streamwise velocity fluctuations and the displacement height, respectively. This supports Jackson’s methodology for defining the displacement height for the law of the wall. However, the near-wall turbulence appears to experience a different virtual origin, essentially that of the Reynolds stress,
 $\ell _{uv}^{+}$
. This origin presents a strong correlation with
 $\unicode[STIX]{x0394}U^{+}$
, similar to that observed for the wall-normal velocity fluctuations by Orlandi & Leonardi (Reference Orlandi and Leonardi2006).
As the roughness size increases and the effect on the background turbulence ceases to be a mere shift, the spectral energy density increases at short streamwise wavelengths, especially for the wall-normal velocity. This increase tends to concentrate at
 $\unicode[STIX]{x1D706}_{x}^{+}\approx 150$
. Results from a simplified linear stability model suggest that this concentration is related to an increased receptivity for
 $\unicode[STIX]{x1D706}_{x}^{+}\approx 100{-}150$
, produced by the inflexionality of the mean velocity profile.
The mean momentum equation has been integrated to identify different contributions to the roughness function,
 $\unicode[STIX]{x0394}U^{+}$
, and in particular to analyse the role of the virtual origin
 $\ell _{uv}^{+}$
. The main contribution is the change in Reynolds stress. For small roughness, this is essentially due to the shift
 $\ell _{uv}^{+}$
, as the Reynolds stress remains otherwise smooth-wall-like. The second contribution to
 $\unicode[STIX]{x0394}U^{+}$
is proportional to the defect of the mean velocity at the height of the roughness crests, compared to a smooth-wall flow. This defect is generally positive, in which case it increases drag.
Acknowledgements
N.A.-E. and C.T.F. were supported by the Engineering and Physical Sciences Research Council under a Doctoral Training Account, grant EP/M506485/1. This work was partly supported by the European Research Council through the II Multiflow Summer Workshop. Computational resources were provided under EPSRC-UK Tier-2 grant EP/P020259/1 by CSD3, Cambridge. We also express our gratitude to A. Sharma for helpful conversations about shear-flow instabilities and their analysis.
Appendix A
Approximate decomposition of the r.m.s. fluctuations using (3.2):
 $$\begin{eqnarray}\displaystyle \langle u^{\prime 2}\rangle & = & \displaystyle \langle u_{BT}^{2}\rangle +\langle u_{RC,u}^{2}\rangle +\langle u_{RC,u}^{2}\rangle \left\langle \frac{u_{BT}^{2}}{U^{2}}\right\rangle +\langle u_{RC,v}^{2}\rangle \left\langle \frac{v_{BT}^{2}}{\widetilde{v}^{2}}\right\rangle +\langle u_{RC,w}^{2}\rangle \left\langle \frac{w_{BT}^{2}}{\widetilde{w}^{2}}\right\rangle \nonumber\\ \displaystyle & & \displaystyle +\,2\left(\langle u_{RC,u}u_{RC,v}\rangle \left\langle \frac{u_{BT}v_{BT}}{U\widetilde{v}}\right\rangle +\langle u_{RC,u}u_{RC,w}\rangle \left\langle \frac{u_{BT}w_{BT}}{U\widetilde{w}}\right\rangle \right.\nonumber\\ \displaystyle & & \displaystyle +\,\left.\langle u_{RC,v}u_{RC,w}\rangle \left\langle \frac{v_{BT}w_{BT}}{\widetilde{v}\widetilde{w}}\right\rangle \right),\end{eqnarray}$$
 $$\begin{eqnarray}\displaystyle \langle v^{\prime 2}\rangle & = & \displaystyle \langle v_{BT}^{2}\rangle +\langle v_{RC,u}^{2}\rangle +\langle v_{RC,u}^{2}\rangle \left\langle \frac{u_{BT}^{2}}{U^{2}}\right\rangle +\langle v_{RC,v}^{2}\rangle \left\langle \frac{v_{BT}^{2}}{\widetilde{v}^{2}}\right\rangle +\langle v_{RC,w}^{2}\rangle \left\langle \frac{w_{BT}^{2}}{\widetilde{w}^{2}}\right\rangle \nonumber\\ \displaystyle & & \displaystyle +\,2\left(\langle v_{RC,u}v_{RC,v}\rangle \left\langle \frac{u_{BT}v_{BT}}{U\widetilde{v}}\right\rangle +\langle v_{RC,u}v_{RC,w}\rangle \left\langle \frac{u_{BT}w_{BT}}{U\widetilde{w}}\right\rangle \right.\nonumber\\ \displaystyle & & \displaystyle +\,\left.\langle v_{RC,v}v_{RC,w}\rangle \left\langle \frac{v_{BT}w_{BT}}{\widetilde{v}\widetilde{w}}\right\rangle \right),\end{eqnarray}$$
 $$\begin{eqnarray}\displaystyle \langle w^{\prime 2}\rangle & = & \displaystyle \langle w_{BT}^{2}\rangle +\langle w_{RC,u}^{2}\rangle +\langle w_{RC,u}^{2}\rangle \left\langle \frac{u_{BT}^{2}}{U^{2}}\right\rangle +\langle w_{RC,v}^{2}\rangle \left\langle \frac{v_{BT}^{2}}{\widetilde{v}^{2}}\right\rangle +\langle w_{RC,w}^{2}\rangle \left\langle \frac{w_{BT}^{2}}{\widetilde{w}^{2}}\right\rangle \nonumber\\ \displaystyle & & \displaystyle +\,2\left(\langle w_{RC,u}w_{RC,v}\rangle \left\langle \frac{u_{BT}v_{BT}}{U\widetilde{v}}\right\rangle +\langle w_{RC,u}w_{RC,w}\rangle \left\langle \frac{u_{BT}w_{BT}}{U\widetilde{w}}\right\rangle \right.\nonumber\\ \displaystyle & & \displaystyle +\,\left.\langle w_{RC,v}w_{RC,w}\rangle \left\langle \frac{v_{BT}w_{BT}}{\widetilde{v}\widetilde{w}}\right\rangle \right),\end{eqnarray}$$
 $$\begin{eqnarray}\displaystyle \langle u^{\prime }v^{\prime }\rangle & = & \displaystyle \langle u_{BT}v_{BT}\rangle +\langle u_{RC,u}v_{RC,u}\rangle \nonumber\\ \displaystyle & & \displaystyle +\,\langle u_{RC,u}v_{RC,u}\rangle \left\langle \frac{u_{BT}^{2}}{U^{2}}\right\rangle +\langle u_{RC,v}v_{RC,v}\rangle \left\langle \frac{v_{BT}^{2}}{\widetilde{v}^{2}}\right\rangle +\langle u_{RC,w}v_{RC,w}\rangle \left\langle \frac{w_{BT}^{2}}{\widetilde{w}^{2}}\right\rangle \nonumber\\ \displaystyle & & \displaystyle +\,(\langle u_{RC,u}v_{RC,v}\rangle +\langle u_{RC,v}v_{RC,u}\rangle )\left\langle \frac{u_{BT}v_{BT}}{U\widetilde{v}}\right\rangle \nonumber\\ \displaystyle & & \displaystyle +\,(\langle u_{RC,u}v_{RC,w}\rangle +\langle u_{RC,w}v_{RC,u}\rangle )\left\langle \frac{u_{BT}w_{BT}}{U\widetilde{w}}\right\rangle \nonumber\\ \displaystyle & & \displaystyle +\,(\langle u_{RC,v}v_{RC,w}\rangle +\langle u_{RC,w}v_{RC,v}\rangle )\left\langle \frac{v_{BT}w_{BT}}{\widetilde{v}\widetilde{w}}\right\rangle .\end{eqnarray}$$