Introduction
Feeding the ever-increasing world population with sustainable crop production systems has become the most challenging task for global agriculture at present. Organic farming systems are believed to have a vital role in reaching sustainability in crop production. Organic systems rely on enhancing soil quality and health via optimized ecologically based farming practices while forgoing the use of agrochemicals to produce crops. Some organically managed soils are known to have superior soil-quality characteristics due to better chemical, physical, and biological properties (Birkhofer et al. Reference Birkhofer, Bezemer, Bloem, Bonkowski, Christensen, Dubois, Ekelund, Fließbach, Gunst, Hedlund and Mäder2008; Bolton et al. Reference Bolton, Elliott, Papendick and Bezdicek1985; Lynch et al. Reference Lynch, Halberg and Bhatta2012; Mäder et al. Reference Mäder, Fliessbach, Dubois, Gunst, Fried and Niggli2002; Mulder et al. Reference Mulder, de Zwart, van Wijnen, Schouten and Breure2003), all of which determine nutrient availability, structure, and biological functions in soil.
Soil organic matter (SOM) is the principal component of soil fertility (Altieri et al. Reference Altieri, Letpourneau and Davis1983; Lal Reference Lal2004), and an overwhelming body of research has identified that organic systems have greater amounts of SOM due to additions of organic matter through the use of farmyard and green manures (Clark et al. Reference Clark, Horwath, Sherman and Scow1998; Drinkwater et al. Reference Drinkwater, Wagoner and Sarrantonio1998; Liebig and Doran Reference Liebig and Doran1999; Mäder et al. Reference Mäder, Fliessbach, Dubois, Gunst, Fried and Niggli2002; Tuomisto et al. Reference Tuomisto, Hodge, Riordan and Macdonald2012). Increased SOM, therefore, can provide better soil fertility by increasing the quantity and availability of nutrients, as well as improved soil physical properties, such as water-holding capacity, lower bulk density, and stable pH for the growth and development of root systems (Drinkwater et al. Reference Drinkwater, Letourneau, Workneh, Van Bruggen and Sherman1995; Marriott and Wander Reference Marriott and Wander2006; Pimentel et al. Reference Pimentel, Hepperly, Hanson, Douds and Seidel2005). Therefore, proponents of organic farming believe that soil fertility in organic systems is generally higher than in conventional systems (Reganold Reference Reganold1988; Reganold et al. Reference Reganold, Palmer, Lockhart and Macgregor1993; Teasdale et al. Reference Teasdale, Coffma and Magnum2007). Particularly, organic cropping systems with diverse crop rotations (e.g., perennial forage crop rotations) have been found to have improved soil-quality characteristics compared to conventional systems with annual crops in rotation (Daroub et al. Reference Daroub, Ellis and Robertson2001; Karlen et al. Reference Karlen, Hurley, Andrews, Camberdella, Meek, Duffy and Mallarino2006), resulting in either similar or higher crop yields in organic compared with conventional systems (Davis et al. Reference Davis, Renner and Gross2005; Delate and Cambardella Reference Delate and Cambardella2004; Hiltbrunner et al. Reference Hiltbrunner, Scherrer, Streit, Jeanneret and Zihlmann2008; Ryan et al. Reference Ryan, Mortensen, Bastiaans, Teasdale, Mirsky, Curran, Seidel, Wilson and Hepperly2010; Smith et al. Reference Smith, Menalled and Robertson2007). However, most previous research compared conventional and organic systems were tillage-based. At present, most conventional systems in North America adopt no-till due to better soil quality–related properties (Aziz et al. Reference Aziz, Mahmood and Islam2013; Liebig et al. Reference Liebig, Tanaka and Wienhold2004). Conversely, most organic systems in the region are tillage-based, due to challenges in managing weeds when adopting no-till practices. Because no-till plays a major role in maintaining soil quality, it is not known whether SOM-related soil-quality benefits in tillage-based organic systems hold true compared with no-till conventional systems.
In addition to the well-known direct soil quality–related yield benefits of organic farming, Smith et al. (Reference Smith, Mortensen and Ryan2010) hypothesized that crops grown in organically managed soils can tolerate greater weed competition than crops in conventional soils due to resource partitioning and resource complementarity as a result of diverse crop management practices among these systems; this is known as the “resource pool diversity hypothesis” (RPDH). Soil resource partitioning and complementarity could occur due to the diversity of growth forms of competing plants (Casper and Jackson Reference Casper and Jackson1997), different forms of nutrient uptake (Harison et al. Reference Harrison, Bol and Bardgett2007; Pornon et al. Reference Pornon, Escaravage and Lamaze2007), and spatial and temporal diversity of resource pools (Hooper Reference Hooper1998; Mckane et al. Reference McKane, Johnson, Shaver, Nadelhoffer, Rastetter, Fry, Giblin, Kielland, Kwiatkowski, Laundre and Murray2002). The uptake of organic forms of N by plants is widely established in many ecosystems (Nordin et al. Reference Nordin, Högberg and Näsholm2001; Persson et al. Reference Persson, Högberg, Ekblad, Högberg, Nordgren and Näsholm2003; Yamagata and Ae Reference Yamagata and Ae1996). Organic systems with a high amount of organic material input can expect to have a greater pool of amino acids that plants can take up when there is competition for inorganic N. Smith et al. (Reference Smith, Mortensen and Ryan2010) further hypothesized that organic systems have greater weed tolerance than conventional systems due to diverse crop rotations, which can increase resource pool diversity through differences in sources, time, and space.
Increasing crop tolerance to weed competition is a sustainable alternative to traditional prophylactic weed control strategies, particularly in low-input systems and in organic cropping systems. Low competition among plant species due to resource partitioning in terms of available plant nutrient forms, particularly organic N (Ashton et al. Reference Ashton, Miller, Bowman and Suding2010; Bol et al. Reference Bol, Ostle and Petzke2002) and inorganic N (Salas et al. Reference Salas, Hickman, Huber and Schreiber1997; Teyker Reference Teyker1992), has been identified. Poffenbarger et al. (Reference Poffenbarger, Mirsky, Teasdale, Spargo, Cavigelli and Kramer2015) found that there was an over-yielding effect in a crop–weed mixture under N-limited conditions compared with monoculture yields, indicating N resource partitioning. Accordingly, some organic systems have been found to produce similar or greater yields, even with high weed abundance, compared with conventional cropping systems (Davis et al. Reference Davis, Renner and Gross2005; Delate and Cambardella Reference Delate and Cambardella2004; Hiltbrunner et al. Reference Hiltbrunner, Scherrer, Streit, Jeanneret and Zihlmann2008; Ryan et al. Reference Ryan, Smith, Mortensen, Teasdale, Curran, Seidel and Shumway2009; Smith et al. Reference Smith, Menalled and Robertson2007).
Weed tolerance and high crop yields due to soil-related properties in organic systems may vary depending on the cropping system. Ryan et al. (Reference Ryan, Mortensen, Bastiaans, Teasdale, Mirsky, Curran, Seidel, Wilson and Hepperly2010) identified that crop–weed competition relationships differ between organic and conventional systems in a long-term cropping systems experiment in Pennsylvania, USA. Yet Poffenbarger et al. (Reference Poffenbarger, Mirsky, Teasdale, Spargo, Cavigelli and Kramer2015) were unable to identify any cropping systems effect on the over-yielding of a crop–weed mixture compared with a monoculture. Even though some studies have found higher crop yields in organic systems, most other studies have found lower crop yields compared with conventional systems (Benaragama et al. Reference Benaragama, Shirtliffe, Gossen, Brandt, Lemke, Johnson, Zentner, Olfert, Leeson, Moulin and Stevenson2016a; de Ponti et al. Reference de Ponti, Rijk and van Ittersum2012; Ponisio et al. Reference Ponisio, M’gonigle, Mace, Palomino, De Valpine and Kremen2015; Seufert et al. Reference Seufert, Ramankutty and Foley2012). Because there was a lack of data to support the RPDH, we tested this hypothesis using a long-term alternative cropping systems (ACS) study at Scott, SK, Canada (Benaragama et al. Reference Benaragama, Shirtliffe, Johnson, Duddu and Syrovy2016b). The ACS study with two contrasting input systems (no-till conventional and tillage-based organic) and with three crop rotation diversity levels (low diversity with fallow-based rotations, medium diversity with continuous annual grain crops, and high diversity with annuals and perennials) provided a great platform to test the RPDH. Benaragama et al. (Reference Benaragama, Shirtliffe, Johnson, Duddu and Syrovy2016b) identified that high crop yields and better crop tolerance to weed competition were not found in tillage-based organic cropping systems compared with no-till conventional systems with diverse crop rotations. Lower crop yields and no tolerance to weed competition in organic systems in Benaragama et al. (Reference Benaragama, Shirtliffe, Johnson, Duddu and Syrovy2016b) could be due to a lack of readily available nutrients, which can hinder the beneficial soil-related properties that are ideally expected in most well-managed organic soils. Organic cropping systems in the Canadian Prairies rely mainly on legumes to meet crop N demands. The availability of farmyard manure (FYM) as a nutrient source is limited in the region, due to the majority of farms in the region being grain based (Knight et al. Reference Knight, Buhler, Leeson and Shirtliffe2010). Therefore, most organic farms in the region are P and N limited (Entz et al. Reference Entz, Guilford and Gulden2001; Martin et al. Reference Martin, Lynch, Frick and van Straaten2007; Roberts et al. Reference Roberts, Lynch, Voroney, Martin and Juurlink2008). Similarly, reduced soil fertility due to low mineral N and P status were found in other organic systems as well (Berry et al. Reference Berry, Sylvester-Bradley, Philipps, Hatch, Cuttle, Rayns and Gosling2002; Kirchmann et al. Reference Kirchmann, Bergström, Kätterer, Mattsson and Gesslein2007; Waldon et al. Reference Waldon, Gleissman and Buchanan1998). Therefore, the majority of the organic systems may be deficient in essential soil nutrients. Apart from potentially being nutrient deficient due to low external inputs, continuous tillage used in most organic cropping systems might have depleted soil quality–related characteristics. Therefore, in grain-based organic systems, limitations in soil N and P and excessive tillage can cause lower crop yields and lower crop tolerance to weed competition due to poorer crop growth than no-till conventional systems.
Soil fertility, weed competition, and crop yields in organic versus conventional systems can vary due to the differences in crop rotations, inputs, tillage, soil type, and the environment. Organic systems can be diverse in terms of tillage (no-till vs. tillage), crop rotations, and types of external organic inputs (compost, FYM) used; thus, resource pool diversity can highly vary. Overall resource pools, tillage, and available N and P could be the determinant factors that influence crop yields and weed tolerance in organic versus conventional systems. Further, changes in relative emergence of the weed in comparison to the crop can be a crucial factor driving competition as well and could vary due to quality-related physical and chemical properties of the soil. However, eliminating these confounding factors is difficult at the field level. Hence, a better comparison of organic and conventional systems for their soil-related benefits should be carried out under controlled conditions eliminating some of these confounding factors. Therefore, stemming from the previous study (Benaragama et al. Reference Benaragama, Shirtliffe, Johnson, Duddu and Syrovy2016b), in this study, we hypothesize that low crop yields and no difference in crop tolerance to weeds in tillage-based organic systems are due to N and P limitation, and when these nutrients are not limiting, organic rotations with high diversity can have greater crop yields and crop tolerance to weed competition than no-till conventional systems with low rotation diversity. This hypothesis was tested in a greenhouse study with different fertility and weed competition treatments using soils obtained from the long-term ACS study in the Canadian Prairies.
Materials and Methods
Long-Term Crop Rotation Study
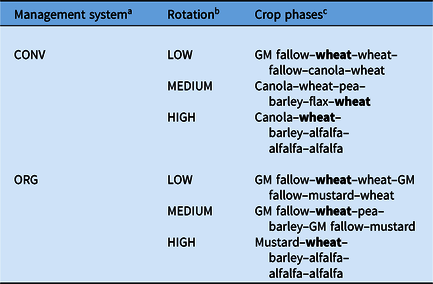
A greenhouse pot experiment was carried out in 2012 and 2013 in Saskatoon, SK, Canada, using the soils obtained from the tillage-based organic (ORG) and no-till conventional (CONV) management system from the long-term (18-yr) ACS trial at Scott, SK, Canada. The details of the ACS trial can be found in Benaragama et al. (Reference Benaragama, Shirtliffe, Gossen, Brandt, Lemke, Johnson, Zentner, Olfert, Leeson, Moulin and Stevenson2016a) and Brandt et al. (Reference Brandt, Thomas, Olfert, Leeson, Ulrich and Weiss2010). The ACS experiment design was a four-replicate split-split plot. The main plots consisted of three levels of management systems. The subplots consisted of three levels of cropping diversity (crop rotations). Each crop rotation had six sub-subplots (six crop phases) with a 6-yr rotation cycle. Among management systems, the ORG system used nonchemical pest control and nutrient management strategies. The CONV system, referred to as the “reduced management system” (RED) in the original study (Brandt et al. Reference Brandt, Thomas, Olfert, Leeson, Ulrich and Weiss2010), used long-term integrated management of pests and nutrients with limited use of chemicals to supplement other management practices. The third input system in the long-term study was the HIGH system, which resembled the conventional tillage–based system practiced in the Canadian Prairies. In this greenhouse study, only the CONV and ORG systems were used, as these two resemble the predominantly used cropping systems in the Canadian Prairies. The three cropping diversity levels included a low crop diversity rotation (LOW), which was a crop–crop–fallow rotation with cereals and canola (Brassica napus L.); the diversified annual grain rotation (MEDIUM), which consisted of cereals, oilseed, and pulse crops; and the diversified annual–perennial rotation (HIGH), which used a mix of grain and forage crops. The MEDIUM and HIGH diversities were referred to as “DAG” and “DAP,” respectively, in the original study (Brandt et al. Reference Brandt, Thomas, Olfert, Leeson, Ulrich and Weiss2010). The crop phases in each cropping system are summarized in Table 1. All crops were spring seeded.
Crop phases of no-till conventional and organic cropping systems in the alternative cropping systems (ACS) study trial at Scott, SK, Canada.

a CONV, no-till conventional; ORG, organic.
b LOW, low diversity; MEDIUM, medium diversity; HIGH, high diversity.
c The crop phases used in the current study are highlighted. GM, lentil (Lens culinaris L.) green manure. Alfalfa (Medicago sativa L.), barley (Hordium vulgare L.), wheat (Triticum aestivum L.), canola (Brassica napa L.), pea (Pisum sativum L.), flax (Linum usitatissimum L.), mustard (Sinapsis alba L.).
The Greenhouse Study
Soil Sampling
The greenhouse study was carried out using the soils obtained from the long-term ACS study at Scott, SK, Canada. Soil sampling was carried out in two random locations in the north and south end of the selected wheat (Triticum aestivum L.) plots from each crop rotation in the ACS study in the CONV and ORG management systems (Table 1). Soil sampling was carried out in the early spring after snowmelt in both 2012 and 2013. The year 2012 was the final year of the third 6-yr rotation cycle and by the year 2013, all wheat plots had completed three 6-yr crop rotation cycles. Intact soil sampling was performed to maintain the physical integrity of the soil profile in each management system, particularly the CONV system, which was under no-till production. Soil cores were obtained using PVC pipe sections (20-cm diameter and 30-cm depth). After the PVC pipe section was removed from the ground, it was used as a pot by placing it on a plastic tray to hold the soil from the bottom. After sampling, all the pots were transported to a greenhouse.
Soil Fertility and Weed Competition Treatments
The greenhouse pot experiment was a four-way factorial experiment with two soil fertility treatments, two weed competition treatments, two management systems, and three crop rotations. The two soil fertility treatments and the two weed competition treatments were applied to the soil cores obtained from the two management systems and the three crop rotations in the ACS trial. The two soil fertility treatments were fertilized (N and P added to both organic and conventional) and nonfertilized (no fertilizer was added). The two weed competition treatments were weedy and weed-free. All the soil cores (pots) were arranged as a randomized block design with three blocks in which each block represented the particular block in the ACS trial where soil samples had been taken. The fertilizer (two levels) and weed treatment (two levels) were applied to the pots taken from the selected wheat phases in all the three crop rotations in ORG and CONV management systems (2 by 3) in the ACS trial, giving 24 treatments (2 by 3 by 2 by 2) for each block. Altogether, there were 72 pots (2 management systems by 3 rotations by 2 fertilizer treatments by 2 weed competitions by 3 blocks).
Synthetic fertilizer containing N and P was added based on the previous year’s fall soil test recommendations for the particular wheat plot in the 0- to 30-cm soil layer. N and P were applied at 2X the recommendation for conventional soils to provide excess nutrients for both CONV and ORG. Synthetic fertilizer was added to ORG instead of organic forms of fertilizer in order to maintain the integrity of soil-quality difference among the three crop rotation diversities as well as to provide limiting nutrients quickly to the plants. Fertilizer rates were calculated for each pot in both the ORG and CONV systems to bring nutrient levels to 110 N kg ha−1 and 55 P kg ha−1. In both years, all these nutrients were supplied using urea and monoammonium phosphate. All fertilizers were added as a solution in water. A stock solution of 2,000 ppm was made for urea and monoammonium phosphate. The total amount of fertilizer was applied as three splits. The first application was done just before transplanting, the second at 6 wk after transplanting, and the final application was done before crop flowering. Daily watering was carried out to maintain approximately the field capacity by measuring soil moisture level using a soil moisture probe that measured the soil volumetric moisture content. Water was added to each pot to reach 100% of the field capacity.
Establishment of Weed Competition Treatment
Common lambsquarters (Chenopodium album L.) was chosen as the model weed to impose competition on the crop, as it was the most common weed observed in the ACS study (Benaragama et al. Reference Benaragama, Leeson and Shirtliffe2019). Weed competition treatment differed in the two years. In 2012, weed competition treatments were established by growing six C. album plants with six wheat plants in both weedy and weed-free treatments. Due to the high level of competition observed in 2012, three wheat plants and three C. album plants were used in each pot in the year 2013. The spring wheat variety ‘Lilian’ was used in the study, as it was the variety used in the ACS field study. Both C. album (weed) and wheat (crop) seeds were initially germinated in petri dishes before being transplanted to pots. An additional two plants (crop and weed) were planted and thinned out to maintain the required density. Transplanting both weed and crop plants eliminated any differences in competition due to differential emergence timing. Transplanting dates depended on the soil sampling carried out in the particular year. In 2012, transplanting was carried out on June 15, and in 2013, it was done on June 7. Other weeds emerging from the soil were uprooted from time to time to maintain the weed density.
Data Collection and Data Analysis
Crop biomass was taken as a measure of crop yield (Benaragama et al. Reference Benaragama, Shirtliffe, Johnson, Duddu and Syrovy2016b) and crop tolerance to competition, as it was not possible to sample both biomass and grain yield, nor was there sufficient soil volume to grow the plant to maturity. At weed physiological maturity (when weed seeds were produced and matured), all plants (crop and weed) were cut at the base and bagged separately. The samples were air-dried for 3 d until a constant weight was achieved and weighed. The crop yield loss index was calculated as (weed-free aboveground crop biomass − weedy aboveground crop biomass)/weed-free aboveground crop biomass. Aboveground crop biomass, aboveground weed biomass, total plant biomass, and yield loss index data were analyzed by ANOVA using PROC MIXED in SAS v. 9.3 (SAS Institute 2011). Data were tested for the assumptions of ANOVA using Levene’s test and the normality test. Data for the two years (2012 and 2013) were combined for the analysis, and the year was considered as a fixed effect, due to the differences in weed competition treatment between the two years. All the other treatments, such as management system, rotation, competition, and fertilizer were considered fixed effects, and the replication was considered random. Means were declared significant with the LSD test when P < 0.05.
Results and Discussion
Initial Soil Fertility
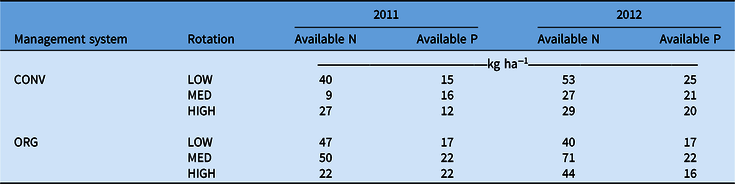
A fall soil test before the commencement of the greenhouse experiment indicated differences (not statistically tested) in available N and P levels among two input systems depending on their crop rotation diversity (Table 2). In fall 2011, soil available N and P were greater in ORG-LOW (17% and 9%, respectively) and ORG-MEDIUM (400% and 32%, respectively) compared with the two respective CONV rotations. Among the two HIGH diversity rotations, the CONV system had 20% and 86% greater soil N and P, respectively. In fall 2012, CONV-LOW had higher N and P content (34% and 45%, respectively) than ORG-LOW. Among MEDIUM rotations, ORG had 165% greater N than CONV. However, there were no differences in P content. The ORG-HIGH rotation had 51% lower N and 23% higher P than the CONV-HIGH rotation. Fairly high N levels observed in ORG-MEDIUM in both years could be due to the wheat crop being followed in the rotation by a pea (Pisum sativum L.) crop, which is less N demanding.
Soil available N and P content (0–12 cm) among cropping systems in fall 2011 and 2012 at alternative cropping systems (ACS) study, Scott, SK.

a CONV, no-till conventional; ORG, organic.
b LOW, low diversity; MEDIUM, medium diversity; HIGH, high diversity.
Crop Biomass
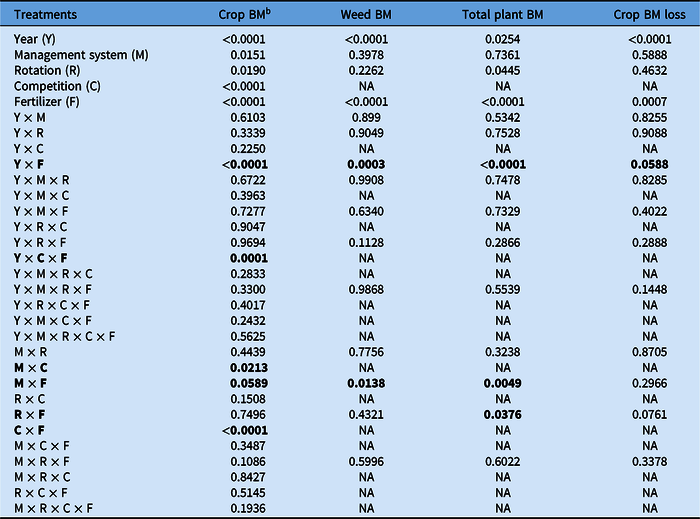
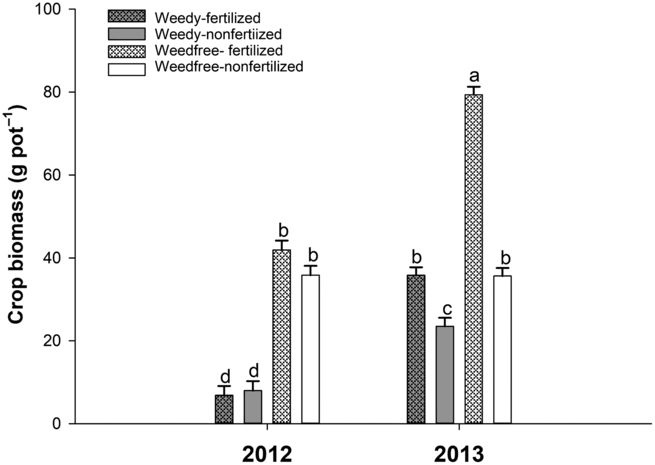
Crop biomass differed between the two years (two studies), as the two experiments differed in plant densities (Table 3). In 2012, crop biomass was 47% lower compared with biomass in 2013 (data not shown). There was a year by competition by fertilizer interaction affecting crop biomass (Table 3). In 2012, there was no difference in crop biomass between the two fertilizer treatments for both weedy and non-weedy conditions (Figure 1). However, in 2013, fertilized treatments under both weedy and non-weedy conditions had greater biomass compared with nonfertilized treatments (Figure 1). Even under weedy conditions, adding fertilizer increased the crop biomass by 43%. In both years, crop biomass was reduced under fertilized weedy conditions compared with fertilized weed-free conditions, indicating that excess supply of fertilizer did not eliminate crop–weed competition for nutrients; thus, testing of RPDH still should be valid in this experimental system.
ANOVA for the effects of year, management system, rotation, fertilizer, and competition on crop biomass, weed biomass, total biomass, and crop biomass loss assessed in the greenhouse in 2012 and 2013. a

a Data were log transformed before analysis.
b Abbreviations: BM, biomass; NA, not applicable.
The effect of weed competition and fertilizer addition on crop biomass assessed in the greenhouse in 2012 and 2013. Error bars represent back-transformed standard errors of the treatment means (pooled across the two years with n = 3). Bars sharing the same letter are not significantly different at P < 0.05 (LSD test).

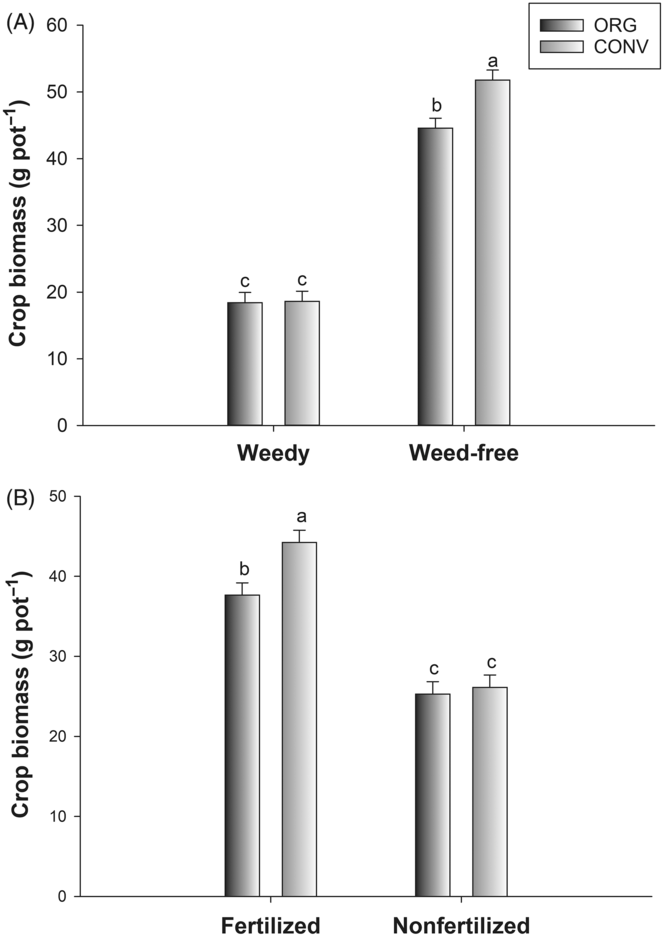
Overall, crop biomass depended on the management system by weed competition interaction (Table 3). Crop biomass was similar between the two systems under weedy conditions, but ORG systems had 14% lower crop biomass compared with the CONV systems under weed-free conditions (Figure 2A). Therefore, this study indicates that even in the absence of weeds, crop yields can be still low in the organic systems compared with conventional systems. In the field study, Benaragama et al. (Reference Benaragama, Shirtliffe, Johnson, Duddu and Syrovy2016b) found that crop yields were about 45% lower in organic systems compared with conventional systems, even under weed-free conditions.
The effect of (A) management system (ORG, organic; CONV, no-till conventional) and weed competition (weedy, weed-free) and the effect of (B) management system (ORG, organic; CONV, no-till conventional) and fertilizer addition (fertilized, nonfertilized) on crop biomass assessed in the greenhouse in 2012 and 2013. Error bars represent back-transformed standard errors of the treatment means (pooled across the two years with n = 3). Bars sharing the same letter are not significantly different at P < 0.05 (LSD test).

There was a management system by fertilizer interaction affecting crop biomass (Table 3). In both years, adding fertilizer increased the crop biomass in both systems (Figure 2B). In CONV systems, the increase in crop biomass due to added fertilizer was 69%, and for ORG, it was 50%. Therefore, this study confirms that organic soils can become depleted in essential nutrients such as available N and P and thus have lower productivity. This study also supports others (Arcand et al. Reference Arcand, Helgason and Lemke2016; Benaragama et al. Reference Benaragama, Shirtliffe, Gossen, Brandt, Lemke, Johnson, Zentner, Olfert, Leeson, Moulin and Stevenson2016a; Malhi et al. Reference Malhi, Brandt, Lemke, Moulin and Zentner2009) that N-fixing annual green manure crops and perennial forage crops used in the ACS study did not provide enough soil nutrients for maximum productivity. Consistent with these findings, most grain-based organic farms in the Canadian Prairies have been found deficient in plant-available N and P (Entz et al. Reference Entz, Guilford and Gulden2001; Knight et al. Reference Knight, Buhler, Leeson and Shirtliffe2010; Martin et al. Reference Martin, Lynch, Frick and van Straaten2007; Roberts et al. Reference Roberts, Lynch, Voroney, Martin and Juurlink2008).
When standard ORG (nonfertilized) was compared with the standard CONV (fertilized), crop biomass was significantly lower (43%) in the standard ORG soils. When both systems were not fertilized, there was no difference in crop biomass between the two systems (Figure 2B). Similar results were observed in a field experiment by Halde et al. (Reference Halde, Bamford and Entz2015), who found that when synthetic fertilizer was not applied, conventional systems had crop yields similar to those of organic systems. Organic systems had lower crop biomass yield than CONV systems even after the addition of fertilizers (Figure 2B). Crop biomass in the CONV fertilized treatment was 17% greater than the crop biomass in ORG treatments. Soils of organically managed systems are expected to have greater crop yields than conventional systems when essential nutrients are not limiting due to better soil quality–related factors associated with the quantity and quality of SOM. However, the inability to detect better crop yields in ORG systems than in no-till conventional systems indicates organically managed soils in these systems might have no soil-related advantages in crop yields over the no-till conventional soils. Continuous tillage used in ORG systems might have depleted soil organic carbon content (SOC), which drives most of the biological properties of the soils in the ACS experiment that led to better soil quality (Arcand et al. Reference Arcand, Helgason and Lemke2016).
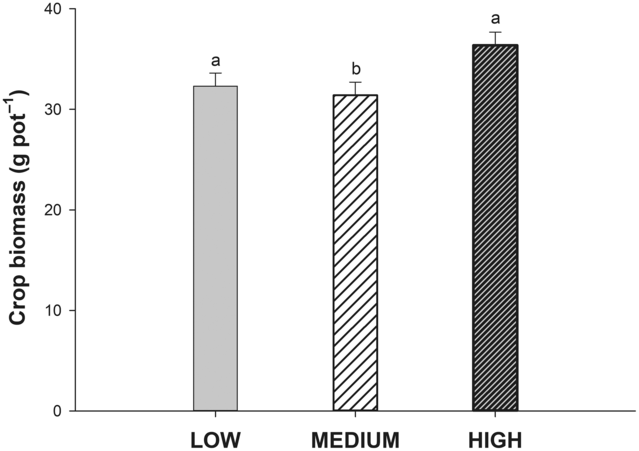
Crop rotations resulted in differences in crop biomass regardless of all other treatments, indicating the strong influence of crop diversity on crop biomass yield (Table 3). The HIGH diversity rotation had the greatest crop biomass compared with the MEDIUM and the LOW rotations (Figure 3). This contradicts the results from the field studies from the ACS (Benaragama et al. Reference Benaragama, Shirtliffe, Gossen, Brandt, Lemke, Johnson, Zentner, Olfert, Leeson, Moulin and Stevenson2016a, Reference Benaragama, Shirtliffe, Johnson, Duddu and Syrovy2016b), which identified low crop yields in the HIGH diversity rotation (perennial-based rotation). It was speculated that limitations in moisture or soil fertility could be the reasons for low yields in this perennial rotation. Under greenhouse conditions, soil moisture limitation was excluded; thus yields were high, confirming that under field conditions, perennials can be less productive due to moisture limitations. Furthermore, the absence of crop rotation by fertilizer treatment interaction effects on crop biomass indicated that crop rotations did not respond differently to added fertilizer.
The effect of crop rotation (LOW, low diversity; MEDIUM, medium diversity; HIGH, high diversity) on crop biomass assessed in 2012 and 2013. Error bars represent back-transformed standard errors of the treatment means (pooled across the two years with n = 3). Bars sharing the same letter are not significantly different at P < 0.05 (LSD test).

Weed Biomass
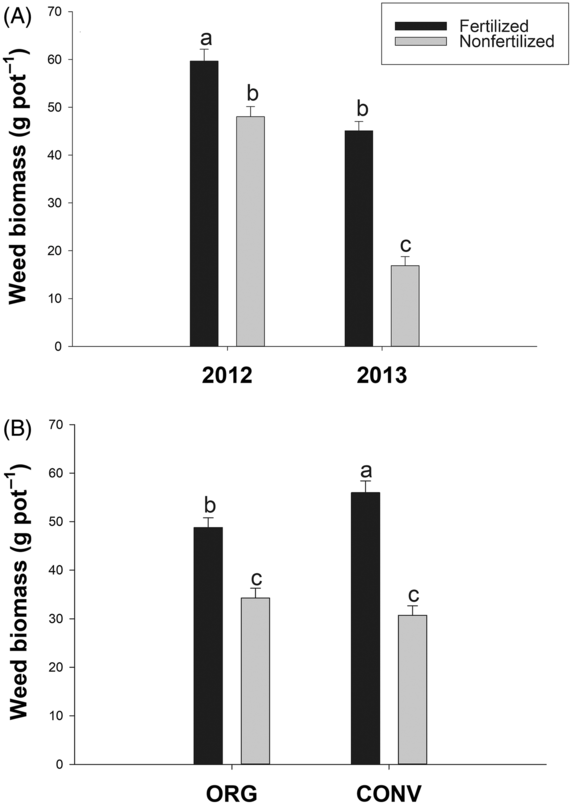
There were fertilizer by year and fertilizer by management system interaction effects on weed biomass (Table 3). Weed biomass was greater under both fertilized and nonfertilized conditions in 2012 than in 2013 (Figure 4A). This was due to greater weed density in the 2012 experiment compared with the 2013 experiment. The addition of fertilizer increased weed biomass in both management systems in both years (Figure 4B), and it was increased by 82% in CONV systems, but only by 42% in ORG systems, revealing greater response of weeds to nutrient addition in no-till conventional systems than organic systems. This greater response of weeds in CONV systems compared with ORG systems could be due to better soil physical properties that enhance nutrient uptake from soil by roots. Standard ORG systems (nonfertilized) had lower weed biomass compared with the standard CONV (fertilized) systems. When fertilizer was added to ORG systems, weed biomass was significantly increased but still was lower than in the standard CONV systems. This suggests that sometimes the low weed biomass observed in organic systems compared with CONV systems was due to low soil fertility in ORG systems and not due to greater weed-suppressive ability of the organically grown crop. These results are counter to some interpretations that organic systems have lower yield loss, even with high weed density, compared with conventional systems (Delate and Cambardella, Reference Delate and Cambardella2004; Posner et al. Reference Posner, Baldock and Hedtcke2008; Ryan et al. Reference Ryan, Mortensen, Bastiaans, Teasdale, Mirsky, Curran, Seidel, Wilson and Hepperly2010), indicating high crop tolerance. Yet, this low yield loss could be due to low weed biomass in organic systems and therefore should be interpreted cautiously.
The effect of the (A) year and fertilizer addition interaction and (B) management system (ORG, organic, CONV, no-till conventional) on weed biomass assessed in 2012 and 2013. Bars sharing the same letter are not significantly different at P < 0.05 (LSD test).

Crop Tolerance to Weed Competition
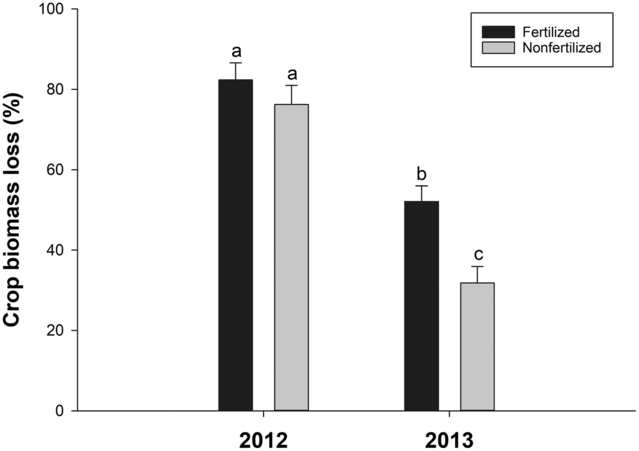
In this study, crop tolerance to weed competition was assessed based on crop biomass loss due to weed competition. No effect of cropping systems (management systems by crop rotations) on crop tolerance to weed competition was identified (Table 3). Further, there was no individual effect of management system or crop rotation on crop tolerance. Differences in crop tolerance to weed competition among these cropping systems also were not identified in the ACS field study (Benaragama et al. Reference Benaragama, Shirtliffe, Johnson, Duddu and Syrovy2016b). In the present study, it was hypothesized that low N and P availability is causing low yields in ORG and thus low crop tolerance as well. As there was no interaction of fertilizer treatment with crop management or rotation (Table 3), these results reveal that even the addition of external N and P did not change the crop tolerance to weed competition among cropping systems. Therefore, this result refutes our hypothesis that limitation in N and P is the reason for low crop tolerance to weeds in organic systems and the hypothesis that there are differences among crop rotations in terms of crop tolerance when soil fertility is not limiting. Under both fertilizer conditions, crop biomass loss was greater in 2012 than in 2103, probably due to the high weed density in 2012. This also indicates weed density is the main factor that contributes to high crop loss. The addition of fertilizer significantly increased biomass loss from 31% to 52% in 2013, but not in 2012 (Figure 5).
The effect of fertilizer addition and the year on crop biomass loss assessed in 2012 and 2103. Bars sharing the same letter are not significantly different at P < 0.05 (LSD test).

Both studies (field and greenhouse) revealed that these grain-based organic systems in the Canadian Prairies do not have better crop tolerance to weed competition than no-till conventional systems. Hence, these results do not support the RPDH proposed by Smith et al. (Reference Smith, Mortensen and Ryan2010), indicating the variability of resource pools among organic and conventional systems. These results somewhat contradict those of Ryan et al. (Reference Ryan, Smith, Mortensen, Teasdale, Curran, Seidel and Shumway2009), who noted that crop–weed competition relationships were different between organic and conventional systems. However, in that study, the conventional system was a tillage-based system, and most of the differences identified were between manure-based systems versus conventional systems, but the authors did not see differences with legume-based systems comparable to the ORG system in this study.
Given this study is a greenhouse experiment, it may not be a perfect system to understand crop–weed competition dynamics under organic and conventional systems. In this study, we had to control the phenological differences in weed growth and development due to changes in resource dynamics as well as soil physical factors (tillage) by planting all the weeds at the same time. This will eliminate some of the differences in plant emergence seen with tillage. Thus, the focus of this study is to understand the differences in resource pools when soil N and P are not limiting. From that perspective, it would have been ideal to add external organic nutrients to the organic systems to overcome the N and P limitations, but it would be difficult to maintain the integrity among different crop rotations by adding external organic materials. The results of the study revealed that even after external inorganic nutrients were applied, there was a significant degree of crop–weed competition in all systems. Further, adding mineral nutrients, even though they were able to provide essential nutrients for crop growth, did not alter the long-term soil quality–related factors (SOM, SOC, etc.) inherited by the system that drive the resource pool diversity. Thus, we believe that any soil quality–related difference in crop–weed competition between organic and conventional systems, if it existed, would have been realized in this experimental system.
Total Productivity (Total Plant Biomass)
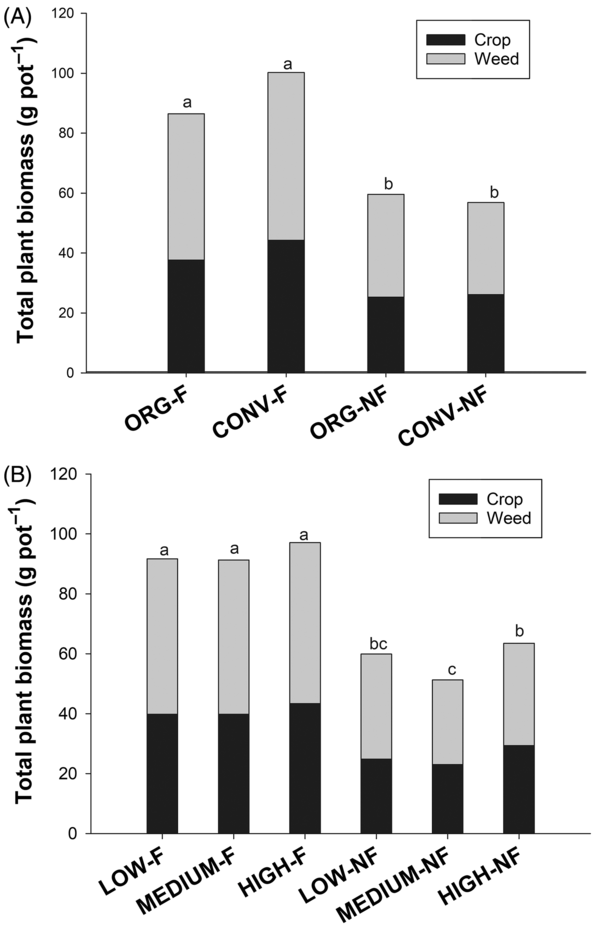
ORG systems had similar total biomass (crop + weed) compared with CONV systems under nonfertilized conditions (Figure 6A). However, total biomass was greater in CONV under fertilized conditions. Total plant biomass was greater for the standard CONV system (fertilized) compared with the standard ORG system (nonfertilized). Total plant biomass was similar across crop rotations under fertilized conditions; nevertheless, under nonfertilized conditions, the MEDIUM rotation had lower biomass compared with the HIGH diversity rotation (Figure 6B).
Effect of (A) management system (ORG, organic; CONV, no-till conventional) and fertilizer addition (F, fertilized; NF, nonfertilized) and (B) crop rotation (LOW, low diversity; MEDIUM, medium diversity; HIGH, high diversity) and fertilizer addition on total plant biomass assessed in 2012 and 2013. Bars sharing the same letter are not significantly different at P < 0.05 (LSD test).

Lower biomass productivity and grain yields in all organic rotations compared with the conventional rotations were found under the field conditions of the ACS as well (Benaragama et al. Reference Benaragama, Shirtliffe, Johnson, Duddu and Syrovy2016b). Lower grain yields identified in organic systems, even under weed-free conditions in the field study, suggested that low yield was related to soil fertility but not due to weed competition. Both studies revealed that these organic systems have lower crop yields than conventional systems, and weed competition was not the main cause for the yield differences. In general, several previous studies found low soil fertility (low N and P) in most grain-based organic systems causing low yields. However, in the present study, it was noted that crops grown on organically managed soils had reduced crop biomass production compared with the conventional system, even when the plant-available nutrients (N and P) were not limiting. Because SOM content is one of the most important factors determining soil fertility, low amounts could hinder the potential benefits of organically managed soils. After 12 yr of the ACS cropping system study, Malhi et al. (Reference Malhi, Brandt, Lemke, Moulin and Zentner2009) found that the light fraction organic matter (the fraction of SOM that is most active in nutrient cycling) was lower in the ORG compared with the CONV system. Accordingly, Arcand et al. (Reference Arcand, Helgason and Lemke2016) identified that soil microbial activity is comparatively lower in the ORG than in the no-till CONV system due to the lack of crop residues leading to poor soil fertility. Therefore, the lack of quantity and quality of organic matter in organically managed soils could be the main reason for not observing soil quality–related benefits such as greater weed tolerance or greater crop yields compared with conventional soils, even when essential macronutrients are not limiting. Most organic systems found to have greater SOM content and subsequent soil quality–related benefits reflect the application of a high amount of FYM (Bulluck et al. Reference Bulluck, Brosius, Evanylo and Ristaino2002; Clark et al. Reference Clark, Horwath, Sherman and Scow1998; Johnston Reference Johnston1997; Kirchmann et al. Reference Kirchmann, Kätterer and Bergström2008; Ryan et al. Reference Ryan, Mortensen, Bastiaans, Teasdale, Mirsky, Curran, Seidel, Wilson and Hepperly2010). Yet such management is not common in all organic systems, particularly in grain-based systems (Knight et al. Reference Knight, Buhler, Leeson and Shirtliffe2010). In addition to the lack of externally added organic matter, continuous tillage in these organic systems would have caused depletion of soil quality, particularly organic matter (Franzluebbers et al. Reference Franzluebbers, Langdale and Schomberg1999; Grandy et al. Reference Grandy, Robertson and Thelen2006). The RPDH proposed by Smith et al. (Reference Smith, Mortensen and Ryan2010) is driven by the diversity of soil nutrient resources that can occur in an ideal organic system with high organic matter inputs via FYM that build up the quantity and quality of SOM compared with a conventional system with no such organic matter additions. In this greenhouse study, we gradually attempted to eliminate some of the limiting factors we observed in the field study (Benaragama et al. Reference Benaragama, Shirtliffe, Johnson, Duddu and Syrovy2016b). From both these studies, we confirmed that these organic systems have no advantage in tolerating weed competition. This could be mainly due to no difference in SOC observed in ORG and CONV rotations in the ACS trial after completion of the 18 yr of the study (Arcand et al. Reference Arcand, Helgason and Lemke2016). Low SOC can be due to crop residue limitation in organic systems caused by low productivity (Kirchmann et al. Reference Kirchmann, Kätterer, Bergström, Börjesson and Bolinder2016), high rate of microbial decomposition due to tillage, or both. This scenario could be common to many tillage-based organic cropping systems throughout the world, particularly in systems totally relying on green manure crops to provide soil fertility. Organic systems that have higher SOC and subsequent soil quality are known to be a result of overapplication of imported organic matter (Leifeld and Fuhrer Reference Leifeld and Fuhrer2010). Therefore, given the conditions we tested, this study will not reject RPDH but challenge its applicability across all organic systems for weed management. Increasing crop tolerance to weed competition by enhancing soil fertility and soil quality is a huge challenge for most large-scale organic systems around the world and requires better crop rotations, incorporation of organic matter (particularly FYM), and reducing tillage as much as possible.
Acknowledgments
The authors would like to thank Agriculture Agri-Food Canada research station at Scott, SK, for allowing us to carry out the experiment within the long-term ACS study. We would like to thank Organic Cluster II for partially funding this project. Particularly, we would like to thank Eric Johnson for his continuous support for this project. Also, we would like to thank Shaun Campbell, Matt Leisle, Lena Syrovy, Sudharkar Duddu, and Colleen Redlick from the Agronomy and Weed Ecology lab of the University of Saskatchewan for their great support. Furthermore, we would like to extend our gratitude to Jeff Schoenau and Cory Fatteicher from the Department of Soil Sciences, University of Saskatchewan, for their technical support. No conflict of interests have been declared.