


1. Introduction
The state of mass balance of the vast majority of Antarctic glaciers is not known at present. This incomplete knowledge casts doubt on any estimate of the contribution of the Antarctic ice sheet to global sea-level rise. No change in ice-sheet elevation is detected in the vast interior of the ice sheet by European Remote-sensing Satellite (ERS) radar altimetry, except perhaps in the Amundsen Sea sector of West Antarctica (Reference Wingham, Ridout, Scharroo, Arthern and ShumWingham and others, 1998). These results, however, which are limited in spatial resolution to about 250 km, do not provide any indication of the state of mass balance of the glaciers at low elevation, along the coast. In Greenland, recent results from airborne laser altimetry show that the ice-sheet interior is more or less in balance with accumulation, but large coastal sectors are thinning rapidly, with thinning concentrated in channels occupied by fast-moving outlet glaciers (Reference KrabillKrabill and others, 2000). Similar studies conducted along the coastal sectors of Antarctica are timely.
Several approaches have been used to determine the mass balance of Antarctic glaciers, all with their own advantages and limitations. The approach considered here is commonly referred to as the mass-budget method. It compares mass accumulation in the interior with mass discharge across a flux gate. The difference between these two large values determines whether the glacier as a whole is losing or gaining mass. Recent advances in satellite radar interferometry (InSAR) mapping of grounding lines and ice velocity (Reference Rignot, Gogineni, Krabill and EkholmRignot and others, 1997), topographic mapping of the ice sheet (Reference Bamber and BindschadlerBamber and Bindschadler, 1997) and digital mapping of snow accumulation (Reference Vaughan, Bamber, Giovinetto, Russell and CooperVaughan and others, 1999; Reference Giovinetto and ZwallyGiovinetto and Zwally, 2000) are prompting a revision of earlier mass-budget assessments of Antarctic glaciers. In this study, we present a first step toward this modern revision. InSAR is used to map the location of grounding lines, ice velocity in vector form, and surface topography of nine major outlet glaciers of East Antarctica that do not drain into the Ross or Filchner–Ronne Ice Shelves. The results are used to estimate the mass fluxes and mass balance of the glaciers, and the rates of basal melting of the ice shelves in front of them under steady-state conditions.
Methods
This study combines InSAR data (Table 1) with prior-determined digital elevation maps (DEMs) and accumulation maps of Antarctica.
Mapping of East Antarctic glaciers using ERS and RSAT

Topography and accumulation
Topography has four main usages: (1) to remove the topographic signal from InSAR measurements of ice velocity and grounding-line position; (2) to rectify and georeference the InSAR products onto an Earth-fixed grid; (3) to estimate ice thickness from ice-shelf elevation assuming hydrostatic equilibrium; and (4) to delineate the glacier drainage basins.
Several DEMs of Antarctica have been produced in recent years. The RADARSAT-1 (RSAT) Antarctic Mapping Project (RAMP) DEM (Reference Liu, Jezek and LiLiu and others, 1999), used to control the mosaicking of RADARSAT data, was not found to be useful for this study. Although it offers improved mapping of the coastal range, its accuracy is poor on floating ice where old cartography was used. This study uses the DEM of Antarctica derived from ERS radar altimetry alone (Reference Bamber and BindschadlerBamber and Bindschadler, 1997), which is accurate at the meter level on the nearly flat surface of large ice shelves. Performance decreases rapidly over sloping terrain, near mountain ranges or at high latitude where the density of crossover points is low. In some cases, ERS radar altimetry had to be supplemented by an InSAR-derived DEM of the glacier (Table 1).
Ice thickness is deduced from the ERS DEM(referenced to sea level using the OSU 91 geoid model) by multiplying the ice-shelf elevation by 8.05. This heuristic is based on a comparison of ice-sounding radar measurements with DEM elevations on Pine Island and Thwaites Glaciers (Reference RignotRignot, 2001). The multiplicative coefficient reflects the density profile of ice and sea water, as well as geoidal height offsets. Errors in geoid height could be ±10m (e.g. Reference Jenkins and DoakeJenkins and Doake, 1991), thus inducing uncertainties in ice thickness of ±100m from hydrostatic equilibrium. Errors in the density profile of ice and sea water are likely less significant. Few measurements of ice thickness are available at the grounding line of East Antarctic glaciers for comparison. A detailed examination of the BEDMAP (Reference Lythe and VaughanLythe and others, 2000) reveals a complete lack of thickness data on the floating sections of Totten, Denman, Shirase, Stancomb-Wills and Ninnis Glaciers. Three measurement points on Mertz GlacierTongue indicate an underestimation of ice thickness by 3% or 30 m. On Lambert Glacier, 17 data records indicate an overestimation of ice thickness by 3% or 57 m. Ice-thickness data records exist in this area both above and below the grounding line, but not at the grounding line, which is the zone of confluence of Mellor, Fisher and Lambert Glaciers, and hence where ice is the thickest. Based on this limited set of comparisons, and potential uncertainties in the geoid, ice thickness employed in this study has an uncertainty of 100 (high-quality topographic information and existence of discrete thickness records) to 200m (lower-quality topography and no thickness records).
Drainage basins are drawn from the end-points of the flux gates, following the line of steepest slope (Fig. 1). The drainage areas and corresponding mass fluxes presented here do not necessarily compare to those published in the past, because those estimates typically depend on the width and location of the selected output gates. This is especially true in the case of large glacier fronts where there is no obvious lateral boundary in glacier flow.
Balance velocity (personal communication fromJ. L. Bamber, 2000) on a logarithmic scale showing the drainage basins of nine East Antarctic glaciers, on a polar stereographic grid. The drainage basins of five West Antarctic glaciers, studied with the same methodology but not discussed here, are shown for reference.

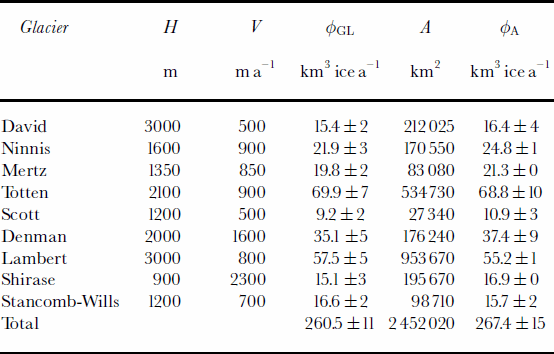
Total accumulation is integrated over each drainage basin using two digital maps of accumulation: (1) Giov inetto and Zwally (2000) and (2) Reference Vaughan, Bamber, Giovinetto, Russell and CooperVaughan and others (1999). Table 2 shows the average of the two maps and the standard deviation. The standard deviation indicates the level of reliability of the balance flux, ϕA, in various sectors. Values are quoted in km3 ice a–1 using an ice density of 917 kgm–3. As noted above, wider or narrower flux gates could change ϕA by 10 –20 %on some glaciers.
Mass discharge of East Antarctic glaciers at the grounding line, ϕGL , and mass input from snow accumulation, ϕA , over a drainage basin of area A . H and V are, respectively, the glacier-center thickness and velocity at the grounding line
InSAR products
InSAR topography is generated from pairs of interferograms acquired along the same track, with appropriately long baselines. Control points are selected from the ERS DEM over a portion of the processed imagery that covers the ice-sheet interior. A measure of the quality of the InSAR topography is the degree of fit of the control elevations with the interferometrically derived elevations. The results vary from one glacier to the next, depending on the type of interferometric baselines available. In general, the precision is of a few tens of meters vertical (Fig. 2–9).
David Glacier, Victoria Land: (a) vector velocity map (m a–1) derived from ERS; (b) grounding-line position and tidal motion derived from ERS InSAR (each color cycle represents a 30 mm increment in vertical displacement of the ice surface due to changes in oceanic tide); surface topography (200 m contour) derived from (c) ERS InSAR and (d) ERS radar altimetry. The grounding-line and basal-melt flux gates are, respectively, shown in blue and dotted blue in (a), and black and dotted black in (c, d). Latitude is plotted every 0.25°. Longitude is plotted 1°.

Ninnis Glacier,Wilkes Land: (a) velocity map from ERS; (b) grounding-line position from ERS; and (c) topography from radar altimetry. See Figure 2 for legend.

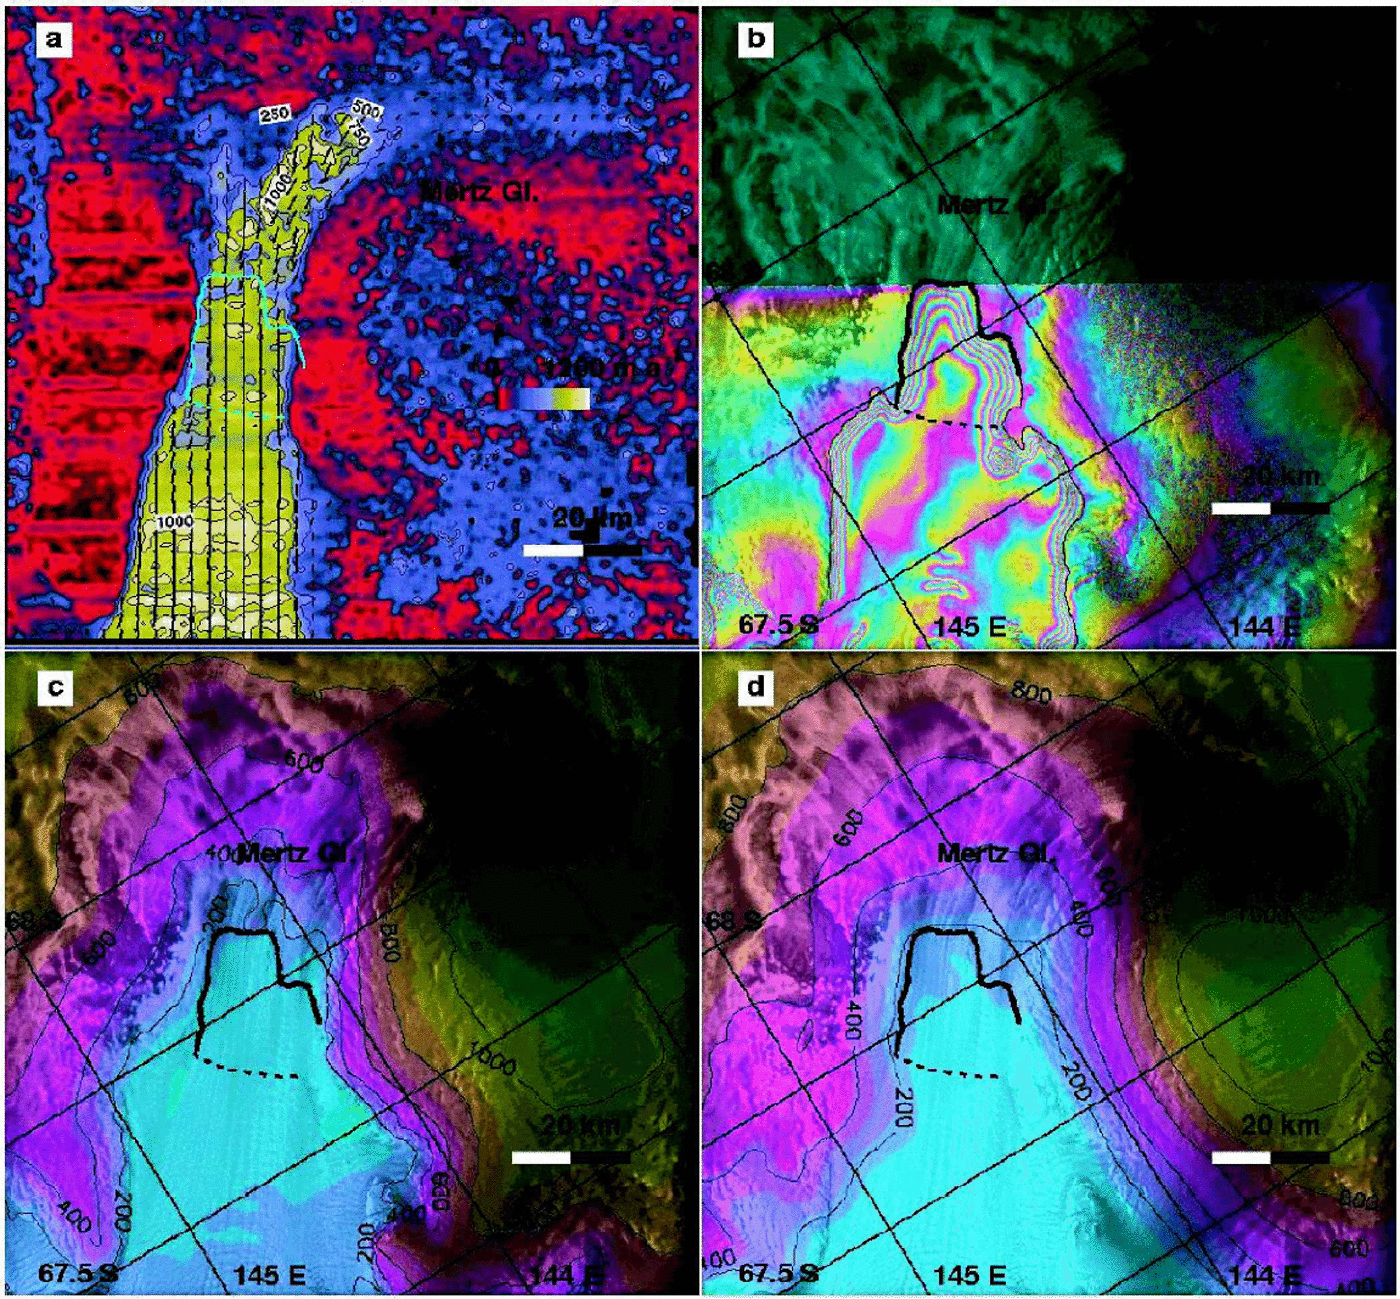
Mertz Glacier, Wilkes Land: (a) velocity map from ERS; (b) grounding-line position from ERS; topography from (c) ERS InSAR and (d) ERS radar altimetry. See Figure 2 for legend.
Totten Glacier, Wilkes Land: (a) velocity map from ERS; (b) grounding-line position from ERS; and (c) topography from ERS radar altimetry. See Figure 2 for legend.

Denman and Scott Glaciers, Wilkes Land: (a) velocity map from ERS; (b) grounding-line position from ERS; and (c) topography from ERS radar altimetry. See Figure 2 for legend.

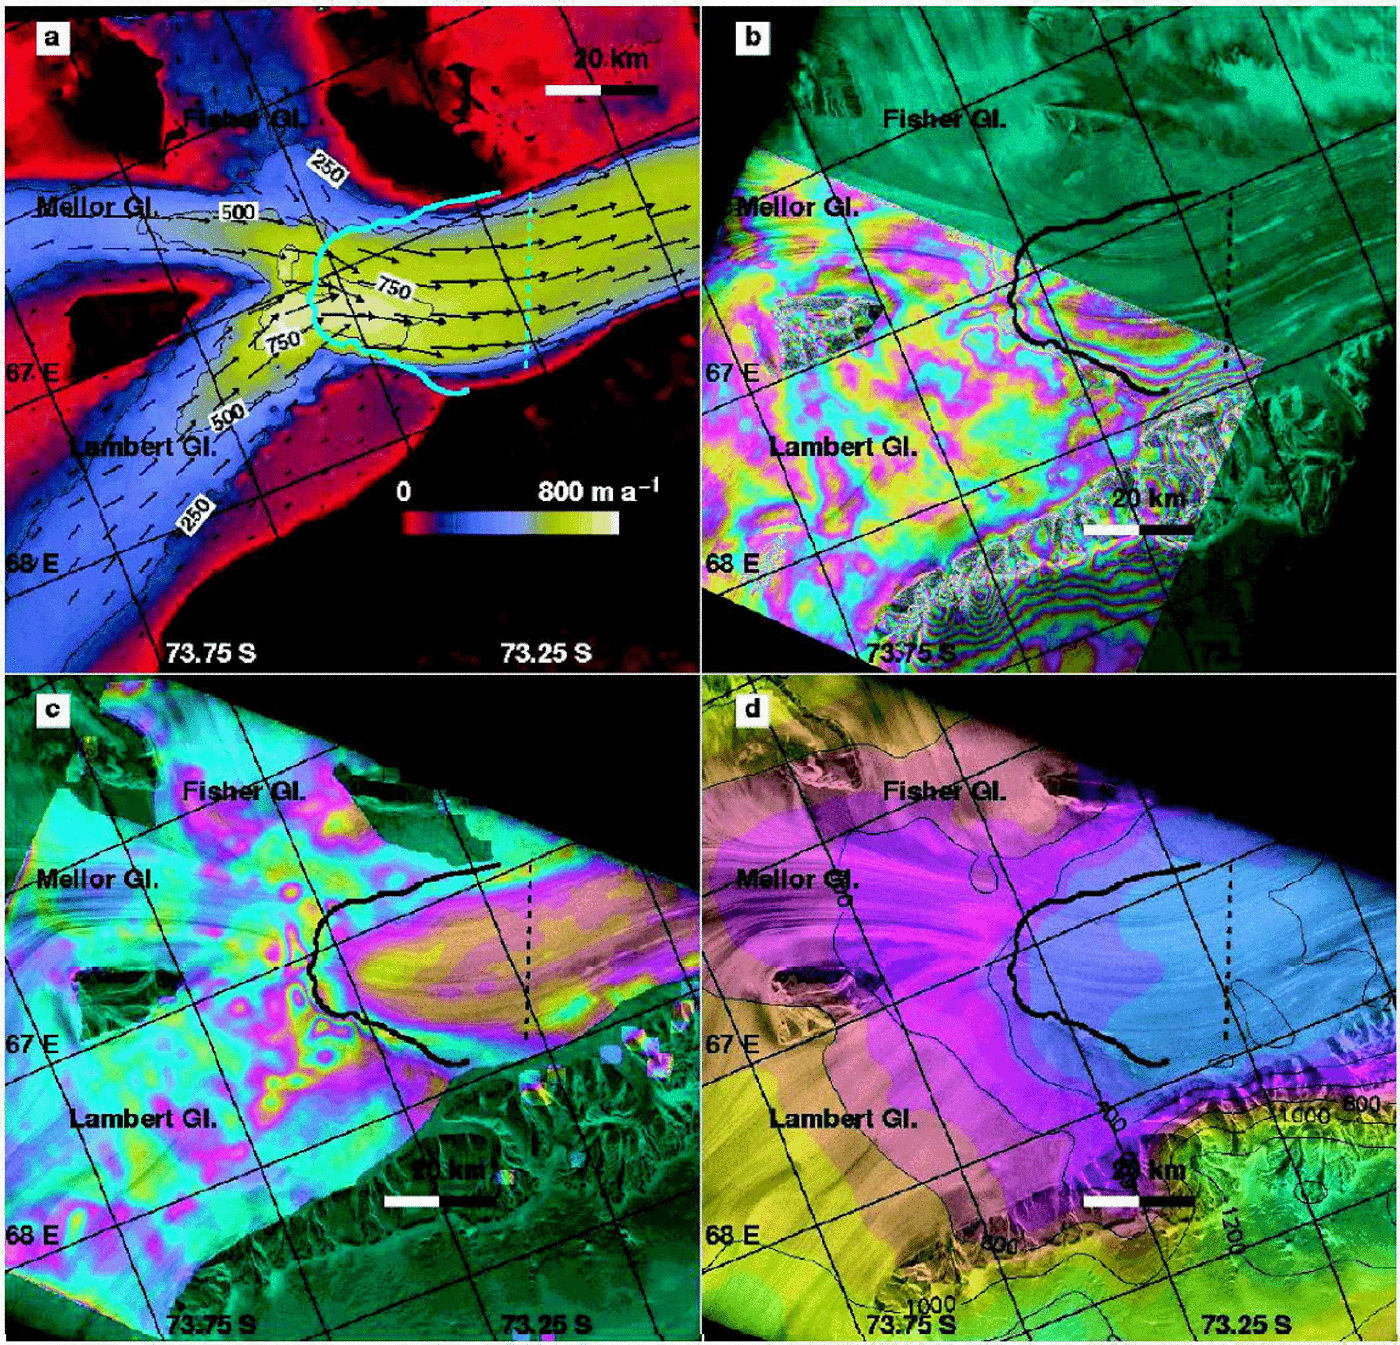
Lambert, Fisher and Mellor Glaciers, American Highland: (a) velocity map from RSAT; (b) grounding-line position from ERS; (c) difference in ice velocity between ERS three-dimensional InSAR and RSAT speckle tracking (each color cycle represents a 200 m a–1difference in ice velocity, which is largest on floating ice); and (d) topography from ERS radar altimetry. See Figure 2 for legend.
Shirase Glacier, Enderby Land: (a) velocity map from ERS; (b) grounding-line position from ERS; topography from (c) ERS InSAR and (d) ERS radar altimetry. See Figure 2 for legend.

Stancomb-Wills Glacier, Coats Land: (a) velocity map from RSAT; (b) grounding-line position from ERS; and (c) topography from ERS radar altimetry. See Figure 2 for legend.

Ice velocity is measured interferometrically combining ascending and descending passes to obtain a vector measurement of ice velocity (Reference Joughin, Kwok and FahnestockJoughin and others, 1998). This technique has an inherent precision of a couple of meters per year, in practice better than 10 ma–1. The precision is greatest when InSAR topography is used to remove the topographic signal from the interferograms, which is done here on most glaciers.
Few areas were covered by ERS ascending passes in East Antarctica (Table 1), and most descending passes observed the glaciers in a direction perpendicular to ice flow, which is least favorable for InSAR mapping. To complete the InSAR measurements, a speckle-tracking technique (Reference Michel and RignotMichel and Rignot, 1999) was applied in the along-track direction of ERS. The nominal precision of this technique is 1/30 of a pixel (which is 4 m long along-track), hence a precision in velocity of 50 ma–1with 1 day repeat-pass data. This level of precision is acceptable for fast-moving glaciers.
The precision of speckle tracking improves to a few meters per year with RSAT data collected on a 24 day repeat-pass cycle with a 5 m pixel size (Reference JoughinJoughin and others, 1999). Few 24 day interferometry passes were collected in 1997. More passes collected in late 2000 will be analyzed in the future.
Grounding-line positions are mapped using differential ERS InSAR, after removal of the topographic signal (Reference RignotRignot, 1996). In the extreme case of the deeply entrenched David Glacier, an InSAR topographic map had to be generated from an adjacent track and removed from the differential InSAR before the grounding line could be made visible (Reference Schmeltz, Rignot and MacAyealSchmeltz and others, 2002).
The grounding-line flux gate was placed downstream of the limit of tidal flexing of the glaciers, at the outer boundary of the first fringe of tidal displacement. Earlier studies indicate that this position is closest to the line of first hydrostatic equilibrium of the ice (Reference Rignot, Krabill, Gogineni and JoughinRignot and others, in press) and also least contaminated by tidal motion.
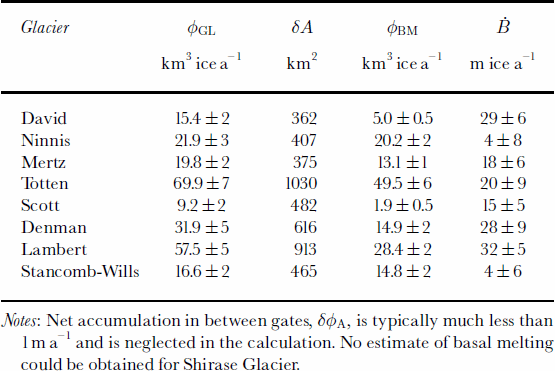
The steady-state basal melt rate of the ice shelves, B_, is deduced from the grounding-line flux, ϕGL, reported in Table 2 and the flux estimated across the gate located downstream of the grounding line, ϕBM, using conservation of mass as

where δϕA and δAare, respectively, snow accumulation and ice-shelf area in between the two gates. The gate for ϕBM is located within 10–30 km of the grounding line. Prior results in North Greenland show that basal melting is highest in the deepest part of the cavity, within the first 10–20 km of floating ice, and decreases downstream to eventually reach negative values (Reference RignotRignot, 1996). This melt pattern is broadly consistent with model predictions of basal melting (Reference Hellmer and OlbersHellmer and Olbers, 1989) and field experiments conducted on large ice shelves (Reference Jenkins and DoakeJenkins and Doake, 1991).
The downstream flux gates used here reach a compromise between measurement accuracy (the difference in flux needs to be large enough compared to the precision in ice flux), distance from the grounding line (melt rates are larger near the grounding zone) and quality of topographic mapping (topography is less reliable near the ice front). The emphasis is placed on estimating an average melt rate as close as possible to the grounding line. A more detailed analysis of spatial variations in melt rate will be pursued in the future.
Results
The estimates of grounding-line flux, ϕGL, balance flux, ϕA, and steady-state basalmelt rate, B_, are listed in Tables 2 and 3 for each glacier, along with ice thickness and velocity at the grounding-line center, and size of the drainage basin. Each glacier is now discussed in more detail, starting from the Ross Sea and moving west toward the Weddell Sea.
David Glacier
This glacier develops into the 80 km long Drygalski Ice Tongue, Victoria Land. Several glaciological studies of this sector were reported by Reference FrezzottiFrezzotti (1993) and Reference Frezzotti, Tabacco and ZirizzottiFrezzotti and others (2000). The grounding line, initially placed at the mouth of the glacier bay between Hughes Bluff and Mount Neumayer (Reference FrezzottiFrezzotti, 1993), was subsequently revised further upstream, at the mouth of David Cauldron (Reference Frezzotti, Tabacco and ZirizzottiFrezzotti and others, 2000), at the southern limit of a global positioning system (GPS) survey of the ice tongue.
InSAR indicates the grounding-line position is located 15 km upstream of the GPS survey (Fig. 2), at the foot of an icefall (Fig. 2b). The icefall, spectacular from the air (Reference SwithinbankSwithinbank, 1988), is caused by a subglacial ridge that cuts across the glacier. Below the icefall, the glacier plunges into a deep fjord-like valley, revealed by an abrupt distortion of flowlines. The flow speed is 500ma–1 at the grounding line (Fig. 2a). The glacier thickness reaches a maximum 3400m at the grounding-line center based on the radar altimetry DEM (Fig. 2d). The average grounding-line thickness across the flux gate is 1900±200m. The InSAR-derived topography (Fig. 2c) suggests a lower maximum thickness of 2900 m, yet InSAR-derived topography is less reliable at that location because of data loss from intense crevassing of the ice.
The maximum grounding-linethickness estimated here is twice that reported by Reference Frezzotti, Tabacco and ZirizzottiFrezzotti and others (2000), yet no radar echoes were successfully measured within 15 km of the InSAR-derived grounding line (personal communication from M. Frezzotti, 2000). This result illustrates the difficulty of ice radar sounding in severely crevassed sectors of thick ice. Reference Steed, Drewry and CraddockSteed and Drewry (1982) found that the glacier coincides with a deep subglacial trench that transects the whole coastal mountain range and extends inland for >300km. The only measurement of ice thickness in that sector is a radar sounding of 2530m reported by Reference SwithinbankSwithinbank (1988) above the ice-fall, on the flanks of the fast-flowing portion of David Glacier, therefore away from the deepest part of the subglacial trench. This measurement supports the presence of much thicker ice in the center of the subglacial trench.
Ice velocity was measured in vector form using ERS ascending and descending tracks (Table 1). The grounding-line flux of 15.4 km3 ice a–1 agrees with a mass accumulation of 16.4±4 km3 ice a–1. The two accumulation maps, however, differ by 24% in that sector. The drainage shown in Figure 1 includes Dome C, whereas Reference Frezzotti, Tabacco and ZirizzottiFrezzotti and others (2000) obtained a different result with a different DEM. In addition, Reference Frezzotti, Tabacco and ZirizzottiFrezzotti and others (2000) questioned the validity of existing accumulation maps in this sector in light of recent ice-core data. There are therefore uncertainties in the balance flux of this glacier. The present analysis, however, suggests conditions close to a state of mass balance (+1±4 km3 ice a–1).
Basal melting between the grounding-line position of Reference Frezzotti, Tabacco and ZirizzottiFrezzotti and others (2000) and the InSAR grounding line is 29 ±6 mice a–1 (Table 3). Further downstream, basal melting decreases by a factor of two (not shown in Table 3), which is consistent with the melt rate of 16±6 mice a–1 estimated by Reference Frezzotti, Tabacco and ZirizzottiFrezzotti and others (2000) combining radar-sounding ice thickness with GPS velocities in the same area. As expected, basal melting is highest near the grounding zone and decreases downstream.
Basalmelt rates of East Antarctic glaciers calculated near the grounding line assuming steady-state conditions as the difference between the grounding-line flux, ϕGL , minus the ice flux at a gate located downstream, ϕBM , divided by the ice-shelf area, A, in between
Ninnis and Mertz Glaciers
These two neighboring glaciers drain from the flanks of Dome C, but do not reach the dome (Fig. 1). Mertz Glacier Tongue (Fig. 3) extends 95 km into the ocean and is reported to be at its glacial maximum. Ninnis Glacier Tongue (Fig. 4) has retreated steadily since 1912 (Reference Wendler, Ahlnäs and LingleWendler and others, 1996), and underwent a major calving event in 2000 which removed half of the floating tongue (personal communication from M. Frezzotti, 2001). Ninnis Glacier drains a larger sector than Mertz Glacier, with comparable discharge velocities but lower accumulation (Table 2). Both glaciers flow nearly parallel to the satellite track direction (no ascending track exists in this sector). A comparison of ice discharge with mass accumulation suggests conditions close to a state of mass balance (Table 2): +3±3 km3 ice a–1 for Ninnis Glacier and +1.5±3 km3ice a–1 for Mertz Glacier.
Basal melting is larger on Mertz Glacier Tongue than on Ninnis Glacier Tongue under steady-state conditions (Table 3). Given the significant retreat ofNinnis ice front since early in the 20th century, it is possible that Ninnis Glacier Tongue is thinning at present, in which case conservation of mass dictates that basal melting would be higher than calculated here. The difference in bottom melt rate between the two glaciers, which are similar in thickness and size, could also express local differences in ocean forcing. No significant shift in ocean temperature or salinity is expected between the two areas, but the sub-ice-shelf cavities are different: the grounding line of Mertz Glacier expands >50 km inland from the coast, compared to only a few km in the case of Ninnis Glacier. The deeply entrenched grounding line of Mertz Glacier may favor higher rates of basal melting.
Totten Glacier
Totten Glacier is the largest discharger of ice in East Antarctica. Fast flow is concentrated along the flanks of Law Dome. Ice velocity reaches 900 ma–1 at the grounding line, with an ice thickness of about 2100 m (Fig. 5a and c). The western side of the glacier, nearly 100 kmwide, drains a vast sector of the ice sheet, at about 300ma–1, approximately perpendicular to the coastline.
The grounding line of the fast-moving part of the glacier is located >130 km inland from the ice front (Fig. 5b). InSAR reveals the presence of a large area of grounded ice, about 15 km wide, near the glacier center. This grounded area is not an ice rise since ice velocity does not decrease to zero at the center and the feature is not visible in satellite imagery. Its flexure zone, however, experiences the full range of tidal displacement (the same number of fringes are counted across it as across the flexure zone of the main trunk of Totten Glacier), hence it is grounded at all times. This feature corresponds to an ice rumple.
Another particularity of the glacier is the extension of the southernmost sector of the grounding line along two finger-shaped branches. The InSAR signal recorded in this area does not extend to the full amplitude of tidal flexing, which suggests that it is only grounded at low tide. This behavior must be due to shallow bed slopes and intrusion of ocean water at the glacier underside during high tide.
Determining the most relevant flux gate for this glacier is not straightforward because of its vast, slow-moving, nearly featureless, western front. The flux gate was selected based on the grounding-line geometry and the presence of neighboring glaciers and domes. The corresponding ice flux, 69.9±7 km3 ice a–1, is the largest of any glacier considered here, but is close to a mass accumulation of 68.8±10 km3 ice a–1 (Table 2). Basal melting in the proximity of the grounding line averages 20 ±9ma–1 (Table 3).
Denman and Scott Glaciers
Prominent flowlines are visible on Denman Glacier for several hundred km inland (Fig. 6). The glacier flows at about 1500ma–1 at the grounding line, where it splits into two branches, before punching through Shackleton Ice Shelf, almost undisturbed. The InSAR grounding line (Fig. 6b) is found several km upstream of the position inferred by Reference SwithinbankSwithinbank (1988) from Landsat imagery. The grounding-line flux of 35.1 ±5km3 ice a–1 is 2.5±10 km3 ice a–1 less than the calculated balance discharge. The uncertainty in snow accumulation is 9 km3 a–1 in this sector. It is therefore difficult to determine the state of mass balance of this glacier. Scott Glacier, to the east of Denman Glacier, flows at 500ma–1 at the grounding line, and discharges 9.2±2 km3 ice a–1. It is therefore much less active than Denman Glacier. Basal melting estimated over the main trunk of Denman Glacier (Table 3) is large. The inferred rates are lower on Scott Glacier,which is thinner.
Lambert Glacier
The grounding-line position of Lambert, Mellor and Fisher Glaciers has been subject to controversy. Reference Hambrey and DowdeswellHambrey and Dowdeswell (1994) argued that the grounding-line position of Reference Budd, Corry and JackaBudd and others (1982), subsequently used in many other studies, was inconsistent with glaciological features visible in Landsat imagery in the upstream area, and that the true grounding line ought to be located much further south. Reference Fricker, Hyland, Coleman and YoungFricker and others (2000) showed that the grounding-line position was located some 200 km upstream, based on hydrostatic equilibrium. Their analysis, however, could not locate the grounding-line position better than within several km.
InSAR confirms Reference Fricker, Hyland, Coleman and YoungFricker and others’ (2000) interpretation of a grounding-line location much further south (Fig.7). Only half of the grounding line of the Lambert/Mellor/Fisher system could be mapped with precision due to a lack of multiple InSAR coverage on Mellor and Fisher Glaciers. Grounding-line mapping was extended beyond the range provided by differential InSAR using other clues: (1) the topographic map of the ice shelf; (2) the boundary of narrow fringes (i.e. tidal flexure combined with horizontal strain) visible along the slow-moving western flank of the ice shelf; and (3) a map of the difference in ice velocity between ERS InSAR, which is contaminated by oceanic tides on the shelf, and RADARSAT speckle tracking, which has negligible contamination from oceanic tides (Fig. 7c). The resulting precision of grounding-line mapping is 100m for Lambert Glacier and 300 m for Mellor and Fisher Glaciers. Ice thickness is estimated to be reliable to within±200m.
Ice velocity is 800ma–1 at the grounding line. Ice thickness is 3000m at the glacier center, based on hydrostatic equilibrium (Table 2). The combined grounding-line flux from Lambert, Mellor and Fisher Glaciers calculated from ERS vector mapping(ascending and descending tracks) and the grounding-line flux from RSAT 24 day speckle tracking differ only by 0.6 km3 a–1 or 1%. The grounding-line flux obtained using RSAT data, 57.5±5 km3 ice a–1, exceeds the calculated mass input of 55.2 ±1km3 ice a–1 by 4±9%, which suggests a glacier system close to balance. The drainage basin of Lambert Glacier is therefore almost certainly not thickening rapidly, and perhaps even thinning.
Basal melting in the vicinity of the grounding line exceeds 32 ±5mice a–1 (Table 3). With a flux gate located near the outer edge of the scene in Figure 7, Ḃdecreases to 26 mice a–1 over an ice-shelf area of 1330 km2. More than half the glacier thickness melts in the first 1000 km2 ice-shelf area. The high value of basal melting recorded near the grounding zone explains why prior estimates of the glacier system mass balance determined massive thickening in this sector (Reference AllisonAllison, 1979). Mass losses between the new and old grounding lines were not accounted for in prior estimations of the mass budget of this glacier system.
Shirase Glacier
This glacier flows down a narrow trench at 2400ma–1 near the grounding line and 3000ma–1 on the floating tongue. Skallen Glacier, east of Shirase Glacier, flows at 500ma–1 (Fig. 8). The ERS DEMis unreliable near the grounding line of Shirase Glacier and on the ice shelf, as can be judged from the InSAR altimetry comparison in Figure 8c and d. Using InSAR topography, ice thickness at the grounding line, about 900 m, was estimated with a precision no better than 200 m. Combined with a 10 ma–1 uncertainty in ice velocity, this yields a precision in mass flux of 22%. The glacier mass discharge of 15.1±3 km3 ice a–1 is only 1.8±3 km3 ice a–1 lower than the calculated balance flux, which suggests conditions close to mass balance.
Basal melting is difficult to estimate on the ice shelf due to a lack of quality thickness data or ice-shelf elevation (the InSAR topography is contaminated by oceanic tides).
Stancomb-Wills Glacier
This glacier flows at 700ma–1 near its grounding line, and accelerates to >1200ma–1 on its fan-shaped ice tongue (Table 2; Fig. 9). The floating tongue experiences little shear along its sides according to the InSAR data, so it is practically unconfined. The neighboring Riiser–Larsen Ice Shelf is nearly stagnant. The estimated mass flux of Stancomb-Wills Glacier, 16.6±2 km3ice a–1, is 3 times less than in Reference SwithinbankSwithinbank (1988), but in reasonable agreement (the mass balance is 0.9±3 km3 ice a–1) with mass accumulation in the interior.
The inferred rate of basal melting is low near the grounding line, only 4 ±8 ma–1.With the flux gate located even further downstream, over an ice-shelf area twice the one considered in Table 3, a similar calculation shows basal freezing of a few meters per year (not shown in Table 3). Basal melting is therefore much less efficient in that sector compared to other glaciers, and the ice tongue as a whole is in fact likely dominated by basal freezing.
Stancomb-Wills Glacier Tongue is glued together by an ice melange (Reference Rignot and MacAyealRignot and MacAyeal, 1998), probably composed of blown snow, sea ice and broken icebergs, which is mechanically competent (the InSAR deformation field is nearly continuous across the boundaries between ice tongue and melange), hence thick enough to transmit stresses. The slight bend in fringes observed across transition boundaries between ice tongue and ice melange decreases downstream from the grounding line, which indicates that the thickness of the ice melange increases with time. This evolution pattern is consistent with bottom freezing.
Discussion And Conclusions
This study provides a major revision of grounding-line positions in East Antarctica. This mapping exercise is a unique contribution of the ERS tandem mission. It should serve as a reference for measuring future grounding-line migration of Antarctic glaciers. The detection of grounding-line migration is a powerful way to estimate local mass balance, independent of snow accumulation and bottom melting (Reference RignotRignot, 1998).
In several sectors (e.g. David and Lambert Glaciers), the grounding line is detected several tens of km inland of its prior-determined position. This mislocation has major consequences for the estimation of the mass budget of the glaciers: those glaciers are not massively thickening at present, and snow accumulation over the drainage basins is not unreasonably represented in existing digital maps. Most glaciers considered in this study in fact appear reasonably close to mass equilibrium.
The last row of Table 2 totals the contribution from all glaciers. Total mass discharge is 260.5 ±11km3 ice a–1, which is 7 ±19 km3 ice a–1 (3±7%) less than the total balance discharge of 267.4±15 km3 ice a–1. The nine glaciers together drain about one-quarter of East Antarctica’s grounded ice. The result therefore suggests that there is no large mass imbalance in the sector of East Antarctica that does not drain into the Ross and Filchner–Ronne Ice Shelves. For comparison, a similar mass-budget approach applied to West Antarctic glaciers (Fig. 1) reveals a strongly negative mass balance in the Amundsen Sea sector (Reference RignotRignot, 2001; Reference Rignot, Vaughan, Schmeltz and DupontRignot and others, 2002). From these results we may conclude that the apparent contribution of East Antarctic glaciers to sea-level rise is negligible at present. The only significant contribution from the Antarctic ice sheet (i.e. excluding the peninsula) is in the Amundsen Sea sector of West Antarctica.
To improve upon the estimates of mass balance presented here, better ice-thickness estimates are needed along all grounding zones. Upcoming satellite missions will improve the determination of the geoid and the precision of ice-shelf elevations, yet direct measurements of ice thickness would be preferable to improve the precision of mass fluxes.
Basal melting was estimated assuming steady-state conditions, which are not known for certain. Conservation of mass dictates that if the ice shelves are thinning, then basal melting is larger than calculated here. Conversely, basal melting is overestimated if the ice shelves are gaining mass. Information on the rate of ice-shelf thickness change is now becoming available from ERS radar altimetry (personal communication from H. J. Zwally, 2001). Ice shelves along the West Antarctic coast thin by 20–60 cma–1, which implies a thinning of 1–4mice a–1. These thinning rates are large compared to those recorded on large ice shelves (nearly zero), but small compared to the basal melt rates listed in Table 3.
Basal melt rates reach a few meters per year near the grounding zones of the glaciers draining into the Ross, Ronne and Filchner Ice Shelves (e.g. Reference Jenkins and DoakeJenkins and Doake, 1991), but the average melt rate of those large ice shelves is only about 20 cm ice a–1. In North Greenland, basal melt rates reach 25ma–1 within 10 km of the grounding zones and average 5–8ma–1 over the entire floating area (Reference RignotRignot, 1996; Reference Rignot, Gogineni, Krabill and EkholmRignot and others, 1997, in press). This study shows that similarly high values are encountered in the Antarctic, where ice shelves are more widespread than in Greenland. Basal melting averages 24 ±7mice a–1 in Table 3, except for two glaciers where B _averages 4±7mice a–1. The fact that basal melting tends to be higher in the Antarctic than in North Greenland is consistent with the deeper draft of Antarctic glaciers (the thickness of grounding zones of major North Greenland glaciers is 600 m vs 900–3000m in the Antarctic). Ice reaching greater depths is more likely to melt due to the pressure dependence of the melting point of ice. Even higher melt rates have been inferred in Pine Island Bay (Reference Jacobs, Hellmer and JenkinsJacobs and others, 1996; Reference Rignot and MacAyealRignot, 1998, Reference Rignot2001).
The detection of low rates of basal melting in some regions requires further investigation. The result suggests that basal melting does not simply scale with ice thickness. One striking common feature of low bottom-melt producers such as Ninnis and Stancomb-Wills Glaciers is that their grounding line is located close to the coast. Glaciers with a grounding line located deep inland of the coastline therefore tend to experience higher rates of bottom melting than those with a grounding line located near the coast. Coastal geometry could be an important control on the efficiency of bottom melting, which should be investigated in future studies.
One consequence of the importance of basal melt processes in the Antarctic is that iceberg calving may not be the dominant term of mass attrition on floating ice (Reference Jacobs, Hellmer, Doake, Jenkins and FrolichJacobs and others, 1992). Arevision of basal melt estimates to higher values would imply a more negative mass balance of Antarctic ice.
Another consequence is that Antarctic glaciers are more sensitive to changes in ocean conditions than presumed earlier (e.g. based on studies of bottom melting underneath large ice shelves). Reference Warner and BuddWarner and Budd (1998) and Reference Huybrechts and WoldeHuybrechts and de Wolde (1999) showed that enhanced basal melting is an efficient way to collapse an ice sheet. The magnitude of basal melting used in their simulations was no more than a few mice a–1.The melt rates discussed here are one order of magnitude larger. It is not clear how ice-sheet models could maintain the ice sheet in a state of mass balance if they included the melt rates quoted here. While these models have their own limitations, this raises the question of the stability of Antarctic ice shelves in the present climate. Are ice shelves able to sustain those high rates of melting? Are ocean conditions leading to those high rates of melting changing at present? How do ice streams and glaciers react to changes in bottom melting? More extensive measurements of basal melting, using in situ and/or remote-sensing methods, would be timely.
Acknowledgements
This work was performed at the Jet Propulsion Laboratory, California Institute of Technology, under a contract with the National Aeronautics and Space Administration, Polar Program. The European Space Agency and the Canadian Space Agency are acknowledged for collecting and distributing the radar data employed in this study.



