

Introduction
Coffee, Coffea arabica L. and C. canephora Pierre ex A. Froehner (Gentianales: Rubiaceae), is grown on over 10 million ha from 80 countries in tropical to subtropical regions (ICO, 2014). In Hawaii, an estimated 16.5 million kg of coffee berries were produced from 2770 ha in the most recent (2016/17) harvest season (USDA-NASS, 2017). The coffee berry borer (CBB), Hypothenemus hampei Ferrari (Coleoptera: Curculionidae), the most destructive insect pest of coffee worldwide (Jaramillo et al., Reference Jaramillo, Borgemeister and Baker2006; Vega et al., Reference Vega, Infante, Johnson, Vega and Hofstetter2015) was reported in the Big Island Hawaii in 2010 (Burbano et al., Reference Burbano, Wright, Bright and Vega2011) and subsequently in Kau (2011), Oahu (2014) and Maui (2016) (Hawaii Department of Agriculture, 2017). In response, the Hawaiian Division of Plant Industry has introduced various inspections and restriction on the movement of coffee and other CBB hosts. The University of Hawaii Extension Service provides recommendations for the management of the CBB in Hawaii, including monitoring, field sanitation, pesticide applications, post-harvest and shipping protocols (Kawabata et al., Reference Kawabata, Nakamoto and Curtiss2015).
Due to the risks to the industry, integrated methods are needed to manage CBB on the islands. Sampling is fundamental to develop decision aids for control measures and to help evaluate their effectiveness (Moon and Wilson, Reference Moon, Wilson, Radcliffe, Hutchison and Cancelado2009). Various sampling strategies have been proposed for CBB in other regions of the world (Baker, Reference Baker1989; Bustillo et al., Reference Bustillo, Cardenas, Villalba, Orozco, Benavides and Posada1998; Ruiz et al., Reference Ruiz, Uribe and Riley2000; Pereira et al., Reference Pereira, Vilela, Tinoco, De Lima, Fantine, Morais and França2012; Fernandes et al., Reference Fernandes, Picanço, Fernandes, Dângelo, Souza and Guedes2015; Mariño et al., Reference Mariño, Vega, Garcia, Verle-Rodrigues, Garcia and Bayman2017). These sampling methods rely on scouting coffee berries for infested fruits and the use of alcohol traps to capture the colonizing CBB female. However, little research is available regarding the optimal sampling strategies for CBB in the Hawaiian coffee agroecosystem.
The phenology of the CBB is correlated with the coffee growth stage, climate and regional management practices (Rodríguez et al., Reference Rodríguez, Cure, Gutierrez, Cotes and Cantor2013). In Hawaii, most coffee is produced on small farms (<2 ha) located along the humid western and southern regions where growing conditions are suitable (Bittenbender and Easton Smith, Reference Bittenbender and Easton Smith2008). Because farms are managed by a relatively small number of employees and seasonal workers, and labour costs are relatively high (Aristizábal et al., Reference Aristizábal, Bustillo and Arthurs2016), simple and efficient scouting methods are needed. Pest abundance locally can be estimated based on the number of individuals per sample unit or the proportion of infested units. The number of samples required to accurately determine pest population correlates with the relative density and aggregation level (patchiness). Consequently, recommended sampling methods can be estimated, based on these indices (Southwood and Henderson, Reference Southwood and Henderson2000).
The objective of this study was to test a scouting plan for CBB, originally developed in Colombia (Bustillo et al., Reference Bustillo, Cardenas, Villalba, Orozco, Benavides and Posada1998), for coffee growers in Hawaii. Since labour costs are high, we tested a modified sampling method to reduce the time spent counting in the field and scouting costs. The goal was to develop a sequential sampling plan that helps growers determine when control operations are warranted. Sequential sampling models allow an estimate of the number of samples required to achieve an estimate of pest density with a given precision level. Such information can be used to help develop pest management thresholds and estimate the relative effectiveness of control measures.
Materials and methods
Field sites
Studies were conducted on 17 commercial coffee farms, 11 located in Kona and six in Kau districts, Big Island, Hawaii, throughout the 2016/17 growing season, i.e., from May 2016 to February 2017. Coffee farms varied from 0.5 to 8 ha, with planting densities of 1800–2750 trees/ha. In Kona, farms grew C. arabica cv. Typica and were located at 268–624 m asl, while in Kau farms grew both Typica and Caturra and were located 400–600 m asl. Coffee plants were pruned ‘Kona style’ annually and supported multiple (4–10) verticals per tree (Bittenbender and Easton Smith, Reference Bittenbender and Easton Smith2008). Peak flowering occurred during February and April 2016 in Kona and March to June in Kau. Farmers applied the entomopathogenic fungus Beauveria bassiana (i.e., BotaniGard®ES and Mycotrol® ESO) either alone or combined with kaolin clay (Surround® WP) against the CBB from May to July, and again in December in Kau. Harvesting was conducted from late August to early December (Kona) and September to February (Kau), with picking conducted at 3–5 week intervals at these times.
Sampling method
In each farm, a single lot (≈1 ha) was selected for sampling the CBB in the berries. The standard method was based on the ‘30-tree sampling plan’ originally proposed by the National Coffee Research Centre (Cenicafé) in Colombia (Bustillo et al., Reference Bustillo, Cardenas, Villalba, Orozco, Benavides and Posada1998). In this approach, coffee growers sampled 30 trees per ha following a zig-zag transect across each lot. Trees were sampled at approximately equidistant intervals. One lateral branch bearing at least 45 green berries was selected in the middle of each sampled tree. All green berries (>70 days old) were examined and counted. The number of berries having a hole (diagnostic of CBB entry) was counted to estimate infestation rate.
Additionally, where available, 3–4 CBB-infested green berries per sampled tree (~100 per ha) were collected and cut open to determine the degree of penetration (AB/CD position) of the CBB. In an AB position, the colonizing CBB adult female has bored into the berry but not reached the endosperm. In the CD position, the CBB has penetrated the endosperm and started reproduction. In the AB position, the CBB is considered shallow enough and thus more vulnerable to contact insecticides (Bustillo et al., Reference Bustillo, Cardenas, Villalba, Orozco, Benavides and Posada1998; Aristizábal et al., Reference Aristizábal, Lara and Arthurs2012). The mature, over-ripe and dry berries were not sampled, because we anticipated that they would be removed during the next harvest round. Monitoring was started when most berries were 60–90 development days in Kona and 60–100 days in Kau. Evaluations were conducted at 2–4 week intervals through the end of the harvest.
Spatial distribution of CBB
The spatial distribution (mean-to-variance relationship) for CBB infestation rates across different farms was described using the Taylor's power law (Taylor, Reference Taylor1961) defined by the linear model:
 $$\begin{equation*}
{\rm{Log}}\;{s^2} = {\rm{log}}\;a + b\;{\rm{log}}\;m
\end{equation*}$$
where s 2 = variance, m = mean and the constants a (intercept) and b (slope). The CBB distribution was established based on the slope (b) parameter, for which a value b ≥ 1 indicates an aggregated spatial distribution, following a negative binomial distribution, and b < 1 indicates a uniform spatial distribution, following a Poisson distribution (Taylor, Reference Taylor1984). A linear mixed model which fitted a random effect for intercepts and slopes of farms sampled over time (repeated measures) was compared to the linear model. The models for all 165 individual evaluations were computed with R software and compared based on adjusted R 2 values (R Core Team, 2015).
Sequential sampling plan
A model to estimate the optimum number of coffee branches (one branch per tree) to sample for a pre-determined precision level was estimated based on the formula proposed by Green (Reference Green1970). This model requires sequential and enumerative sampling of the number of infested berries counted per branch for the number of sampled trees until a stop-line value is reached. The ‘30-tree sampling plan’ noted above was conducted on 17 different coffee lots. A representative branch (mid tree height) was selected per tree. The mean number of infested berries per branch was then calculated for a desired precision level. Since the Taylor's power law showed earlier high correlation (mean-to-variance relationship) for the number of the infested green berries/branch, the parameters (a) and (b) were used to calculate the sequential plan in Green's formula:
 $$\begin{eqnarray*}
{\rm{Log}}(Tn) &=& {\rm{log}}(D ^{\wedge} 2/a)/(b - 2)\nonumber\\
&& +\, [(b - 1)/(b - 2)] {\rm{log}}(n)
\end{eqnarray*}$$
where Tn represents the cumulative number of infested green berries counted on n coffee branches samples, n is the total number of sample units (branches from different coffee trees), D represents the fixed level of precision (coefficient of variation) and a and b correspond to Taylor's power law coefficients for the number of infested berries per branch. Fixed precision levels (D < 0.25) are commonly used for research purposes and for integrated pest management programmes (Southwood and Henderson, Reference Southwood and Henderson2000). In our study, three fixed precision levels (D = 0.10, 0.15 and 0.25) were used. For the model estimates, we used 1.5–2.5% CBB infestation rate (0.5–1 infested berries per branch in our surveys), which corresponds to suggested prior thresholds for CBB injury (Baker, Reference Baker1999; Fernandes et al., Reference Fernandes, Picanço, Campos, Bastos, Chediak, Guedes and Da Silva2011; Pereira et al., Reference Pereira, Vilela, Tinoco, De Lima, Fantine, Morais and França2012).
Modified sampling strategy
Since counting the total number of the berries on branches is time consuming, a modification of the ‘30-tree sampling plan’ (Cenicafé method) was tested. In the modified method, only the number of infested berries was counted and not the total number of berries per branch. A comparison of both sampling plans was conducted on 14 coffee farms from April to June 2017. In total, 30 paired evaluations using either the standard or modified sampling method were conducted. Correlations between the proportion and the number of infested berries per branch were determined. The time (in min) required to perform the standard and modified sampling plan was compared. In addition, the time for cutting open ~100 infested berries to determine the AB/CD position according to Bustillo et al. (Reference Bustillo, Cardenas, Villalba, Orozco, Benavides and Posada1998) description was assessed separately. Significance of differences between the standard and modified plan was assessed with the t-student test and Pearson's coefficients. All statistical analyses were run in R software (R Core Team, 2015).
Relationships between the CBB infestation in field and damage in processed coffee
The relationship between CBB infestation rate in the field during the berry growing season (May to September) and damage to the green dried beans (processed coffee) during harvest was assessed. A good correlation between these variables would support the value of the ‘30-tree sampling plan’. Measurements were taken on 16 farms in Kona and Kau during 2016. At each farm, two samples of 2.5 kg of cherries (producing 500–600 g dried green coffee) were collected during harvesting (October and November). Berries were collected from two representative branches in separate coffee trees in each lot, and weighed and processed. After drying, the parchment coffee was removed and the coffee beans passed through different screen sizes and rated for damage. The coffee quality was assessed from samples based on Hawaiian classifications for ‘Extra fancy’, ‘Fancy’, ‘Number one’ and ‘Prime’. These categories considered all defects (including but not restricted to CBB damage). Total defects from processed coffee was included in the analysis. The relationship between field infestation rate in the weeks prior to harvest and percent total defects (including CBB damage) in processed green coffee was analysed by Pearson's coefficient using R software (R Core Team 2015).
Results
Seasonal trends
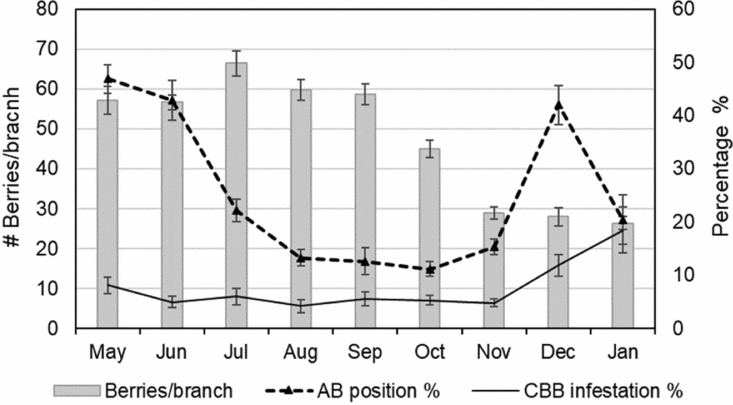
Overall, the ‘30-tree sampling plan’ showed that CBB infestation rates averaged 5.8 ± 0.5% (range 2.3–21.6%) at different sample periods (Fig. 1). Peak infestation was observed in December in Kona (11.8%) and January in Kau (18%), likely due to later harvest activity in that district. The CBB in AB position was highest in May and June (i.e., >40%) with a similar peak in December. The number of green berries decreased after October, as they matured into cherries. While there were generally >50 green berries per branch (sample unit) during the growing season (May to September), this number was reduced to 30 or less during harvesting (November to December in Kona and December to January in Kau).
Number of green berries per branch, CBB infestation rate (%) and CBB in AB position (%) during the 2016/17 coffee season in coffee plantations from Kona and Kau Districts, Hawaii. Data are mean ± SEM per month (n = 165 observations).

Spatial distribution of CBB
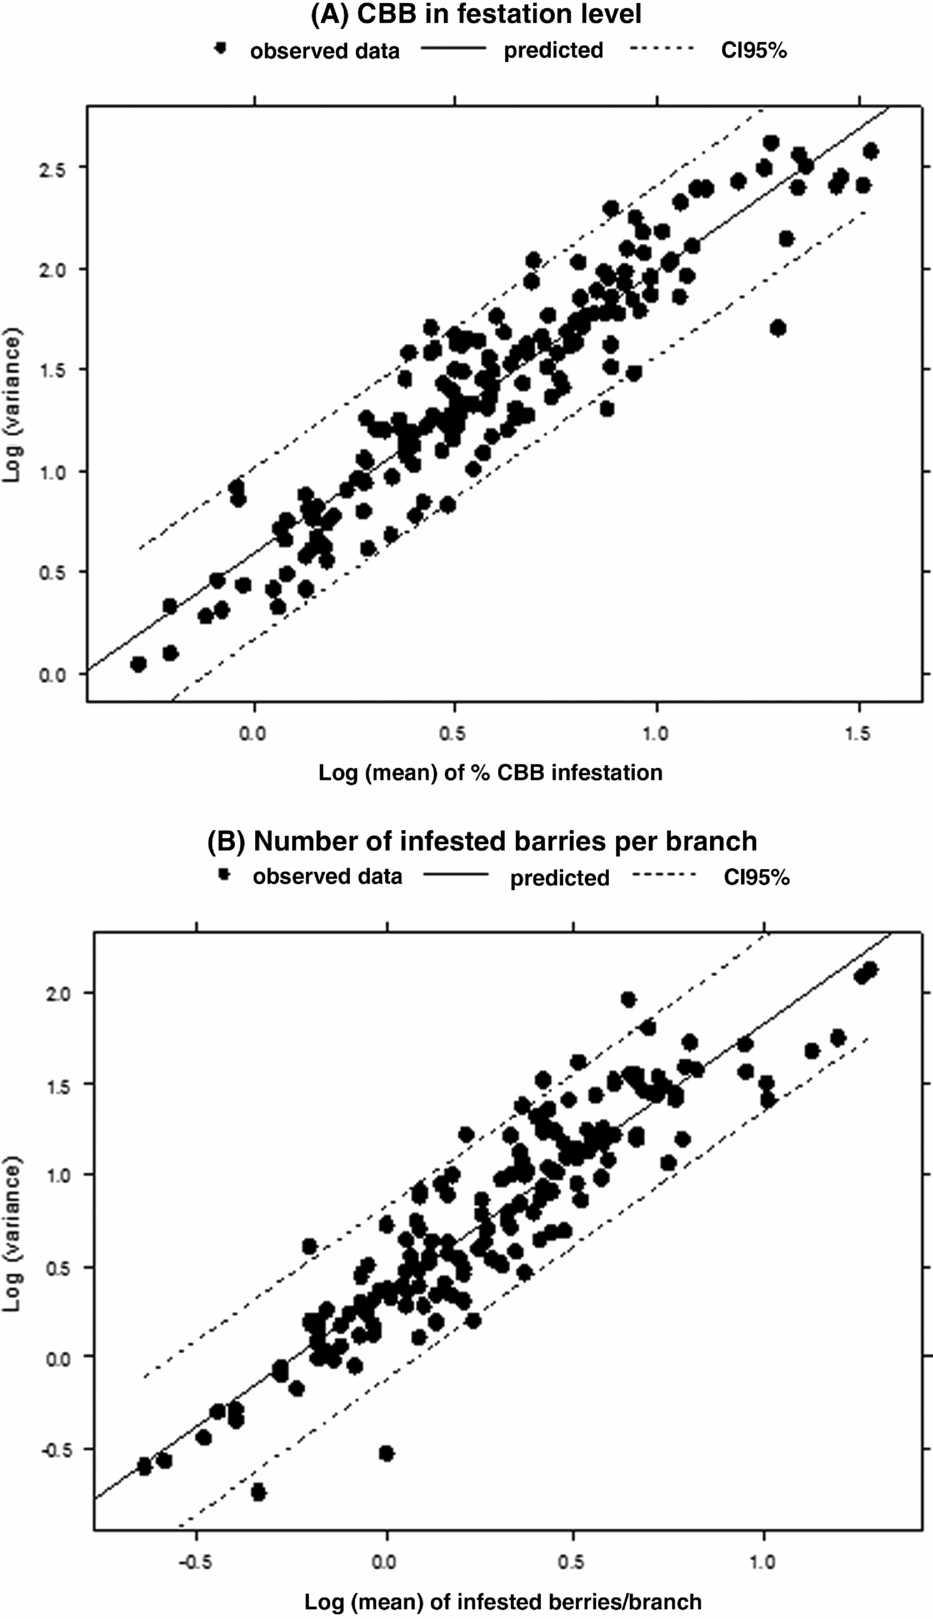
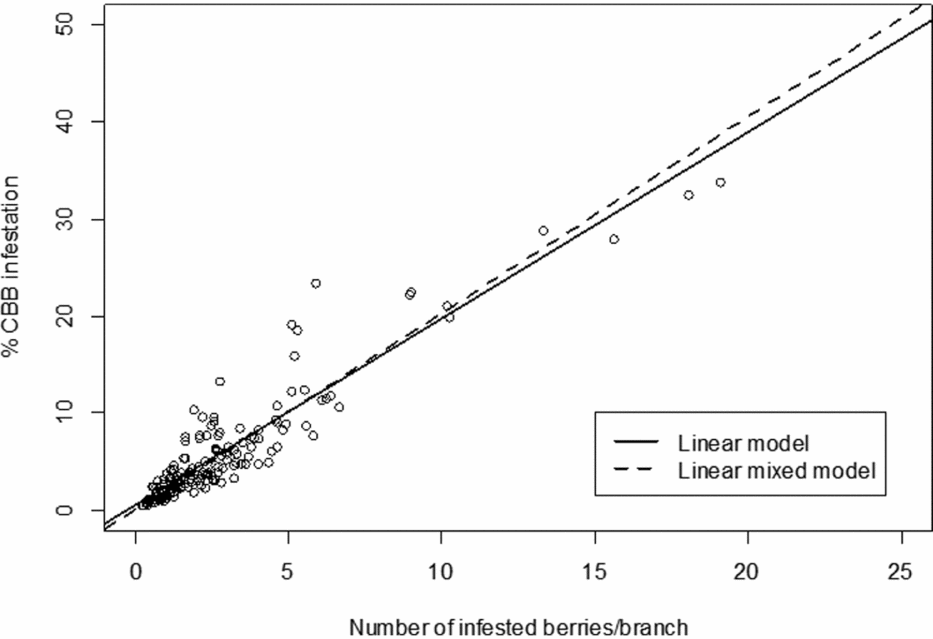
Taylor's power law revealed a significant positive correlation between variance and mean for CBB infestation rate and for number of infested berries per branch (Fig. 2). Both variables followed an aggregated spatial distribution (slope > 1) with negative binomial distribution (Table 1). The linear model revealed a good fit (R 2 = 0.85) between the CBB infestation rate and number of infested berries per branch (F = 961.4; df = 1163; P < 0.0001) (Fig. 3). The model was slightly improved (R 2 = 0.91) when random effects were included to account for variations among farms and evaluation times (F = 1120; df = 123; P < 0.0001).
Taylor's power law for log of mean CBB infestation rate (A) and number of infested berries per branch (B) for all farm observations (n = 165).

Estimates of spatial distribution parameters (Taylor’ power law) for coffee berry borer (CBB) on green berries from 30 branches in coffee trees from 17 coffee plantations in Hawaii

1 Model fitted to CBB data based on the number of infested berries per branch/tree, rather than percentage infestation rate.
2 Random effect added to the modified model for slope and intercept for evaluation times and farms.
Relationship between CBB-infestation rate and number of infested berries per branch based on data collected in 17 coffee farms in Hawaii (165 evaluations). Linear regression (solid) explained by the equation CBB infestation rate (%) = 1.92 * infested berries/branch + 0.52 (R 2 = 0.85); linear regression (dashed) including random effects (farm and time) is explained by CBB infestation rate (%) = 2.02 * infested berries/branch + 0.05 (R 2 = 0.91).

Sequential sampling plan
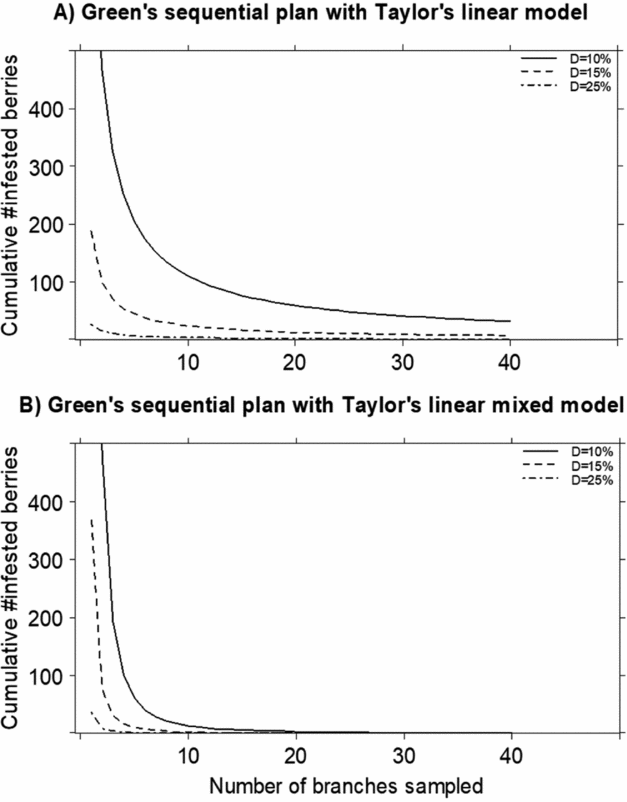
According to Green's stop line sampling plan, the number of coffee branches (sample unit) required to estimate a hypothetical 1.5–2.5% CBB infestation rate with a precision level of 10% ranged from 35 to 50, or between 30 and 41 with random effects included (Table 2, Fig. 4). These estimates indicate that the standard ‘30-tree sampling plan’ is relatively accurate at estimating CBB populations at these infestation levels, at least at the 15% precision level.
Number of coffee branches required to estimate means of 1 and 0.5 CBB infested berries/branch at different precision levels (D) according to Green's sequential sample plan

Sequential sampling models for CBB using Green's stop-line (using equation coefficients from Taylor's linear [A] and linear mixed [B] model) based on the relationship between number of sampled branches and cumulative number of infested berries at different precision levels (D).

Validation of modified sample plan
There was little difference overall between the standard (Cenicafé) and modified sampling plans, based on the significant correlations between both plans (Table 3). However, the modified sampling plan required significantly less time to complete (35 min), representing a 27% time saving (Table 4). In addition to the time spent walking and counting, an average of 24 ± 1 min was required to open and inspect approximately 100 infested berries/farm (evaluation of CBB positions).
Correlations between CBB infestation rate estimated by two sampling methods, the standard and modified ‘30-tree sampling plan’ without (#1) and with (#2) fixed effects for farm and time

+ Data based on measurements from 30 evaluations in 14 coffee farms in Hawaii.
Comparison of accuracy and scouting time for field workers performing the standard and modified ‘30-trees sampling plan’ without (#1) and with (#2) random effects for farm and time

Data are mean ± SEM from 30 paired evaluations in 14 coffee farms; +denotes means are significantly different according to t-student test (t = 7.87, df = 48, P < 0.00001) for the variable ‘time’.
Relationships between the CBB infestation level and damage on green dried coffee
In our study, CBB field infestation levels during August and September (beginning of harvest season) from 16 farms averaged 5.8 ± 1.4%, while damage (total defects) to the processed dried green coffee from samples taken from these farms averaged 5.2 ± 1.3%. Analysis (Pearson's coefficients) using each farm revealed significant correlations between these two variables, i.e., r = 0.82 (df = 114, P < 0.0001).
Discussion
We evaluated sampling strategies for CBB in berries in small coffee farms in Hawaii, a region where this pest has become problematic in recent years (Messing, Reference Messing2012; Aristizábal et al., Reference Aristizábal, Bustillo and Arthurs2016). Using a sequential sampling model, we determined that the ‘30-tree sampling system’ first described in Colombia (Bustillo et al., Reference Bustillo, Cardenas, Villalba, Orozco, Benavides and Posada1998) and used for many years (Duque and Chaves, Reference Duque and Chaves2000; Trujillo et al., Reference Trujillo, Aristizábal, Bustillo and Jiménez2006) was a good predictor of CBB at relatively low infestation rates, i.e., ≤1% of berries. Management thresholds for CBB damage in the range of 1–2% have been suggested in other regions (Baker, Reference Baker1999; Fernandes et al., Reference Fernandes, Picanço, Campos, Bastos, Chediak, Guedes and Da Silva2011; Pereira et al., Reference Pereira, Vilela, Tinoco, De Lima, Fantine, Morais and França2012). The sequential sampling plan has been applied to other insect pests of coffee (Villacorta et al., Reference Villacorta, Wilson, Cfarrilla and Ochoa2006; Greco and Wright, Reference Greco and Wright2013). It is possible that additional samples might be required in cases where CBB populations are more highly aggregated compared with what we observed.
The ‘30-tree sampling system’ can become expensive, especially in large farms. This problem is exacerbated in Hawaii, where labour costs are high (Aristizábal et al., Reference Aristizábal, Bustillo and Arthurs2016). Our results suggest a simplification can be achieved through only counting infested green berries to estimate the proportion of infested berries in coffee lots. This second approach saved time (27% on average), or alternatively would allow more coffee lots to be sampled in the same time period. However, our findings indicate that sampling effort (time) for green berries may increase later in the season. After October, as berries ripen, the proportion of green berries declines (i.e., >30 berries per branch between November and January), making their detection more time consuming. Recently, Pulakkatu-thodi et al. (Reference Pulakkatu-thodi, Gutierrez and Wright2017) suggested another alternative sampling method involving counting CBB from several randomly selected ‘berry clusters’ (berries on a single branch node), rather than all berries on a single branch. Using this approach in the same regions in Hawaii, they reported that 26.4% and 53.6% fewer berries were sampled using the five-cluster and three-cluster method, respectively, without a significant difference in accuracy when compared with samping an entire branch. Pulakkatu-thodi et al. (Reference Pulakkatu-thodi, Gutierrez and Wright2017) also suggested an upper limit of 50–60 berries per branch sufficient to estimate CBB infestation.
These sampling plans can also be potentially improved through considering the proportion of CBB that have penetrated the berry endosperm. In an AB position (shallow penetration), the CBB is most susceptible to contact insecticides (Bustillo et al., Reference Bustillo, Cardenas, Villalba, Orozco, Benavides and Posada1998). In our farms, many growers applied B. bassiana alone or mixed with kaolin clay more frequently in the early season (May to July), when we recorded highest proportion of the CBB in an AB position. When green berries are young (<110 days old), they are difficult for the CBB to penetrate; Ruiz and Baker (Reference Ruiz and Baker2010) reported that colonizing CBB females may require 90 days to penetrate and oviposit in berries aged between 60 and 110 days. The need to spray is also based on the severity of the CBB infestation as well as their susceptibility to contact insecticides. In Hawaii, some farmers use 2% infestation and >25% CBB in AB position as a guideline for applying B. bassiana or other approved insecticides. In this way, they are able to increase the effectiveness of B. bassiana applications (Aristizábal et al., Reference Aristizábal, Johnson, Shriner, Hollingsworth, Manoukis, Myers, Bayman and Arthurs2017a).
We also determined that infestation rates at harvest were similar and significantly correlated with total defects on the processed coffee. While this is useful information for coffee growers, we note that the nature of this relationship is not always the same. In Colombia, Bustillo et al. (Reference Bustillo, Cardenas, Villalba, Orozco, Benavides and Posada1998) estimated that CBB infestation rates ≈5% at the beginning of harvest produced ≤2.5% damage in parchment coffee, with similar ratios at higher infestation rates, i.e., 11–25% CBB infestation resulted in 6–11% damage to parchment coffee. Aristizábal et al. (Reference Aristizábal, Lara and Arthurs2012) reported ≈5% CBB field infestation produced ≥ 2.3% damage on processed coffee. The relationship between damage in the field at harvest time and that resulting in processed coffee may be affected by several factors, including harvesting delays, sampling accuracy and the extent to which coffee cherries from multiple lots are mixed together (Bustillo et al., Reference Bustillo, Cardenas, Villalba, Orozco, Benavides and Posada1998; Bustillo, Reference Bustillo2006).
In summary, our data provide useful information for coffee growers to help manage CBB. As a practical approach, counting the number of infested green berries from one branch on 30 trees per coffee lot should allow adequate precision for most purposes. Commercially available (or home-made) alcohol traps are a supplementary method to monitor and help reduce the numbers of colonizing female CBB (Messing, Reference Messing2012; Bittenbender et al., Reference Bittenbender, Wright and Greco2017). These traps may also supplement the lengthier fruit inspections, to save additional monitoring effort (Aristizábal et al., Reference Aristizábal, Shriner, Hollingsworth and Arthurs2017b).
Acknowledgements
This work was funded through a Synergistic Hawaii Agriculture Council (SHAC) TASC Grant. Technical support was provided by researchers at the Daniel K. Inouye US Pacific Basin Agricultural Research Center (USDA/PBARC) and the Cooperative Extension at University of Hawaii at Manoa. We are grateful to all coffee growers from Kona and Kau Districts for their valuable participation in this research. Opinions and recommendations in this publication are the authors, and do not necessarily reflect the views of the USDA. USDA is an equal opportunity provider.