

INTRODUCTION
Signs of cognitive decline often begin a decade or more before diagnosis of dementia due to late-onset Alzheimer’s disease (AD), a neurodegenerative disease associated with greatly impaired cognition and daily functioning (Price et al., Reference Price, McKeel, Buckles, Roe, Xiong, Grundman and Dickson2009; Price & Morris, Reference Price and Morris1999). After age, presence of one or more apolipoprotein E (APOE) ɛ4 alleles is the strongest predictor of risk of late onset AD (Strittmatter & Roses, Reference Strittmatter and Roses1996; Tang et al., Reference Tang, Maestre, Tsai, Liu, Feng, Chung and Tycko1996), particularly among non-Hispanic Caucasians (Tang et al., Reference Tang, Stern, Marder, Bell, Gurland, Lantigua and Mayeux1998). Several studies report earlier and faster declines in memory or executive function among APOE ɛ4 carriers than non-carriers (i.e., APOE by age interactions), with detectable accelerations in decline beginning around age 60 (Caselli et al., Reference Caselli, Dueck, Osborne, Sabbagh, Connor, Ahern and Woodruff2009; Chang et al., Reference Chang, Fennema-Notestine, Holland, McEvoy, Stricker and Salmon2014; Wisdom, Callahan, & Hawkins, Reference Wisdom, Callahan and Hawkins2011).
Studies also indicate that the rate of ɛ4-associated cognitive decline and AD risk are moderated by sex with ɛ4-carriage increasing rate of decline and risk more in women than in men (Altmann, Tian, Henderson, & Greicius, Reference Altmann, Tian, Henderson and Greicius2014; Beydoun et al., Reference Beydoun, Boueiz, Abougergi, Kitner-Triolo, Beydoun, Resnick and Zonderman2012; Koran, Wagener, & Hohman, Reference Koran, Wagener and Hohman2017; Mielke, Vemuri, & Rocca, Reference Mielke, Vemuri and Rocca2014; Mortensen & Høgh, Reference Mortensen and Høgh2001; Neu et al., Reference Neu, Pa, Kukull, Beekly, Kuzma, Gangadharan and Redolfi2017; Payami et al., Reference Payami, Zareparsi, Montee, Sexton, Kaye, Bird and Litt1996; Riedel, Thompson, & Brinton, Reference Riedel, Thompson and Brinton2016). Higher literacy levels (as measured by word reading tasks) have been shown to mitigate age- and/or APOE-related cognitive decline in non-demented elders (Kaup et al., Reference Kaup, Nettiksimmons, Harris, Sink, Satterfield, Metti and Yaffe2015; Manly, Touradji, Tang, & Stern, Reference Manly, Touradji, Tang and Stern2003).
No studies, to our knowledge, have investigated the combined influences of sex, APOE genotype, and literacy on early to late middle-age cognitive trajectories in an integrated analytic framework. However, the number of configurations in which these and other covariates could be associated with a given outcome is quite large, and this presents a problem of what model configuration to choose. Traditional model selection approaches, such as forward, backward, or stepwise selection, attempt to find a model that best fits the observed data.
One issue that can arise from such methods is concluding that only the selected predictors are important while assuming those not selected are unimportant (Anderson & Burnham, Reference Anderson and Burnham2002). In reality, several models may fit the data similarly well but result in different conclusions, and inference from a single model chosen after a selection procedure can lead to overly optimistic results and conclusions (Claeskens & Hjort, Reference Claeskens and Hjort2008). Information-theoretic (IT) modeling techniques offer a way to characterize complex sets of interactions and make multi-model inference while avoiding the pitfalls of predictor selection methods (Anderson & Burnham, Reference Anderson and Burnham2002; Claeskens & Hjort, Reference Claeskens and Hjort2008).
The IT framework evaluates “a small set of science hypotheses, all of which are plausible” (Anderson & Burnham, Reference Anderson and Burnham2002; p. 202). The IT approach has its roots in biological ecology research (Burnham, Anderson, & Huyvaert, Reference Burnham, Anderson and Huyvaert2011; Hegyi & Garamszegi, Reference Hegyi and Garamszegi2011; Richards, Reference Richards2005; Richards, Whittingham, & Stephens, Reference Richards, Whittingham and Stephens2011; Symonds & Moussalli, Reference Symonds and Moussalli2011) and aims to use the relative strength of information among all considered models instead of selecting a single model. The methods start with formulating a reasonably sized collection of models with the same outcome, but different covariate structures (such as different main effects, interactions, etc.). Each model should test hypotheses that are scientifically reasonable to include.
After fitting all of these models to the data, results are combined across models in proportion to the relative strength of information each model provides. These relative strengths are quantified through the theory of the corrected Akaike Information Criterion-corrected (AICc), which estimates the relative differences among these models with respect to their Kullback-Leibler (K-L) divergence, a measure of the distance between a proposed model and the “true” model (see Figure 1; Burnham et al., Reference Burnham, Anderson and Huyvaert2011; Hurvich & Tsai, Reference Hurvich and Tsai1989). This allows models fitting similarly well to contribute relatively equal amounts of influence on the resulting parameter estimates, while models that fit poorly have little or no influence on results.
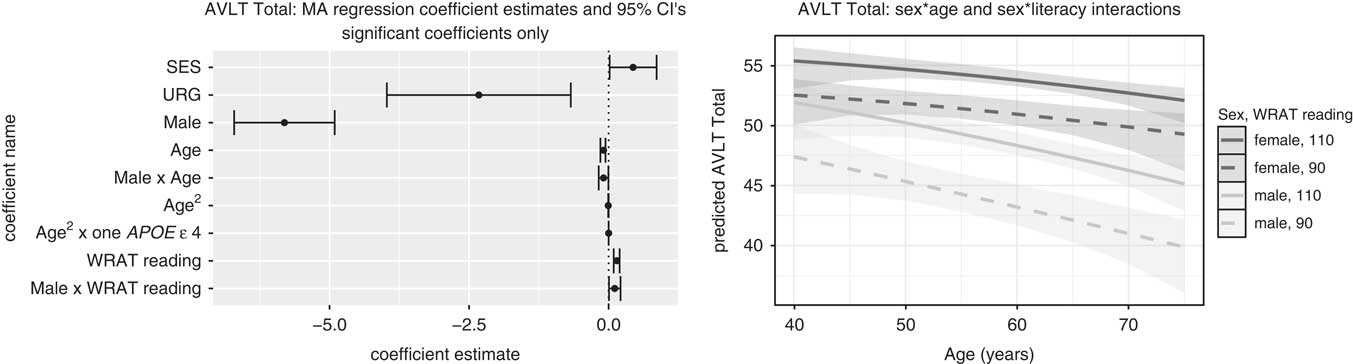
AVLT Total: significant model-averaged terms (left) and predicted values (right). Results are for the outcome, AVLT Total. The left panel depicts parameter estimates and 95% confidence intervals (CIs) for CIs that do not overlap 0. The right panel depicts predicted values and 95% confidence limits using the model averaged parameter estimates for both sexes and high vs low literacy. SES = socioeconomic status; URG = underrepresented groups; WRAT = Wide Range Achievement Test (3rd edition).

The aims of this study were to describe the IT model averaging method and apply it to characterize how sex, literacy, and APOE genotype influence age-related trajectories for several neuropsychological tests in a longitudinal sample enriched for risk of developing AD [Wisconsin Registry for Alzheimer’s Prevention (WRAP)]. In secondary analyses, we compare the IT model averaging results with traditional model selection methods.
METHODS
WRAP Study and Participants
WRAP is a longitudinal cohort study enriched for AD-risk via over-enrollment of participants with a parental history of AD (for details, see Johnson et al., Reference Johnson, Koscik, Jonaitis, Clark, Mueller, Berman and Sager2017); primary aims of the study include identifying predictors associated with cognitive decline and estimating their associations. All participants were free of dementia at baseline. At the time of these analyses, there were 1549 enrolled WRAP participants [baseline age mean (SD) = 53.7(6.6); parental history of AD n(%) = 1125(72.6%)].
To be included in these analyses, participants had to be free at baseline of mild cognitive impairment (MCI) and any of four neurological conditions (stroke, Parkinson’s disease, multiple sclerosis, epilepsy), have completed at least two study visits, and have complete data in the predictors needed for the analyses (n = 1256 eligible; ns excluded: MCI, n = 4; neurological disorder, n = 59; <2 visits, n = 226; incomplete predictors, n = 4; see Table 1 for additional details). This study was conducted in compliance with ethical principles for human subjects research defined in the Declaration of Helsinki, including approval by the University of Wisconsin Institutional Review Board.
Sample characteristics

Note. Number of participants omitted from model averaging for that outcome due to less than two visits with that outcome’s data: RAVLT Total and Delay, 7; Trails A and B, 6; Digit span forward and backward, 7; Stroop CW, 21; BNT, 10; CFL, 10; 4-Test IICV, 9.
a Comparisons made with Mann-Whitney, unless noted with + (Fisher’s exact) or ^ (Chi-squared).
URG = underrepresented groups; ESL = English as a second language; APOE = apolipoprotein E; SES = socioeconomic status; IICV = intraindividual cognitive variability; AVLT = Rey Auditory Verbal Learning and Memory Test; BNT = Boston Naming Test; CFL = Controlled Oral Word Association Test, total words in 60 s for each letter: C, F, L.
Study Protocol and Outcomes
At each study visit, participants completed comprehensive cognitive assessments, detailed health and lifestyle questionnaires, and provided blood samples for current and future analyses. The first follow-up visit occurred approximately 4 years after baseline, with subsequent visits occurring approximately every 2 years (for details, see Johnson et al., Reference Johnson, Koscik, Jonaitis, Clark, Mueller, Berman and Sager2017). We analyze 10 outcomes in this study that have been shown to be sensitive to AD-related cognitive changes [1 intraindividual cognitive variability (IICV) measure and 9 cognitive measures available since baseline of the WRAP study including: the Rey Auditory Verbal Learning and Memory Test (Schmidt, Reference Schmidt1996), sum of learning trials (AVLT Total) and long delay recall trial (AVLT Delay); Trail Making Test (Trails A and Trails B; Lezak, Howieson, Bigler, & Tranel, Reference Lezak, Howieson, Bigler and Tranel2012); Stroop Color-Word Interference Test (Trenerry, Crosson, DeBoe, & Leber, Reference Trenerry, Crosson, DeBoe and Leber1989), number of correct items in 2 min; Controlled Oral Word Association Test (Benton, Hamsher, & Sivan, Reference Benton, Hamsher and Sivan1994), total words in 60 s for each letter: C, F, L (CFL); the Boston Naming Test (BNT; Kaplan, Goodglass, & Weintraub, Reference Kaplan, Goodglass and Weintraub2001), total correct and Digit span forward and backward total items correct (Wechsler, Reference Wechsler1997)].
Given recent results in WRAP and other studies suggesting that higher IICV across tests at a given visit predicts increased risk of subsequent decline or AD pathology (Anderson et al., Reference Anderson, Wahoske, Huber, Norton, Li, Koscik and Asthana2016; Gleason et al., Reference Gleason, Norton, Anderson, Wahoske, Washington, Umucu and Asthana2018; Holtzer, Verghese, Wang, Hall, & Lipton, Reference Holtzer, Verghese, Wang, Hall and Lipton2008; Koscik et al., Reference Koscik, Berman, Clark, Mueller, Okonkwo, Gleason and Johnson2016), we also characterized how IICV varied by sex, literacy, APOE, and age in our sample. Specifically, we calculated “4-Test IICV” as the standard deviation of Z-scores of AVLT Total and Delay, Trails B, and the Wide Range Achievement Test (3rd ed., WRAT) reading recognition subtest standard score (Wilkinson, Reference Wilkinson1993); AVLT Delay, Trails B, and WRAT were Box-Cox transformed before Z-scoring (AVLT Delay had a constant of 1 added to all scores before transformation) The WRAT Reading score when used in middle-aged and older adults is accepted as a stable proxy for premorbid verbal abilities and quality of education (Ashendorf, Jefferson, Green, & Stern, Reference Ashendorf, Jefferson, Green and Stern2009; Manly et al., Reference Manly, Touradji, Tang and Stern2003; Olsen, Fellows, Rivera-Mindt, Morgello, & Byrd, Reference Olsen, Fellows, Rivera-Mindt, Morgello and Byrd2015). Baseline WRAT reading and IICV were not correlated (Spearman rho = .022; p = .44), even though WRAT is a component of the IICV calculation.
Key Predictors and Covariates
Key predictors in this study include age (years), sex (male/female), APOE ɛ4 allele count [i.e., 0, 1, 2 (for details on genotyping methods, see Darst et al., Reference Darst, Koscik, Racine, Oh, Krause, Carlsson and Bendlin2017)], and WRAT. For subjects without baseline WRAT, the value at their second visit was used. Additional covariates included race/ethnicity (non-Hispanic Caucasian vs. underrepresented group, URG), if English were the subject’s native language (ESL), and socioeconomic status (SES; 1 = <$20 k; 2 = $20 k- <$40 k; 3 = $40 k- <$60 k; 4 = $60 k- <$80 k, and 5 = $80 k or more). Missingness in SES was present in 54 (4.3%) participants. To recover these subjects for analyses, their baseline SES values were imputed through proportional odds regression using baseline values of age, sex, race/ethnicity, the Center for Epidemiological Studies of Depression (CES-D) total score (Radloff, Reference Radloff1977), literacy, and years of education as predictors.
Data Analysis
We followed the steps outlined for the IT-modeling approach detailed below.
Step 1: Specifying the model set
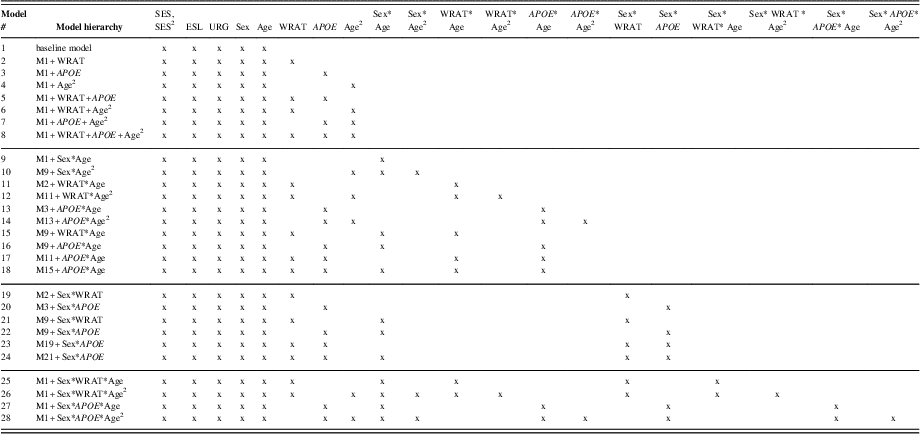
Based on research indicating potential interactions between literacy and sex, APOE ɛ4 count (0 = reference group), or age (on cognitive outcomes), we developed a set of 28 research-supported hypothesized models representing increasingly complex relationships among sex, literacy, APOE ɛ4 status, and age-related cognitive decline (Table 2). We then proceeded with steps 2–7 for each of our outcomes.
Model set fixed effects structure

Note. Models represent several possible hypothesized associations between sex, age, WRAT, and APOE. For example, Model 1 includes within person random effects (intercept and age-related slope) and SES, ESL, URG, sex, and age. Model 1 terms are included in all other models. Given the potential for differences in age-related trajectories, Models 9, 11, and 13 examine whether sex, WRAT, or APOE influence age-related change in a linear way while models 10, 12, and 14 examine non-linear (i.e., quadratic) differences. See Supplemental Table 1 for model set used for initial implementation of the IT framework.
APOE = apolipoprotein E; WRAT = Wide Range Achievement Test; SES = socioeconomic status; ESL = English as a second language; URG = underrepresented groups.
Step 2: Fit each model and check model assumptions
All models used a mixed effects structure, with the fixed effects for each model in the set as specified by Table 2, and subject specific intercepts and age-related slopes as random effects. For outcomes of AVLT Delay and BNT, logistic regression mixed models were used to address the discrete nature and ceiling effects in the data; other outcomes used standard linear mixed effects models. For all models, SES was treated as continuous, age and SES were centered to their baseline means, and their associated quadratic terms calculated from these centered values. Each model was fit to the data by maximum likelihood, and model diagnostics were performed on the model with the most parameters and the “best fitting” model (lowest AICc value). Diagnostics included checking for homoscedastic and appropriately distributed residuals, outliers, normally distributed random effects, correlation between random effects and residuals, and overdispersion (for logistic regressions). CFL and IICV were square-root transformed to address residuals issues. Stroop Color Word was removed from subsequent analysis due to several residuals violations not addressed with reasonable transforms.
Even after reasonable transformations, the following issues persisted. Small correlations between the random effects and residuals were noted (≤∼|0.3|). CFL also had several large positive residual outliers associated with a single subject. A sensitivity analysis for CFL removed this subject and re-performed the entire algorithm; because results did not change in any meaningful way, CFL results presented here include this subject.
Step 3: Extract model statistics
For each model in the set, the extracted model statistics included the number of model parameters (k, including number of both fixed and random effects terms), AICc, and the log likelihood statistic. AICc is based on the K-L divergence, which is a measure of information loss when model “g” is used to approximate the true data generating model, model “f” (Burnham & Anderson, Reference Burnham and Anderson2003). For data with n observations and fitted regression model “g” with k parameters, the formula for AICc is (Burnham & Anderson, Reference Burnham and Anderson2002):
 $AICc = - 2\ln \left( {p\left( {y{\mkern 1mu} \mid {\mkern 1mu} \hat \theta } \right)} \right) + {{2kn} \over {n - k - 1}}$
where
 $y$
is the observed data,
 $\hat{\theta }$
are the maximum likelihood estimates of the k parameters from model “g”, and “p()” the likelihood function for model “g”.
Step 4: Calculate Δjs
The minimum AICc across the model set was used to calculate the difference between the best fitting model (i.e., that with the minimum AICc) and model j. For model j:
 ${\Delta _j} = \left( {AICc\;of\;model\;j} \right) - \left( {minimum\;AICc\;value\;in\;set} \right),{\rm{ }}for\;j = 1,2,...J\;models\;in\;the\;set$
Step 5: Calculate model weights
Δ j s for each model are used to calculate the Akaike weights (w j s) of all models in the set. Heuristically, w j represents the likelihood that model j is the K-L best model in the set. The w j s helps quantify model uncertainty and are used to combine information across the set of models. w j is calculated as:
 ${w_j} = {{{\rm{exp}}\left( { - {\Delta _{\rm{j}}}{\mkern 1mu} {\rm{/}}{\mkern 1mu} {\rm{2}}} \right)} \over {\mathop \sum \limits_k {\rm{exp}}\left( { - {\Delta _{\rm{k}}}{\mkern 1mu} {\rm{/}}{\mkern 1mu} {\rm{2}}} \right)}}$
Step 6: Combine results across models
Regression coefficient results from each model are multiplied by their corresponding weight (w j ), and all weighted results are then summed together for the final model averaged result. When a regression parameter does not appear in a particular model, it is set to zero in that model. Thus, for the i th regression parameter in one model, the model averaged i th regression parameter is:
 $\matrix{
{{{\overline {\hat \beta } }_i} = \sum\limits_j {{\omega _j}} {{\hat \beta }_{i(j)}},} \cr
{where\;{{\hat \beta }_{i(j)}} = 0\;if\;{\beta _i}\;does\;not\;appear\;in\;model\;j} \cr
} $
Step 7: Confidence intervals and inference using model averaged results
To facilitate multi-model inference, model-averaged estimates were evaluated using 95% confidence intervals (CIs) obtained through non-parametric bootstrapping. For each outcome, the data used to fit the model sets were first stratified at the subject level by the total number of visits (2, 3, 4, or 5) per subject. Within each stratum, subjects were selected, with replacement, back to the number of subjects within that stratum, thus preserving the original number of subjects, observations/subject, and distribution of follow-up visits. Each bootstrap replicate went through steps 2–6; 10,000 bootstrap replicates were performed for each outcome. Bootstrap quantiles were used to calculate CIs (using linear interpolation when necessary). Standard CI interpretation methods were used for inference about regression parameters (i.e., CIs that did not overlap with 0 were considered significant at the α = 0.05 level). This process was used for both regression parameters and predicted outcomes.
Bootstrap rationale
While Burnham and Anderson propose analytical methods for model-averaged inference and CIs, these methods are predicated upon assumptions of a limiting normal distribution for the model-averaged estimate (Burnham & Anderson, Reference Burnham and Anderson2002). Clauskens and Hjort have shown that, unless one assumes the model weights (w j s) used are fixed and not random quantities, there is no guarantee of a limiting normal distribution (Claeskens & Hjort, Reference Claeskens and Hjort2008). Thus, we used bootstrapping methods similar to those proposed by Burnham and Anderson (Burnham & Anderson, Reference Burnham and Anderson2002).
Secondary analyses. Comparison of modeling methods
To illustrate how results from the above approach differ from some traditional approaches, we selected three tests and compared IT model averaged results with results obtained via single regression models determined by a best fitting model approach and by a backward elimination approach. In both methods, the same general mixed effects model structure and use of maximum likelihood fits were used. For the best fitting approach, the model selected was that out of the candidate set which had the minimum AICc value. For backward elimination, the starting model included all terms that appeared in any of the models within the candidate set, and the criteria for elimination was which covariate reduced AICc by the largest amount, while preserving the hierarchy of higher order terms. Elimination stopped when removal of any remaining term did not reduce AICc. For both methods, CIs and inference from the resulting single models used the asymptotic normal properties of regression estimates.
Type I error assessment
No family-wise error rate correction was performed; however, an assessment of the interaction findings in relation to type I error rates was done. For each outcome, 17 unique interaction coefficients defined by the model set were examined (11 two-way and 6 three-way) for a total of 99 two-way and 54 three-way interactions across the nine outcomes. For each of these coefficient groupings, the binomial distribution was used to examine how often one would expect to detect at least the number of significant coefficients found in these analyses (at the 0.05 level), assuming the global null hypothesis that all coefficients are truly zero, and (naively) the results collection is mutually independent.
Software Used
All analyses were performed using R version 3.4.0. Proportional hazard models were fit using “polr” in the MASS package; mixed effect regression models were fit using “lmer” and “glmer” in the lme4 package; AICc-based model statistics were calculated using “aictab” in the AICcmodavg package; bootstrapping was performed using HTCondor version 8.6.3.
RESULTS
Sample Characteristics
Baseline sample characteristics are shown in Table 1 overall and by sex. Mean (SD) age at baseline and last visit were 53.7 (6.6) and 62.8 (6.8), respectively. Men and women did not differ in terms of age, years of follow-up, proportion of URG or ESL, and IICV. The sexes differed on APOE ɛ4 count, SES, and all cognitive tests at baseline. Women performed better than men at baseline on all tests except BNT and Digit Span. Those who were excluded due to having completed only one visit did not differ from the analysis group in terms of age, sex, or IICV but did have lower SES and baseline cognitive scores, and higher proportions URG (36%) and ESL (10.8%).
Model-Averaged Results
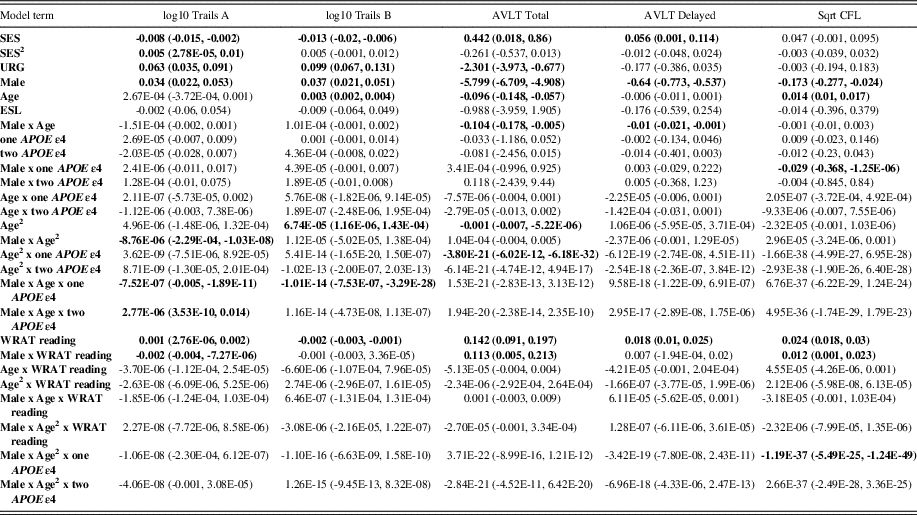
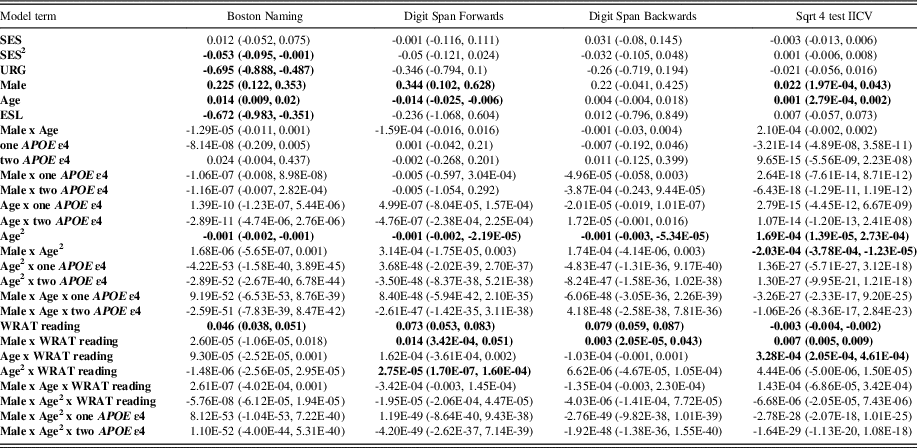
Model averaged coefficients and corresponding 95% CIs for all non-intercept terms are shown in Tables 3 (AVLT Total, AVLT Delay, log10Trails A and log10Trails B, and CFL) and 4 (Digit Span forward and backward, BNT, and 4-Test IICV). In each table, 95% CIs that exclude 0 are identified by bold-face; gray shading denotes CIs containing 0. AICcs and weights for all outcomes and models in the set are presented in Supplementary Table 2 and correlations among outcomes are provided in Supplementary Table 3. Results are summarized below using model numbers (and the first time a model number is referenced in the results, the corresponding highest order term(s) beyond those included in Model 1 are included in parentheses); for each outcome, results are supported by a two-panel figure (left-panel depicts 95% CIs that exclude 0 and right-panel depicts predicted outcomes by age and selected predictors using model-averaged estimates).
Model averaged parameters for all model terms AVLT Total, AVLT Delay, log10Trails A, log10Trails B, and square-root CFL

Note. “E” represents “x10^”; e.g., 1.23E-04 = 1.23x10⁻⁴. The 95% CIs that do not overlap 0 (are significant) are identified by boldface font; gray shading denotes CIs that overlap 0.
AVLT = Rey Auditory Verbal Learning and Memory Test; CFL = Controlled Oral Word Association Test, total words in 60 s for each letter: C, F, L; SES = socioeconomic status; URG = underrepresented groups; ESL = English as a second language; APOE = apolipoprotein E; WRAT = Wide Range Achievement Test; CI = confidence interval.
Memory
For AVLT Total, Model 21 (highest order terms: sex*age, sex*WRAT) was best-fitting, contributing a weight of .562 to model averaging; Model 26 (sex*WRAT*age2) contributed .183 and Model 25 (sex*WRAT*age) contributed .139 (weights in Supplementary Table 2); all other model weights were under .05. Significant interactions included ɛ4 count 1*age2, sex*age, and sex*literacy (Figure 1, left-panel). Figure 1 (right-hand panel) depicts AVLT Total model-averaged predicted performance for the latter two interactions since the estimated beta for the interaction with age and ɛ4 count 1 was ostensibly 0 (i.e., at 10 years below the average age, estimated AVLT performance is .0329 points higher for those with 0 vs. 1 ɛ4 allele, while at 10 years above the average age, estimated AVLT performance is .0331 points higher for those with 0 vs. 1 ɛ4 allele). There is a larger gap in AVLT Total scores for high versus low literacy in men than in women (i.e., worse scores at lower literacy levels) and men show faster AVLT Total age-related decline than women.
The best fitting model for AVLT Delay was also Model 21 (weight = .531), followed by Model 15 (WRAT*age, sex*age, weight = .123) and Model 25 (.119). Variability in AVLT Delay was explained largely by SES, sex, literacy, and age, with age-related AVLT Delay decline steeper for men than women (see Supplementary Figure 1A for CIs and predicted trajectories).
Executive Function/Working Memory
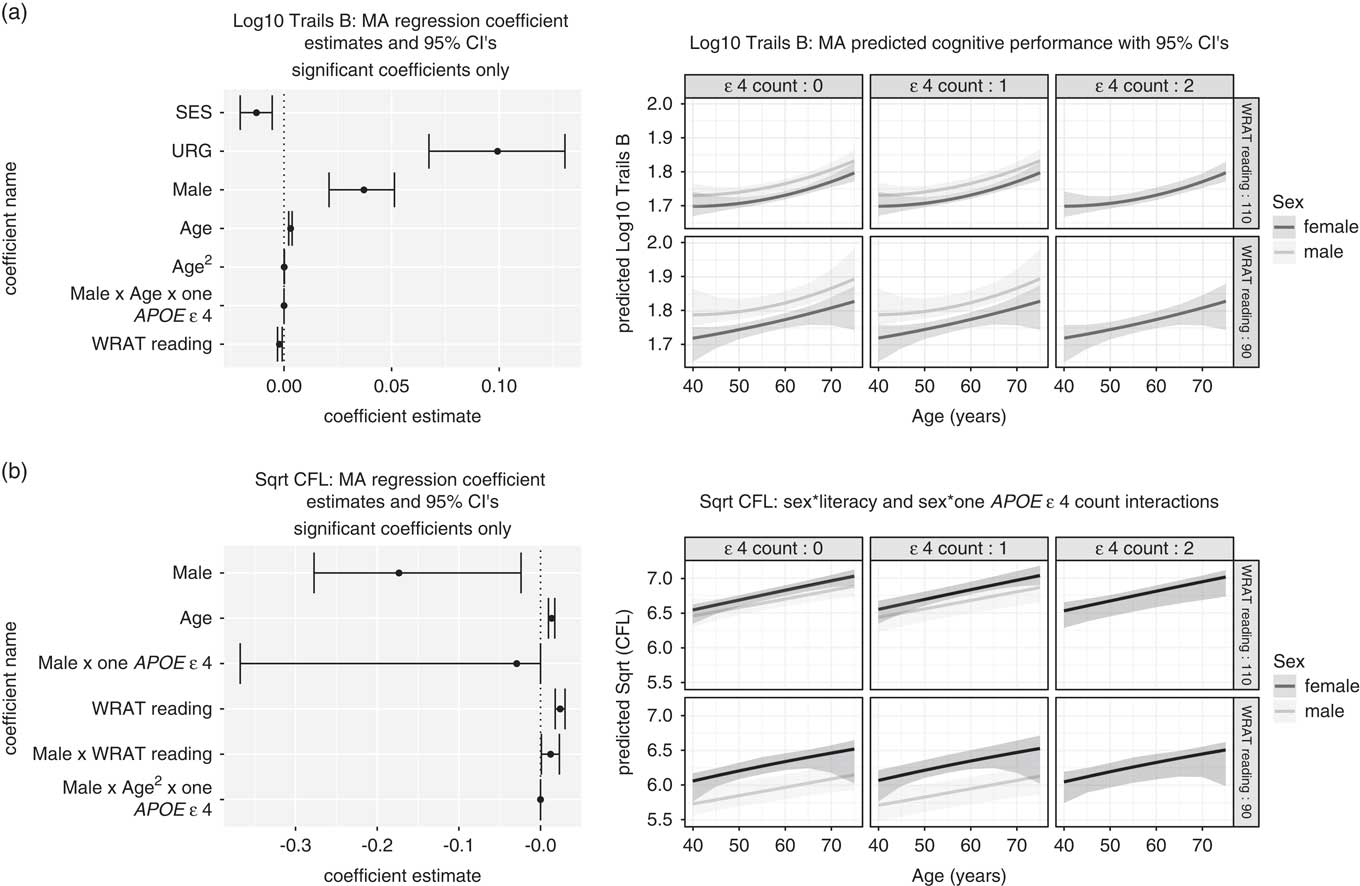
The best fitting models for log10 Trails B were Models 6 (WRAT + age2; weight = .330), 26 (weight = .297), 12 (WRAT*age2; weight = .124), and 19 (sex*WRAT; weight = .109). Variability in log10 Trails B was explained by SES, URG status, sex, literacy, age (linear and quadratic), and a three-way interaction with sex*APOE ɛ4 count 1*age (left-hand panel, Figure 2A). Though significant, the estimated beta for the sex*age*APOE interaction was again close to 0. Predicted age-related trajectories show greater times for men than women and lower versus higher literacy [right-hand panel, Figure 2A; no predicted values are shown for men and APOE ɛ4 count = 2 due to the small cell size (n = 4)].
Trails B and CFL significant model-averaged terms (left) and predicted values (right). Results in A are for Trails B (log10 transformed) and in B are for CFL (square-root transformed). For each, the left panel depicts parameter estimates and 95% confidence intervals (CIs) for CIs that do not overlap 0. The right panel depicts predicted values and 95% confidence limits using the model averaged parameter estimates for both sexes, high vs low literacy, and APOE ɛ4 allele count. SES = socioeconomic status; URG = underrepresented groups; WRAT = Wide Range Achievement Test (3rd edition).

The best fitting models for Digit Span backward were Models 6 (weight = .583), 12 (.168), 26 (.117), and 8 (WRAT + APOE + age2; weight = .104). Variability in Digit Span backward was explained by quadratic age, literacy, and sex, with greater sex differences at higher literacy levels (Supplementary Figure 1B).
Attention
The best fitting models for log10 Trails A were Models 19 (weight = .574), 21 (.248), and 25 (.064). Supplementary Figure 1C depicts significant beta estimates and their CIs (left panel) and predicted values versus age, stratifying by sex and literacy (high vs. low; right panel). Predicted values indicate that women of high literacy perform worse on log10 Trails A than women of low literacy while the opposite is true for men. Although the interactions of sex*quadratic age, and sex*age*APOE ɛ4 counts of 1 or 2 were statistically significant, all had estimated betas extremely close to 0 (Table 4; Supplementary Figure 1C).
Model averaged parameters and 95% CIs for all model terms and CFL, BNT, Digit Span forward, Digit Span backward, and 4-Test IICV

Note. “E” represents “x10^”; e.g., 1.23E-04 = 1.23x10⁻⁴. The 95% CIs that do not overlap 0 (are significant) are identified by bold-face font; gray shading denotes CIs that overlap 0.
CI = confidence interval; CFL = Controlled Oral Word Association Test, total words in 60 s for each letter: C, F, L; BNT = Boston Naming Test; IICV = intraindividual cognitive variability; SES = socioeconomic status; URG = underrepresented groups; ESL = English as a second language; APOE = apolipoprotein E; WRAT = Wide Range Achievement Test; CI = confidence interval.
The best fitting models for Digit Span forward were Models 6 (weight = .307), 26 (.234), 19 (.163), and 12 (.124). Variability in Digit Span forward was explained by sex, age (linear and quadratic), and literacy; significant interactions included sex*literacy and literacy*quadratic age. The latter beta estimate was near zero; sex differences in the outcome are negligible at low literacy levels while men outperform women at high literacy levels (Supplementary Figure 1D).
Language
The best fitting models for CFL were Models 19 (weight = .416) and 21 (.251). Variability in CFL was explained by age, sex, literacy, and interactions sex*APOE count 1, sex*literacy, and sex*APOE count 1*quadratic age, although the three-way beta estimate was essentially 0 (Figure 2B). Women did better overall and sex differences were smaller in ɛ4 count = 0 than count = 1. All improved with age. The best fitting models for BNT were Models 6 (weight = .630), 12 (.239), and 8 (.128). Variability in BNT was explained by SES, URG status, sex, age, ESL status, and literacy level with higher literacy, SES, male sex, and older age associated with better performance, while URG and ESL status were associated with lower BNT scores (Supplemental Figure 2).
IICV
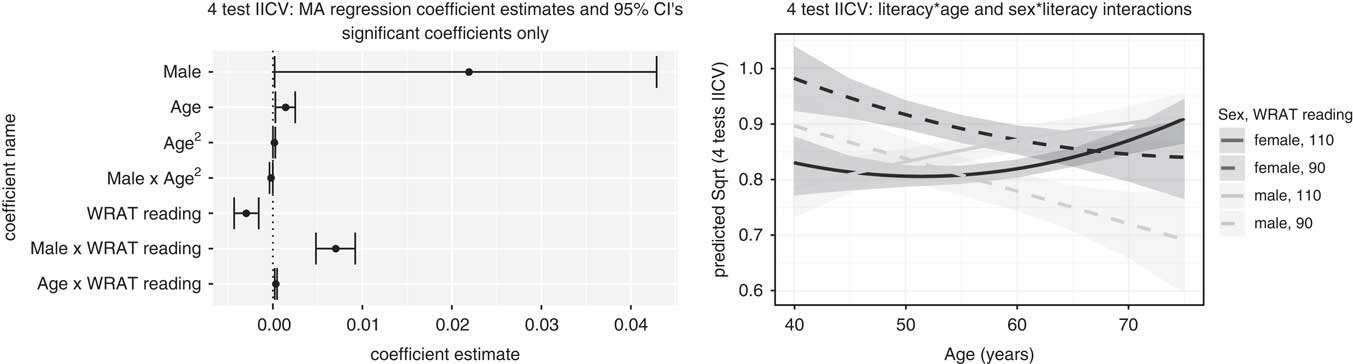
The best fitting model for 4-Test IICV was Model 26 (weight = 0.959); all other models contributed <0.05 to the parameter weights. Variability in 4-Test IICV was accounted for by sex, age, and literacy, with significant sex*age2, sex*literacy, and literacy*age interactions (Figure 3). At lower levels of literacy, women show higher 4-Test IICV than men and IICV declines with age; in contrast, IICV increases with age at higher literacy levels and is at times higher among men than women (Figure 3).
4-Test intraindividual cognitive variability (4-Test IICV) significant model-averaged terms (left) and predicted values (right). Results are for the outcome, 4-Test IICV. The left panel depicts parameter estimates and 95% confidence intervals (CIs) for CIs that do not overlap 0. The right panel depicts predicted values and 95% confidence limits using the model averaged parameter estimates for both sexes and high vs low literacy. SES = socioeconomic status; URG = underrepresented groups; WRAT = Wide Range Achievement Test (3rd edition).

Model Comparisons
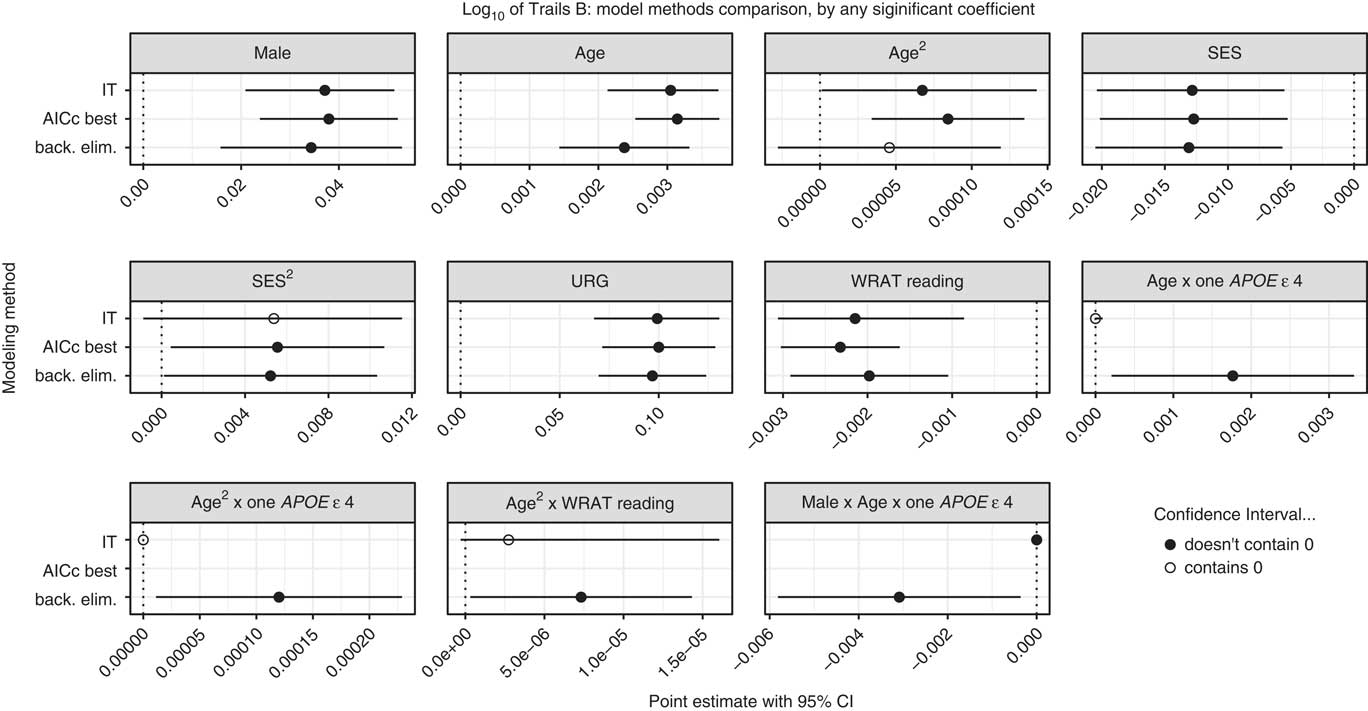
In secondary analyses of three outcomes (AVLT Total, AVLT Delay, and Trails B), we compared estimated betas and 95% CIs between the IT, best fit, and backward selection approaches for coefficients that were significant in any of the methods, per outcome. Results differed most across model selection approaches for Trails B, with 6 of 11 terms inconsistently significant across methods (see Figure 4 for point estimates and CIs for the three approaches for Trails B and Supplementary Figure 3 for AVLT Total and Delay).
Trails B significant results by IT, best fit, and backward selection methods. Parameter estimates and 95% confidence intervals (CIs) are depicted for each of three modeling methods (IT, AICc best fit, and backward elimination) for parameters that were significant by at least one of the three methods. CIs that overlap 0 (i.e., not significant) are shown with open circles. Results varied across methods for all the interaction terms. IT = Information-Theoretic model averaging method; AICc best = AICc best fit model selection method; back. Elim. = backward elimination model selection method; SES = socioeconomic status; URG = underrepresented groups; WRAT = Wide Range Achievement Test (3rd edition).

Type I Error Assessment
Fourteen (14.1%) of 99 unique two-way interactions were significant, corresponding to a probability of 0.00012 under the global null. Four (7.4%) of 54 unique three-way interactions were significant, corresponding to a 0.132 probability under the global null.
DISCUSSION
In this study, we used information-theoretic (IT) model averaging techniques to characterize how sex, APOE ɛ4 carrier status, and literacy modify age-related cognitive and IICV trajectories in a sample that was middle-aged and free of clinical impairment at baseline assessment. We observed age-related declines for all cognitive outcomes except the two language-related measures (CFL and BNT). Age-related declines in IICV were associated with lower literacy levels while IICV tended to increase with age among participants with higher literacy. Significant but small quadratic age effects were observed for a few outcomes. APOE ɛ4 count showed significant but small modifying effects on age-related trajectories on four outcomes. Sex and literacy were consistently significant predictors of measures of memory, executive function, working memory, language, and IICV with effects showing stronger performance in women (vs. men) and higher (vs. lower) literacy.
Compared to those with no APOE ɛ4 alleles, carriage of one or two ɛ4 alleles is associated with greater risk of AD (Neu et al., Reference Neu, Pa, Kukull, Beekly, Kuzma, Gangadharan and Redolfi2017) and faster or earlier cognitive decline in certain domains. For example, in a sample of cognitively normal adults (mean baseline age ∼60 years, followed an average of ∼5 years), Caselli and colleagues reported accelerated age-related decline on AVLT Delay among APOE ɛ4 carriers (vs. non-carriers) beginning before age 60 (Caselli et al., Reference Caselli, Dueck, Osborne, Sabbagh, Connor, Ahern and Woodruff2009). Predicted annual rate of AVLT Delay change, however, was very small for carriers and non-carriers in age-ranges similar to our sample (e.g., 50–59, 0.07 vs. 0.08 and 60–69, 0.04 vs. -0.03 for non-carriers vs. carriers, respectively).
In a meta-analyses, Wisdom and colleagues also reported significant yet small differences in age-related decline among APOE ɛ4 carriers relative to non-carriers (Cohen’s d estimated effect sizes <.20; Wisdom et al., Reference Wisdom, Callahan and Hawkins2011). Results in our sample showed similar significant, yet small age-modifying effects of one APOE ɛ4 allele (vs. 0) for AVLT Total, Trails A and B, and CFL. These patterns, when considered along with data showing that APOE ɛ4 effects on later life cognitive trajectories are mediated by underlying neuropathology (Yu, Boyle, Leurgans, Schneider, & Bennett, Reference Yu, Boyle, Leurgans, Schneider and Bennett2014), underscore the importance of thoroughly characterizing neuropathology in late-middle age to better understand how APOE ɛ4 confers increased risk of AD dementia.
Previous research has also shown sex differences in risk of MCI (Roberts et al., Reference Roberts, Geda, Knopman, Cha, Pankratz, Boeve and Petersen2012) and AD (e.g., Altmann et al., Reference Altmann, Tian, Henderson and Greicius2014), and rates of decline (e.g., McCarrey, An, Kitner-Triolo, Ferrucci, & Resnick, Reference McCarrey, An, Kitner-Triolo, Ferrucci and Resnick2016; Mortensen & Høgh, Reference Mortensen and Høgh2001), with other studies showing evidence of potential sex*ɛ4 interactions (Payami et al., Reference Payami, Zareparsi, Montee, Sexton, Kaye, Bird and Litt1996). In our sample, sex*age interactions showed lower scores and faster decline in men for both AVLT measures. These results are consistent with other studies such as those reported for the Mayo Clinic Study of Aging in which men had worse memory (including, decline) and lower hippocampal volume compared to women (Jack et al., Reference Jack, Wiste, Weigand, Knopman, Vemuri, Mielke and Petersen2015).
Sundermann and colleagues posited that the paradoxical higher rates of MCI in men and higher rates of AD in women may be explained at least partially by two things: first, the “female advantage in verbal memory” may constitute a form of cognitive reserve for women which delays declines in verbal memory until older ages or until AD biomarkers are present; and second, the use of norms that do not adjust for sex may result in over-identification of men or delayed identification of women with MCI (Sundermann et al., Reference Sundermann, Biegon, Rubin, Lipton, Landau and Maki2017, Reference Sundermann, Maki, Rubin, Lipton, Landau and Biegon2016).
Literacy level as measured by word reading tasks is considered a proxy for verbal intellectual ability and quality of education; lower literacy has been associated with faster memory decline in non-demented elders (e.g., Manly et al., Reference Manly, Touradji, Tang and Stern2003). Higher literacy levels have also been shown to be associated with resilience to APOE ɛ4-related cognitive decline (Kaup et al., Reference Kaup, Nettiksimmons, Harris, Sink, Satterfield, Metti and Yaffe2015; Vemuri et al., Reference Vemuri, Lesnick, Przybelski, Machulda, Knopman, Mielke and Jack2014). In our sample, literacy did not modify effects of APOE ɛ4 or age on cognition.
These results were consistent, however, with other studies showing main effects only for predictors such as literacy or educational attainment (e.g., Berggren, Nilsson, & Lövdén, Reference Berggren, Nilsson and Lövdén2018; Lenehan, Summers, Saunders, Summers, & Vickers, Reference Lenehan, Summers, Saunders, Summers and Vickers2015) and suggest that performance differences in late middle-age associated with these measures “reflect the persistence of earlier-life differences in cognitive functioning, and not differential rates of cognitive decline” (Tucker-Drob, Johnson, & Jones, Reference Tucker-Drob, Johnson and Jones2009; p. 11). We did observe several sex*literacy interactions showing the pattern that the benefits of higher literacy associated were stronger for men than women for AVLT Total, Trails A, CFL, and Digit Span; these results also underscore the importance of using norms that adjust for key demographic features.
The 4-Test IICV had several moderating effects. At lower literacy/premorbid verbal ability levels, predicted IICV declined faster with age among men compared to women. In contrast, predicted IICV increased with age at higher literacy levels (and for both sexes), suggesting probable worsening in memory and/or executive function relative to premorbid verbal abilities. This pattern corresponds to other studies that have shown that higher IICV (calculated using variables similar to those we used) predicts MCI, AD, or AD pathology (Anderson et al., Reference Anderson, Wahoske, Huber, Norton, Li, Koscik and Asthana2016; Gleason et al., Reference Gleason, Norton, Anderson, Wahoske, Washington, Umucu and Asthana2018; Holtzer et al., Reference Holtzer, Verghese, Wang, Hall and Lipton2008; Koscik et al., Reference Koscik, Berman, Clark, Mueller, Okonkwo, Gleason and Johnson2016). The former pattern suggests that future studies could examine whether the risk-indicating value of IICV varies across underlying characteristics such as sex and literacy.
Traditional model selection methods such as stepwise regression are prone to overfitting the data, producing overconfident estimates with standard errors that do not account for the degrees of freedom in the search process (Hastie, Tibshirani, & Friedman, Reference Hastie, Tibshirani and Friedman2009). Shrinkage methods, such as Lasso (Taylor & Tibshirani, Reference Taylor and Tibshirani2015), can help select important predictors with respect to the outcome, but parsimonious models and predictive accuracy are the typical goal, and statistical inference can be difficult (Hastie, Tibshirani, & Wainwright, Reference Hastie, Tibshirani and Wainwright2015).
While new post-selection inference techniques exist for certain models, they have not been developed for mixed models (Lee, Sun, Sun, & Taylor, Reference Lee, Sun, Sun and Taylor2016) and extensions of Lasso to mixed modeling environments have not yet been developed for inference (Schelldorfer, Bühlmann, & Van de Geer, Reference Schelldorfer, Bühlmann and Van de Geer2011). Bayesian model averaging combines information from posterior distributions of parameters of interest across several models, weighting each by its posterior model probability (Hoeting, Madigan, Raftery, & Volinsky, Reference Hoeting, Madigan, Raftery and Volinsky1999).
However, it is important in Bayesian methods to formulate reasonable prior distributions for all parameters and model probabilities, and this can be prohibitive when the set of models under consideration is large (Claeskens & Hjort, Reference Claeskens and Hjort2008). Chen and colleagues (Chen, Ibrahim, Shao, & Weiss, Reference Chen, Ibrahim, Shao and Weiss2003) have developed an automatic method that requires few hyperparameters to be directly specified, but their method depends upon the existence of a comparable independent dataset that can be used for elicitation. By using the IT approach in this study, we obtained the robustness benefits of model averaging without the overhead of Bayesian methods, while still yielding familiar statistical outputs that support inferences (i.e., point estimates, CIs).
Our secondary analyses suggest that the IT approach may guard against over-identifying and overestimating effects compared to traditional methods. First, in our comparison of the IT approach with best fit and backward elimination approaches, main effects estimates between the three methods were generally very similar, although the IT method tended to have the widest CIs. Relationships between the three methods were more complex for quadratic effects and interactions. Backward elimination commonly “found” interactions that best fit did not, while IT tended to attenuate the estimated interaction coefficient ostensibly to zero.
Second, the high numbers of significant two-way interaction effects detected in the IT method were well above those expected from random chance under the global null, lending confidence to conclusions about significant IT model-averaged effects. For all four significant three-way interactions, the IT method estimates have very tight CIs that are extremely close to zero, especially compared to estimates that were found by backward elimination, suggesting that IT methods might further guard against overconfident results.
The generalizability of our results is limited by cohort characteristics, including that our sample is relatively young, highly educated, enriched for AD risk, has few males homozygous for ɛ4 and has limited follow-up on participants from URGs. In addition, use of APOE ɛ4 count is just one of many possible ways of parameterizing APOE-associated risk. The IT approach is computationally intensive and is not appropriate for every analysis scenario involving model selection, particularly those with few model terms. Like any model selection or averaging approach, IT model averaging methods are not without potential pitfalls.
For example, some question whether weights assigned to models can reasonably extend to weights on specific model parameters between the models (Cade, Reference Cade2015). Post-selection inference, model averaging and associated methods such as Lasso are still areas of active research and vetting through application. Applying these methods to additional data sets including simulated data sets with pre-specified characteristics (i.e., significant effects) will help inform when the more complex approaches yield most benefit in terms of predictive or inferential accuracy.
CONCLUSIONS
Data increasingly suggest that there are multiple risk factors that influence the path to Alzheimer’s dementia. Simple model selection approaches (e.g., building up models and comparing more complex to less complex nested models) will continue to be useful ways to handle relatively simple sets of model comparisons. However, as researchers seek to consider multiple risk factors simultaneously, more complex methods that are appropriate for mixed effects models and which avoid the pitfalls of methods like stepwise selection are needed. The IT model averaging approach offers a framework that allows results from multiple plausible hypotheses to provide weighted model-averaged parameter estimates and CIs which can then be used to make inferences about parameters and to estimate outcomes.
The results from the WRAP sample suggest that age-related trajectories are modified more by sex and literacy levels than by APOE ɛ4 allele count in this age range. These patterns may be important to consider when interpreting standard scores that ignore sex or literacy in their calculations. Future applications of the IT methodology will examine the interplay of sex and literacy with other potential cognitive trajectory-modifying variables such as polygenic risk, AD biomarkers, or lifestyle factors (e.g., exercise or diet).
SUPPLEMENTARY MATERIAL
To view supplementary material for this article, please visit https://doi.org/10.1017/S1355617718000954
ACKNOWLEDGMENTS
This research was supported by the National Institutes of Health awards R01 AG027161, R01 AG021155, R01 AG054059, UL1 TR000427 and by donor funds including the Wisconsin Alzheimer’s Institute Lou Holland Fund. Portions of this research were supported by resources at the Wisconsin Alzheimer’s Institute, the Wisconsin Alzheimer’s Disease Research Center, and the Geriatric Research Education and Clinical Center of the William S. Middleton Memorial Veterans Hospital, Madison, Wisconsin. Any opinions, findings, and conclusions or recommendations expressed in this material are those of the authors(s) and do not necessarily reflect the views of the NIH or the Veterans Administration. We gratefully acknowledge the WRAP study team who have carefully acquired the longitudinal data, and the WRAP participants who make this research possible. The authors of this manuscript have no conflicts of interest to report.