I. INTRODUCTION
Fe-based alloys containing nanocrystalline phase embedded in an amorphous matrix have attracted considerable attention as soft magnetic materials after the invention of Fe-Si-B-Nb-Cu (FINEMET) alloys by Yoshizawa et al.Reference Yoshizawa, Oguma and Yamauchi1 Subsequently, other nanocrystalline materials such as Fe-Zr-B-Cu (NANOPERM)Reference Suzuki, Makino, Kataoka, Inoue and Masumoto2 and Fe(Co)-Zr-B-Cu (HITPERM)Reference Willard, Huang, Laughlin, McHenry, Cross, Harris and Franchetti3 alloys with a variety of soft magnetic properties have been developed. Though Fe-Si-B-Nb-Cu and Fe-Zr-B-Cu alloys possess low coercivity, core loss, and magnetostriction combined with high permeability and saturation induction, these alloys are not suitable for applications above 250 °C due to low Curie temperature (Tc) of the residual amorphous matrix.Reference McHenry, Willard and Laughlin4 In case of Fe(Co)-Zr-B-Cu alloy developed by McHenry et al., the permeability is low, however, the Tc and the saturation induction (Ms) are considerably high as compared to the other nanocrystalline soft magnetic materials.Reference McHenry, Willard and Laughlin4–Reference Williard, Laughlin and McHenry7
The structure and magnetic properties of nanocrystalline Fe(Co)-Zr-B-Cu alloys have been studied by various investigators. Willard et al.Reference Williard, Laughlin, McHenry, Thomas, Sickafus, Cross and Harris5 have studied the crystallization behavior of Fe44Co44Zr7B4Cu1 alloy using synchrotron x-ray diffraction (XRD) method and reported that the crystallites are ordered α′-Fe(Co) phase (B2 structure). Muller et al.Reference Muller, Grahl, Mattern, Kühn and Schnell8 have reported that at higher Co content, fcc Co phase precipitates along with α-Fe(Co) phase in Fe86-xCoxZr7B6Cu1 alloys; the Tc of the amorphous phase was also found to increase with Co content and beyond 20 at.% Co, it is higher than the crystallization temperature of α-Fe(Co) phase resulting in difficulties of measuring Tc. Recently, the present investigatorsReference Arvindha Babu, Srivastava, Majumdar, Srivastava and Akhtar9 have observed that in (Fe0.65Co0.35)88Zr7B4Cu1 alloy, the structure of as-spun ribbons changes from fully amorphous to partially amorphous/nanocrystalline to fully nanocrystalline (bcc α-Fe(Co) + Fe2Zr) on decreasing the wheel speed and deteriorates the soft magnetic properties drastically. In this article, the structure and soft magnetic properties of melt-spun Fe-Co-Zr-B-Cu alloys containing different Co contents are reported.
II. EXPERIMENTAL PROCEDURE
Alloys with nominal compositions of (Fe1-xCox)88Zr7B4Cu1 with x = 0.2, 0.35, 0.5, and 0.6 have been prepared by melting Fe-Zr eutectic alloy along with high purity Fe, Co, B, and Cu in a vacuum induction furnace (at a vacuum of 1 × 10⁻⁵ mbar). Rapidly solidified ribbons (∼30μm thick and 2mm wide) of these alloys have been prepared using a vacuum melt spinner at a wheel speed of 47 m/s. A vacuum of 4 × 10⁻⁴ mbar was achieved followed by back filling with pure argon gas up to a pressure slightly below 1 atmospheric pressure. As-spun ribbons were sealed in quartz capsules under vacuum (2 × 10⁻⁵ mbar) and annealed at different temperatures (500–610 °C) for 1 h.
Structural and microstructural characterizations were carried out using x-ray diffractometer (Model: PHILIPS PW1830, Philips Electronic Instruments Corp., Mahwah, NJ) with Cu-Kα radiation and transmission electron microscope (TEM) (Model: FEI Tecnai-20 G2, Amsterdam, Netherlands). A differential scanning calorimeter (DSC) (Model: DuPont 910 DSC, TA Instruments, New Castle, DE) was used to evaluate the thermal stability and crystallization kinetics of the melt-spun ribbons. A vibrating sample magnetometer (Model: ADE EV7) was used to obtain thermomagnetic curves up to 600 °C (at a field of 500 Oe) and saturation magnetization (at an applied field of 5 kOe). A coercimeter (FÖSTER KOERZIMAT 1.095) was used to evaluate the coercivity of as-spun and annealed ribbons. Mössbauer experiments were carried out using a constant acceleration spectrometer (FAST ComTech, Oberhaching, Germany) in transmission mode with 25 mCi, 57Co(Rh) source.
III. RESULTS AND DISCUSSION
A. Structure and thermal stability
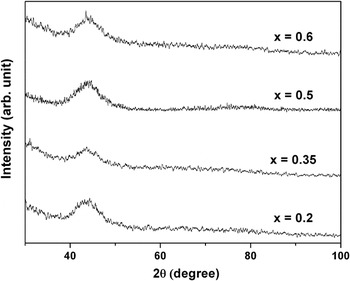
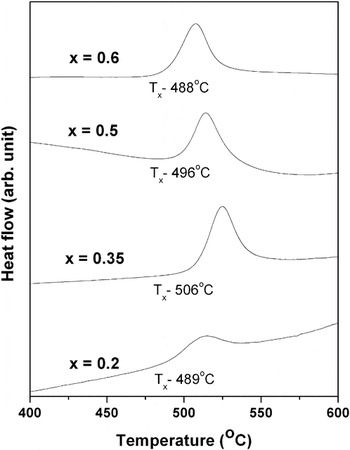
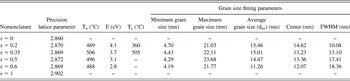
Figure 1 shows the XRD plots of as-spun ribbons of (Fe1-xCox)88Zr7B4Cu1 alloys with different Co contents. Broad halo peaks observed in all ribbons confirm the formation of complete amorphous phase. Figure 2 shows the DSC thermograms of as-spun ribbons obtained at a heating rate of 20 °C/min. An exothermic peak in all the thermograms reveals the crystallization of amorphous phase. As shown in Table I, the onset of crystallization temperature initially increases and then decreases slightly with Co content. Similar result has been reported in Fe-Co-Hf-B-Cu alloy elsewhere.Reference Liang, Kulik, Ferenc and Xu10 The activation energy of crystallization (E) was calculated from DSC thermograms obtained at different heating rates using Kissinger method.Reference Kissinger11 The slope of plot of ln (TP 2/β) versus 1/TP for different β values multiplied by gas constant yields the activation energy, where TP is peak temperature of the transformation and β is heating rate. The crystallization parameters have been listed in Table I. It can be observed that the activation energy decreases with increasing Co content.
X-ray diffraction (XRD) plots of as-spun ribbons of (Fe1-xCox)88Zr7B4Cu1 alloys.

Differential scanning calorimeter thermograms obtained at a heating rate of 20 °C/min.

Details of precision lattice parameter, crystallization parameters, and grain size fitting parameters.

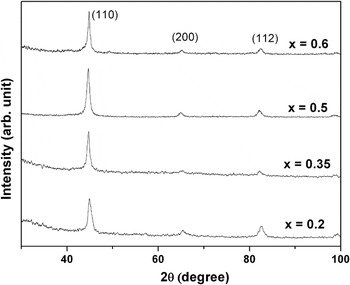
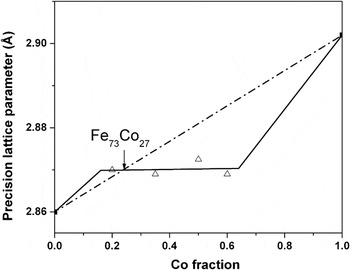
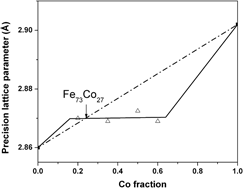
Figure 3 shows the XRD patterns of the ribbons annealed at 550 °C. It can be observed that annealing leads to the formation of bcc α-Fe(Co) phase in the all ribbons. The precision lattice parameters (a0) have been determined using Nelson–Riley (N–R) extrapolation method,Reference Nelson and Riley12 in which lattice parameter calculated from each peak is plotted against the N–R function [(cos2θ/sinθ) + (cos2θ/θ)]. A straight line is drawn by regression analysis and extrapolated up to zero value of N–R function. The intercept value gives the measure of the precision lattice parameter. Figure 4 shows the precision lattice parameters of α-Fe(Co) phase of all ribbons as a function of Co content. It is interesting to note that the precision lattice parameters are almost constant for all ribbons (the slope of the straight line drawn through regression analysis is 5 × 10⁻⁵, i.e., almost zero). The lattice parameters of pure bcc Fe and Co (calculated by converting fcc crystal structure of Co into bcc unit cell) are also indicated in the figure. A straight line conforming to the Vigard’s law of lattice parameter for bcc phase is drawn by joining a0 of bcc Fe and Co. The line cuts the experimentally observed a0 line at 27 at.% Co. Therefore, it may be concluded that the composition of α-Fe(Co) phase formed during annealing is approximately Fe73Co27 irrespective of initial Co concentration in the alloys.
XRD patterns of melt-spun ribbons annealed at 550 °C.

Precision lattice parameters of α-Fe(Co) phase as a function of Co content.

B. Microstructures
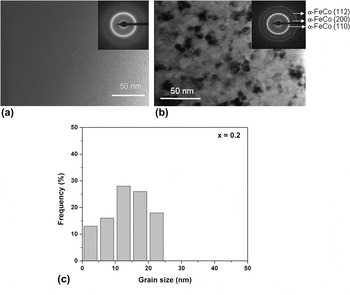
Figure 5 shows typical TEM bright field (BF) images of (a) as-spun and (b) annealed (600 °C) ribbon of x = 0.2 alloy. Inset shows the corresponding selected area electron diffraction (SAD) pattern. The featureless contrast in the as-spun ribbon and corresponding bright halo ring in the SAD pattern confirm the presence of fully amorphous phase in all the alloys. BF image of annealed ribbon shows the precipitation of α-Fe(Co) nanocrystalline phase. Similar results have also been observed in other alloys on annealing.
Transmission electron microscope bright field images of (a) as-spun and (b) annealed (600 °C) ribbon of x = 0.2 alloy. Histogram of grain size of the annealed ribbon is shown in (c).

The grain size (dav) was measured from both TEM BF and dark field images in an area of 500 nm × 600 nm for about 100–200 grains. Details of the measurement technique can be found elsewhere.Reference Majumdar, Bysak and Akhtar13Figure 5(c) shows a typical histogram for 600 °C annealed ribbon of x = 0.2 alloy. Histograms of grain size distribution for all annealed ribbons were fitted with the Lorentz curve and data obtained from the analyses of the histograms [average grain size, center of the histogram and full-width at half-maximum (FWHM), and minimum and maximum grain size] are given in Table I. It can be observed that the minimum and maximum grain sizes are almost same for all the annealed alloys. Although the center of the fitting curve is same for all the alloys on annealing, the FWHM increases with increasing Co content, which indicates a larger scatter in the grain size with higher Co content. The average grain size (dav) also decreases with increasing Co content.
C. Magnetic properties
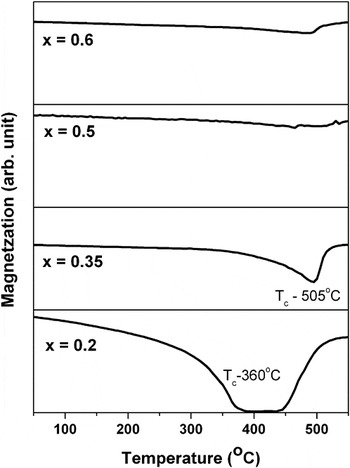
Figure 6 shows thermomagnetic curves of different as-spun ribbons up to 550 °C measured at a field of 500 Oe. The ferro- to paramagnetic transitions (Curie temperature, Tc) of the amorphous phase for x = 0.2 and x = 0.35 ribbons are found to be 360 and 505 °C respectively. The increase in magnetization at high temperature is due to the precipitation of high Curie temperature nanocrystalline α-Fe(Co) phase, which can be confirmed through DSC and XRD results. In case of other ribbons containing higher content of Co, the magnetization drops slightly and then increases further. This indicates that the crystallization starts before the amorphous phase becomes completely paramagnetic, i.e., crystallization and magnetic transition overlap.
Thermomagnetic curves of as-spun ribbons measured at a field of 500 Oe.

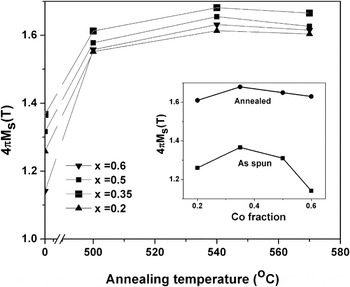
The variation of room temperature saturation magnetization (4πMs) with annealing temperature is shown in Fig. 7 for all ribbons. The 4πMs of as-spun ribbons are also indicated on the abscissa. As-spun ribbons show low 4πMs value and it increases upon annealing due to the precipitation of high saturation α-Fe(Co) phase, as confirmed from XRD and TEM studies. It is interesting to note that the saturation magnetization of all ribbons reaches a peak value when annealed at 540 °C. The decrease of 4πMs value at higher annealing temperature can be attributed to the increase of Zr/B concentration in Fe(Co) precipitate phase.
Variation of room temperature saturation magnetization (4πMs) with annealing temperature. Inset shows the variation of 4πMs value of as-spun and annealed ribbons (540 °C) with Co concentration.

The inset in Fig. 7 shows the variation of saturation magnetization values of as-spun and annealed ribbons (540 °C) with Co concentration. It can be observed that the 4πMs of as-spun ribbons initially increases up to 0.35 at.% Co and then decreases with Co content. This is in agreement with the Slater–Pauling curve for Fe-Co system.Reference Cullity and Graham14 In case of annealed ribbons, the decrease of saturation magnetization is not so pronounced.
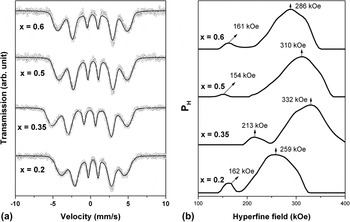
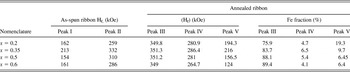
Detailed Mössbauer spectroscopy studies were carried out to understand the magnetic behavior of all ribbons in the as-spun and annealed conditions. All recorded spectra were analyzed using Lecaer program to get probable distribution of magnetic hyperfine fields P(H). Figure 8 shows the Mössbauer spectra [Fig. 8(a)] and the corresponding probable distribution of hyperfine fields [Fig. 8(b)] of as-spun ribbons containing different Co contents. The results of the analysis are given in Table II. All as-spun ribbons show a bimodal distribution of hyperfine field, which is the characteristic of amorphous phase and similar to the results published elsewhere.Reference Ponpandian, Narayanasamy, Chattopadhyay, Manivel Raja, Ganesan, Chinnasamy and Jeyadevan15 The peak I with higher hyperfine field value is corresponding to the Fe-rich regions and the peak II with lower values may be due to Fe atoms surrounded by B and Zr as nearest neighbors. It can be observed that the hyperfine value of Fe-rich region initially increases and then decreases with increase in Co content, similar to the behavior in Slater–Pauling curve.
(a) Mössbauer spectra and (b) corresponding probable distribution of the hyperfine fields of as-spun ribbons containing different Co contents.

Details of Mössbauer fitting parameters.

Peak I: Fe surrounded by Fe/Co rich neighbor.
Peak II: Fe surrounded by Zr/B neighbor.
Peak III: Fe in bcc Fe(Co) phase.
Peak IV: Fe at the interface between the bcc α-Fe(Co) and amorphous phases.
Peak V: Fe in residual amorphous matrix.
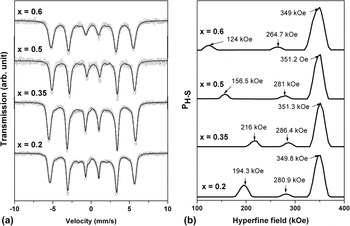
Figure 9 shows the Mössbauer spectra [Fig. 9(a)] and the corresponding probable distribution of hyperfine fields [Fig. 9(b)] of the ribbons annealed at 540 °C. Table II lists the hyperfine field parameters derived from Mössbauer spectra of annealed ribbons. All hyperfine distribution plots have three components: (i) a sharp peak with higher hyperfine field value (351 kOe), which can be assigned to the Fe atoms in bcc α-Fe(Co) phase; (ii) a broad low intensity peak with intermediate hyperfine field value (264–287 kOe), which may be assigned to the Fe atoms at the interface between the bcc α-Fe(Co) grain and amorphous matrix; and (iii) a broad peak with low hyperfine field (124–216 kOe) and low intensity, which may be assigned to Fe atoms in the residual amorphous matrix and enriched with Zr and B. It can be noted that the hyperfine field value of bcc α-Fe(Co) phase in all annealed ribbons is almost same and around 351 kOe. This implies that the composition of bcc α-Fe(Co) phase is same. Comparing the hyperfine field of Fe-35 at.% Co, which is 370 kOe, it can be inferred that nanocrystalline bcc α-Fe(Co) phase is devoid of other elements such as Zr, B, and Cu and the composition is around Fe73Co27, obtained from the Slater–Pauling curve.Reference Cullity and Graham14 The result is corroborated with the data obtained from the precision lattice parameter calculation. The spectral contribution of nanocrystalline phase, amorphous phase, and the interface has been calculated and is tabulated in Table II. This spectral contribution gives the relative Fe concentration in each phase. It can be observed that spectral contribution of nanocrystalline phase increases with increasing Co content, which indicates the presence of high concentration of Fe in high Co containing alloys. The spectral contribution of amorphous phase decreases with increasing Co content, indicating that the amorphous phase is enriched with Co.
(a) Mössbauer spectra and (b) corresponding probable distribution of the hyperfine fields of the ribbons annealed at 540 °C.

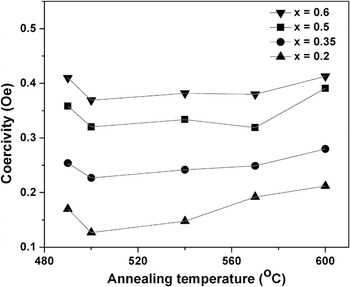
Figure 10 shows the variation of coercivity with annealing temperature for different compositions. The coercivity initially decreases and then increases again with annealing temperature. The behavior is similar to that of Fe-Si-B-Nb-CuReference Shahri and Beitollahi16 and Fe-Zr-B-CuReference Arvindha Babu, Majumdar, Sarkar, Akhtar and Chandrasekaran17 alloys. The initial decrease is due to the precipitation of nanocrystalline phase into the amorphous matrix. Under the application of magnetic field, the exchange coupling between the nanocrystalline and amorphous phases takes place causing an averaging out of magnetocrystalline anisotropy.Reference Herzer18 Further increase can be attributed to the increase of Zr/B concentration in Fe(Co) precipitate phase causing a net change of magnetostriction/magnetocrystalline anisotropy values. It can be further inferred that average coercivity values increases with Co content.
Variation of coercivity with annealing temperature for different compositions.

IV. CONCLUSIONS
Annealing of amorphous (Fe1-xCox)88Zr7B4Cu1 with x = 0.2, 0.35, 0.5, and 0.6 ribbons leads to the formation of nanocrystalline FeCo solid solution in amorphous matrix. Detailed lattice parameter calculation revealed that composition of FeCo solid solution is almost same (Fe73Co27). The result is corroborated with the data obtained from the Mössbauer spectroscopy. Saturation magnetization values of annealed ribbons are almost same irrespective of the initial composition due to the formation of nanocrystalline Fe73Co27 phase. The coercivity values increase with increasing Co.
ACKNOWLEDGMENTS
This work was supported by Defence Research and Development Organization (DRDO), New Delhi, India. The authors thank Dr. A.K. Singh (DMRL) and Dr. Kiran (MIDHANI) for their help in measurements and Dr. G. Malakondaiah, Director, DMRL for continued support and permission to publish this work.