1. Introduction
The Gulf Cooperation Council (GCC) is a regional intergovernmental economic union. The union includes Bahrain, Kuwait, Oman, Qatar, the Kingdom of Saudi Arabia (KSA), and the United Arab Emirates. The members of the GCC have a number of common features. All are monarchies, all have economies that rely on the production of hydrocarbons for export, and all have fiscal structures that provide large subsidies on local consumption of energy financed from oil and gas income.
Around 90% of fiscal revenue in the GCC area comes from oil and gas profits earned by state-owned enterprises. Another common feature is that all of the economies are facing significant long-term pressure for structural reform due to declining hydrocarbon reserves. Currently, this pressure is exacerbated by the comparatively low price of oil. The oil price fell from around $110 per barrel in 2014 to less than $US50 per barrel at the start of 2017. The current price is around $US65 per barrel.
Whether or not the price of oil will rise back to triple digits over the next decade is an open question. But what is not subject to debate is the need for the GCC economies to reform their economies. In nearly all cases, reform must start with fiscal consolidation. By this, we mean reducing budget deficits that have resulted from lower oil and gas revenues, broadening the range of taxation sources, and reducing subsidies across a wide range of education, health, and dwelling services and for energy.
In this paper, we focus on the largest of the GCC economies, Saudi Arabia. Using a recursive dynamic Computable General Equilibrium (CGE) model for KSA, we investigate the economic impact of a gradual removal of subsidies on the use of refined petroleum and electricity. The model is called the General Equilibrium Model for Saudi Arabia (GEMSA). Its core data are calibrated to the 2010 Supply Use Tables (SUT) updated to 2015.
Why is a dynamic CGE model useful in analysing the impact of energy price reform on trade? Understanding the impact of subsidy removal on trade is a complex issue that requires a detailed model that captures (1) the economic structure of the country under consideration (e.g. the linkages between commodities, sources, and users), (2) the level of economic diversification and trade exposure, and (3) detailed fiscal modelling including commodity-specific tax rates. To infer the impact of higher energy prices on trade, it is important to understand how factor prices and the use of intermediate and factor inputs change when energy subsidies are removed. These changes impact the level of domestic production, domestic use of goods and services, and foreign demand for domestically produced commodities. Thus, gaining insight into the impact of subsidy removal on trade would be difficult without understanding the impact on the markets and how markets adjust over time.
The rest of the paper is organized as follows. Section 2 provides background information on the current economic situation in the Saudi economy, with particular emphasis on pressures for fiscal reform.Footnote 1 A literature review on past studies where CGE models are used to simulate the impact of energy price reforms on different economic themes is given in Section 3. This review covers CGE studies in the MENA region and neighbouring countries where CGE models were specifically used to evaluate energy price reforms. Section 4 presents the Saudi CGE model used in this study. An overview of the data which form the core database is given in Section 5. Section 6 describes the simulation design. Results are presented in Section 7, and concluding remarks are in Section 8.
2. Pressures for Fiscal Reform
2.1 Lower Oil Price
Responses to the recent fall in oil prices differ among oil-exporting countries. Countries with a pegged exchange rate, such as the KSA, are using their reserves to absorb the initial fall in the oil price.Footnote 2 The Saudi Arabian Monetary Authority (SAMA) noted that when the kingdom ran a budget deficit of nearly 100 billion US$ in 2015, net foreign assets fell by 115 billion US$ (Bloomberg, 2016). Drawing on reserves is only feasible if the shock is temporary and there are enough foreign reserves.
In contrast to the KSA, most GCC countries responded to the fall in oil prices by embarking on fiscal reforms, including cutting government spending and energy subsidies. In addition to fiscal reform, GCC countries are implementing policies to improve energy efficiency, introducing stricter building guidelines, and investigating the possibility of generating electricity through renewable sources in order to meet future energy demand (IMF, 2015: 11).
2.2 Energy Subsidies
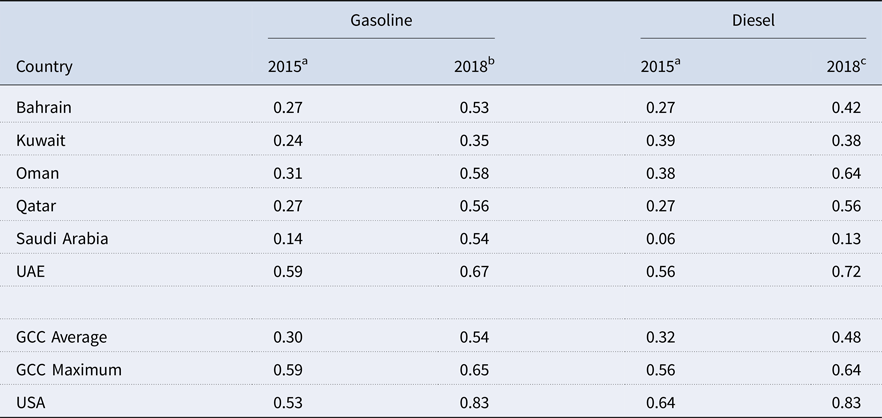
Energy products in the GCC countries are sold at prices lower than the international price. This is justified as a means to share the rents of natural resources among the population and to protect household purchasing power, especially that of vulnerable households. Table 1 shows for 2015 and 2018 the prices of gasoline and diesel products in the GCC and the USA (IMF, 2015; Global Petrol Prices, 2018). The data for 2015 show that the average price of gasoline and diesel products in the GCC, except the UAE, is below the US price and that the price varies between the countries. For 2015, the largest difference in the gasoline and diesel price is for Saudi Arabia where the price of gasoline and diesel is 74% and 91% lower than the USA price. Recent price reforms have reduced the price differentials in some GCC countries in 2018 (Table 1), but the differentials remain large.
Prices for gasoline and diesel products: GCC and the USA (US$ per litre)

b http://www.globalpetrolprices.com/gasoline_prices/. Price on 20 August 2018.
c http://www.globalpetrolprices.com/diesel_prices/. Price on 20 August 2018.
2.3 The Case of Saudi Arabia
The focus of this paper is to investigate the economic and trade impact of removing energy subsidies in the KSA. The KSA has 18% of the world's proven petroleum reserves and is the largest exporter of petroleum (OPEC). The KSA economy is highly dependent on oil and gas exports in terms of budget revenue, GDP growth, and overall economic stability. For the foreseeable future, oil sales remain a key driver of economic growth in the KSA and, therefore, any change in the oil price has an impact on the governments’ ability to finance its expenditure.
Data show a correlation between high (low) oil prices, government budget surplus (deficit), current account surplus (deficit), and an increase (decrease) in net foreign reserves (SAMA; OPEC). The general trend is that if the oil price rises (falls), the current account and government balance improves (worsens).
The consequence of the lower oil price is increasing budget deficits where expenditure targets exceed lower government revenue. Currently, deficits are financed via foreign reserves, which is not sustainable in the long run. What is clear is that there is scope for energy price reform, especially given the uncertainty regarding the oil price. Ceteris paribus, removing energy subsidies would certainly improve the government budget balance, but it would also have an impact on domestic production and use (including exports) of goods and services. As we explain in Sections 3, CGE models are useful in evaluating the impact of price reforms. Our model (GEMSA) is rich in detail and includes specific representations of various price and tax (subsidy) variables. Although we do not present the model equations in detail, we explain in Section 4 key equations and mechanisms through which price reforms impact the Saudi economy.
3. Using CGE Models to Analyse the Impact of Energy Price Reform
The literature covering various methodologies used to investigate the economic impact of energy price reform is extensive. For general literature reviews related to energy price reform, see Arze del Granado and Coady (Reference Arze del Granado and Coady2012), Bacon et al. (Reference Bacon, Bhattacharya and Kojima2010), and Ellis (Reference Ellis2010). The disaggregated nature of CGE models makes it a valuable tool to analyse the highly distortive impact of energy price reforms on the economy as a whole, industries or focusing on specific themes.
A large number of studies focus on issues such as household welfare and poverty (Akkemik and Li, Reference Akkemik and Li2015; Solaymani et al., Reference Solaymani, Kari and Zakaria2014; Naranpanawa and Bandara, Reference Naranpanawa and Bandara2012), regional development (Lin and Li, Reference Lin and Li2012; Aronsson et al., Reference Aronsson, Backlund and Sahlen2010), environmental issues (Al-Amin et al., Reference Al-Amin, Chamhuri and Hamid2009), energy markets (Yusoff and Bekhet, Reference Yusoff and Bekhet2016; Lin and Jiang, Reference Lin and Jiang2011; He et al., Reference He, Zhang, Yang, Wang and Wang2010), non-energy market (Maipita et al., Reference Maipita, Dan Jantan, Fitrawaty and Narimo2012; Gohin and Chantret, Reference Gohin and Chantret2010), and the labour market (Kuster et al., Reference Kuster, Ellersdorfer and Fahl2007; Welsch Reference Welsch1996) for countries such as China, Indonesia, and Malaysia.
Several studies focus on the MENA region, using CGE models to investigate the impact of subsidy reform. Gharibnavaz and Waschik (Reference Gharibnavaz and Waschik2015), Jensen and Tarr (Reference Jensen and Tarr2003), Karami et al. (Reference Karami, Esmaeili and Najafi2012), and Manzoor et al. (Reference Manzoor, Shahmoradi and Haqiqi2012) look at the effects of food and energy subsidy reform in Iran. These studies conclude that as a result of cuts in subsidies, targeted compensation can lead to large welfare increases, especially for lower income households. Energy subsidy reform leads to larger welfare improvements than food subsidies reform because initial energy subsidies are much larger than food subsidies. Other studies for Iran include AlShehabi (Reference AlShehabi2013), who models the removal of fuel and crude oil subsidies and assesses the impact on the labour market, and Hosseini-Yekani (Reference Hosseini-Yekani2011), who develops a model to analyse the impact of the removal of targeted subsidies on agricultural sector.
Cockburn et al. (Reference Cockburn, El Lahga, Robichaud, Tiverti and Zaki2014) links a dynamic CGE model with a micro model to simulate the impact of the removal of energy subsidy accompanied by transfers to children living in poverty for Egypt and Jordan. The results for both countries suggest that the removal of energy subsidies and the subsequent improvement in economic performance is not sufficient to offset potential poverty impacts. This result is driven by an increase in consumer prices, which offsets the increase in wages and profits. They further show that if a percentage of the savings on fuel subsidies is transferred to households, child poverty falls relative to the baseline.
Adams and Roos (Reference Adams and Roos2014) used a dynamic CGE model for Jordan to evaluate the impact of the removal of subsidies on food, gas cylinder, water, electricity, education, and health. Their results show that employment falls in the short-run due to an increase in the real cost of labour. The real cost of labour increases because removing the subsidy on electricity causes the price of spending to rise relative to the price of production. As a consequence, producers substitute away from labour and towards cheaper alternatives, such as capital. In their study, all of the benefit of the efficiency improvements returns to private consumers as increased real income. Accordingly, real private consumption increases even after making allowance for the increase in price paid for electricity by households.
Abouleinein et al. (Reference Abouleinein, El-Laithy and Kheir-El-Din2009) assess the short- and medium-run impact of phasing out of subsidies on energy products in Egypt. Their results show that if there are no transfers to households, total private consumption and real GDP falls. The main driver of this result is the increase in energy prices which spills over to consumption and production prices. All household groups show a decline in welfare with the richer quintiles showing the strongest response. This is because the richer households consume a larger share of the subsidized energy products than poorer households. The net result of cutting subsidies combined with targeted cash transfers favours the poor more than the rich, leading to an improvement in income distribution measures.
Breisinger et al. (Reference Breisinger, Engelke and Ecker2011) uses a CGE model for Yemen to evaluate the elimination of subsidies combined with alternative uses of the savings from the subsidy. Their results show that if all the subsidies are removed within one year, growth declines sharply and poverty increases. With this approach, pressure on the fiscal balance is reduced which allows the government to compensate vulnerable households. The authors prefer the gradual phasing out of subsidies because the impact on growth and poverty levels is less drastic. The drawback of the gradual approach is that it comes with a higher fiscal expense.
In general, these studies highlight three crucial issues. First, the value of subsidies on energy products is substantial and removing these subsidies reduces the size of the distortion in the economy. Second, the prices of energy commodities increase, increasing production costs. Ultimately, consumer prices increase, effecting household welfare. Third, compensation payments to those most affected by the removal of subsidies help mitigate the increase in costs of living and improve welfare.
Our aim with this paper is to contribute to the literature on energy price reform, by using a dynamic CGE model for Saudi Arabia to inform on the impact of energy subsidy removal on factor- and goods markets as well as trade. Several CGE models have been constructed for Saudi Arabia. Al-Thumairi (Reference Al-Thumairi2012) uses a dynamic CGE model to evaluate the impact of changes in oil and petroleum price on the economy, foreign savings, and the real exchange rate. Chemingui and Lofgren (Reference Chemingui and Lofgren2004) use a CGE model for Saudi Arabia to evaluate the impact of introducing an alternative tax structure. De Santis (Reference De Santis2003) uses a static model for Saudi Arabia to evaluate the short- and long-run effects of shocks to the crude oil market while the Research Department of Statistics Norway (Cappelen et al., Reference Cappelen, Choudhury, Johansen and Magnussen1998) constructed a CGE model for Saudi Arabia to evaluate the consequences of Saudi Arabian membership in the World Trade Organisation. Though all these studies are credible, they are now dated and based on datasets that are relatively aggregated. Our model, GEMSA is the latest and most up to date CGE model developed for KSA. The database is detailed and contains all of the key salient features of the current KSA economy.
4. The Model
Each industry in GEMSA produces (supply) output using as inputs intermediate commodities from domestic or imported sources, capital, land, and labour distinguished by nine occupational types. The production specification is managed by a series of separability assumptions. Each nest includes demand equations derived from solving optimization problems. For example, the labour nest includes equations which determine industry's occupation-specific labour demand and that minimize total labour cost subject to a constant elasticity of substitution (CES) production function. Nests for the demand for primary factors and composite intermediate commodities represent a similar optimization problem.
In creating capital, investors choose inputs that are cost minimizing combinations of Saudi and foreign commodities. We assume that domestic and imported varieties of commodities are imperfect substitutes for each other, using constant elasticity of substitution (CES) functions. GEMSA has one representative household. This household's optimization problem is solved in two nests. In the first nest, we assume that the household choose a combination of composite commodities to maximize utility subject to their budget. In the second nest, the household chooses commodities from domestic or imported sources to minimize costs subject to a CES function.
The export demand equations for Saudi commodities relate export volume inversely to foreign-currency price.Footnote 3
GEMSA has one central government and includes equations determining the consumption of source-specific commodities by government as well as direct and indirect taxes. Government demand is either determined exogenously or can be linked to aggregate household consumption. All sectors are competitive and all commodity markets clear.
GEMSA recognizes two main types of dynamic adjustment: capital accumulation and a lagged labour market adjustment mechanism (Dixon and Rimmer, Reference Dixon and Rimmer2002: 4–10). During a dynamic year-on-year simulation, these mechanisms guide labour and capital market from a short-run environment (real wages are sticky and capital is fixed while rates of return and employment adjusts) to a long-run environment (employment and rates of return are fixed while the real wage and capital adjusts).
While we refer to short-run and long-run environments, we do not explicitly define the closures associated with each of these environments in a dynamic simulation. Rather, in year-on-year dynamic simulations, the mechanisms described above and elaborated on below, lead the economy to a long-run state that can be described by the exogenous status of employment and the rates of return. Thus, the effect of these mechanisms is that the long-run deviations from baseline are consistent with a long-run closure.
We assume that industry-specific capital stock accumulates according to
 $$K_{i }^{end} \left( t \right){\rm } = {\rm }K_{i }^{start} \left( t \right)*\left( {1-D_i} \right){\rm } + {\rm }I_i\left( t \right)\,{\rm for}\,{ i }\in {\rm IND}$$
where
 $K_{i }^{end} \lpar t \rpar $ is the capital stock at the end of year t,
- $K_{i }^{start} \lpar t \rpar $ is the start-of-the year capital stock,
D i is the rate of depreciation, which is GEMSA is treated as a parameter, and
I i(t) is the industry-specific investments undertaken during year t.


Equation (2) relates industry-specific investment in year t positively to the rates of return (ROR), defined as the ratio of the rental price of capital to the cost of a unit of capital.
 $$I_i\lpar t \rpar = f\lpar {ROR_i\lpar t \rpar } \rpar \,{\rm for}\,{ i }\in {\rm IND}$$
Equation (1) shows that in year t = 0, with given values for  $K_{i }^{start} \lpar 0 \rpar $ and investments undertaken during the year, end-of-the-year capital stock
 $K_{i }^{end} \lpar 0 \rpar $ is determined. For year t + 1, the start-of-the-year capital stock (
 $K_{i }^{start} \lpar {t + 1} \rpar $) is equal to the end of the previous year's capital stock (
 $K_{i }^{end} \lpar 0 \rpar $). With investment undertaken during year t + 1 determined endogenously, capital stock at the end of year t + 1 (
 $K_{i }^{end} \lpar {t + 1} \rpar $) is then determined, which is then set equal to the start of year t + 2 capital stock. Thus, in a year-on-year simulation we note that: (1) start-of-the-year capital stock is related to net investments in the previous year and (2) while formally endogenous, start-of-the-year stock variables are effectively exogenous within any given year of a year-on-year simulation. Current year investments are linked to changes in the rates of return (2). These rates of return are forced to gradually move towards their long-run baseline levels. Therefore, in the short-run, negative(positive) outcomes manifest as negative(positive) changes in the rates of return and investment (while capital remains fixed). In the long-run, negative(positive) outcomes manifest as negative(positive) changes in capital stocks (rates of return are at their baseline value).
GEMSA models the labour market where wages are sticky in the short run and flexible in the long run. Equation (3) describes the simplified wage adjustment mechanism, which is operational in the policy simulation.
 $$\displaystyle{{W_{\lpar t \rpar }^p } \over {W_{\lpar t \rpar }^b }}-\displaystyle{{W_{\lpar {t-1} \rpar }^p } \over {W_{\lpar {t-1} \rpar }^b }} = \alpha \left({\displaystyle{{E_{\lpar t \rpar }^p } \over {E_{\lpar t \rpar }^b }}-1} \right)$$
where  $W_{\lpar t \rpar }^b $ and
 $W_{\lpar t \rpar }^p $ are the wage in the baseline and policy simulation in year t, respectively;
 $W_{\lpar {t-1} \rpar }^b $ and
 $W_{\lpar {t-1} \rpar }^p $ are the wage in the baseline and policy simulation in year t – 1, respectively;
 $E_{\lpar t \rpar }^b $ and
 $E_{\lpar t \rpar }^p $ is employment in the baseline and policy simulation in year t, respectively; and α is a positive parameter.
In the policy simulation,  $W_{\lpar t \rpar }^b $,
 $W_{\lpar {t-1} \rpar }^b $, and
 $E_{\lpar t \rpar }^b $ are exogenously determined and equal to their baseline values.
 $W_{\lpar t \rpar }^p $,
 $W_{\lpar {t-1} \rpar }^p $, and
 $E_{\lpar t \rpar }^p $ are determined endogenously in the policy simulation. Equation (3) states that if employment in the policy simulation is above employment in the baseline, then the deviation between years in the real wage rate will move above its baseline level. Typically, a positive(negative) labour market outcome manifests in the short-run as an increase(decrease) in employment away from the baseline, while real wages remain sluggish. In the long run, a positive(negative) outcome manifests as an increase (decrease) in the real wage away from the baseline while employment moves toward the baseline.
In this paper, we are interested in the removal of subsidies on petroleum and electricity commodities used as intermediate inputs by industries or as a final commodity by the household. GEMSA includes three paths through which changes in commodity-specific subsidies are accounted for.
1. Subsidies are accounted for in the purchasers’ price of commodities, and any change in energy prices has direct and indirect impacts. The direct impact of price reform is the increase in the price of energy commodities. Indirect impacts refer to the knock-on effect of an increase in the price of energy commodities, which are used as intermediate inputs in the production of other commodities. Overall, when energy subsidies are cut, the cost of production rises, which ultimately increases consumer prices. For example, electricity and petroleum products are used as intermediate inputs in the production of other goods. As subsidies are removed, the prices of these energy products will increase, causing the cost of production of other goods to increase. Ultimately, if the price of domestically produced commodities increases relative to the average price of the commodity, users will demand less of the domestic commodity and more from the cheaper imported alternative.
2. Price reforms are accounted for through changes in government revenue and ultimately the government budget balance. Ceteris paribus, removing subsidies will improve the balance on the government account.
3. Improved government revenue allows for greater government spending immediately or in the future. Part of the saved expenditure may be transferred back to vulnerable groups, such as strategic industries or households, in an attempt to alleviate the impact of an increase in prices.
5. The GEMSA Database
The core database is calibrated to a set of 2010 Supply–Use Tables (SUT) updated to 2015 National accounts data (GAS, 2015). The initial database for a CGE model is important because: (1) it contains information regarding the structure of the Saudi economy in the base year; (2) it is useful in the interpretation of results; and (3) in a Johansen-style CGE model, it is the initial solution to the CGE model (Roos et al., Reference Roos, Adams and van Heerden2015). The SUT is not in the required format for the CGE database and therefore a number of steps were taken to convert the published data into the format required by GEMSA. We highlight the following characteristics of the core database.
The model requires a core database with separate matrices for basic, tax, and margin flows for both domestic and imported sources of commodities sold to domestic and foreign users, as well as matrices for the factors of production, namely labour, capital, and land. Commodities can be used as intermediate inputs by domestic industries, investors, a representative household, foreigners, the government, or held as inventory. GEMSA includes a detailed treatment of margins. For each commodity valued at basic prices, we have a corresponding margin matrix, showing the cost of margin services used to facilitate the flow of commodities from all sources to the users of these commodities.
Of special interest in this paper is the modelling of taxes and subsidies. For each commodity valued at basic prices, we have tax matrices showing the indirect taxes paid on the use of commodities from all sources by various users. Consistent with the published national accounts, the elements in the tax matrices in the core database are set to zero, reflecting the fact that formally, there are no indirect taxes or subsidies on the use of commodities.Footnote 4 There are import duties, which are explicitly accounted for in the database via a satellite matrix, and are also included in the flow of imported commodities valued at basic price. This allows for the calculation of ad valorem rates as the ratio between tax revenues and the relevant basic flows of commodities on which the taxes are levied.
The database includes matrices showing the value of primary factors used by industries in current production. These matrices include inputs of three factors of production: occupation specific labour payments by industry, capital rentals by industry, and natural resources by industries. Natural resource use is restricted to agricultural and mining industries. Only industries pay production taxes. The database shows that labour, capital, natural resources, and production taxes are only used in current production. The database includes a multi-product matrix showing the basic value of commodities produced by the various industries or stated differently; it shows the value of industry output. See Appendix 1 for a summary of the cost and sales structures captured in the database.
The data suggest that the economy is largely based on, and driven by, one sector – namely crude oil and gas. As an industry, crude oil and gas contribute the most in terms of value added, followed by the service industries. Manufacturing industries contribute the least. The economy therefore lacks diversification in terms of production, especially in manufacturing.
In terms of industries producing traded goods,Footnote 5 the data suggest that exports are dominated by crude oil and gas, with 85% of total export income coming from the sale of crude oil and gas to foreign markets. Other commodities that are exported include chemicals and refine petroleum, but they contribute very little in terms of export earnings.
In terms of imports, the data suggest large import shares of commodities used by all domestic users. Import shares are high for food and beverages, textiles and clothing, basic metals and machinery with nearly all of metal ores, tobacco, motor vehicles, radio and communication equipment used in KSA, sourced from outside the local market. The data further suggest that imports for manufactured commodities are much higher than for the services sectors. In summary, production is largely concentrated on crude oil and gas, which is also the mainly exported. Commodities used mainly by households, investors, and as intermediate inputs are mostly imported.
6. Simulation Design
To conduct policy simulations with GEMSA, we run two simulations. The first simulation, known as the baseline forecast simulation, models the growth of the economy over time in the absence of the policy change under consideration. In this study, the baseline incorporates macro forecast data from the IMF's World Economic Outlook Database (IMF, 2018). Specifically we adopt forecasts for GDP, employment, and population growth. It is also in the baseline simulation that we incorporate the subsidy on petroleum and electricity.
The second simulation is the policy simulation. The policy simulation generates a second forecast that incorporates all of the exogenous features of the baseline forecast, plus policy-related shocks reflecting the removal of subsidies. The results of the policy simulation are typically reported as percentage deviations away from the baseline forecast. We solve the model using GEMPACK (Horridge et al., Reference Horridge, Jerie, Mustakinov and Schiffmann2018; Harrison and Pearson, Reference Harrison and Pearson1996).
We report results for three policy simulations. In all policy simulations, subsidies are removed gradually from 2018 to 2025.Footnote 6 The difference between policy simulations is the level of support (incentives) provided to industries and households.Footnote 7
Sim 1 – no incentives for industries and no lump sum payment to households: The revenue saved by the government by removing the energy subsidies improves the government budget balance. In other words, no support or incentives are given to any industries to offset the increased price of energy.
Sim 2 – incentives provided to the directly affected industries and lump sum payment to households: The revenue generated by the government is partly returned to those industries that are directly affected. The amount of revenue returned is sufficient to ensure that the rate of return on capital in those industries remains at its baseline level. This ensures that capital and investment in those industries are not affected by the reduction in the subsidy. These industries produce petroleum products and electricity. The remainder of the support is handed to households as a non-distorting lump sum payment.
Sim 3 – incentives provided to all manufacturing industries and lump sum payment to households: Same as Sim 2, but monies are returned to all manufacturing industries to ensure that investments from 2018 onwards are not affected. The remainder is handed back to households as a lump sum payment.
Our strategy is to explain the results for Sim 1 and then compare Sim 2 and Sim 3 with the outcomes of Sim 1.
6.1 Closure and Simulation Assumptions
The labour market is characterized by short-run stickiness of the real wage with flexible employment adjustment. The labour market transitions from this short-run environment to a long-run environment in which real wages adjust and employment moves to its long-run baseline level. Therefore, in policy simulations, employment can deviate from its baseline level initially, but thereafter, real wage adjustment steadily eliminates the short-run employment consequences. In the long run, the benefits of policy outcomes are realized almost entirely as a change in the real wage rate, rather than a change in national employment. This labour-market assumption reflects the idea that in the long run national employment is determined by demographic factors (birth rate, death rate, and level of immigration), which we have assumed are unaffected by the policy.
Subject to the economy-wide average propensity to consume (APC), private consumption expenditure is determined as a fixed proportion of disposable income. In all three policy simulations, the economy-wide APC is an endogenous variable that moves to ensure that the balance of trade (BOT) remains at its baseline level.
Capital and investment are specific to each industry. GEMSA allows for short-run deviations in expected rates of return from their baseline levels. These cause deviations in investment and hence capital stocks that gradually erode the initial deviations in rates of return. Provided there are no further shocks, rates of return revert to their baseline levels in the long run.
Real public spending is forced to remain on its baseline path in each of the policy simulations.
In Sim 1, the government budget balance is allowed to move given the increase in government revenue due to the removal of subsidies. However, in the alternative policy simulations, we assume that the monies saved from the removal of these subsidies are returned partly to the directly affected industries (Sim 2), or to all manufacturing industries (Sim 3) to ensure that investments planned from 2018 onwards are not affected by the reduction in demand as the subsidies are removed. The remainder is handed to households as a non-distorting lump sum payment.
The balance of trade (BOT) is exogenously held at its baseline path via model-determined (endogenous) movements in the economy-wide average propensity to consume (APC). The justification for this closure choice is that Saudi-Arabia's net stock of foreign liabilities (or depletion of assets) should not be allowed to accumulate to unsustainable levels. A stable asset-to-GDP ratio requires the current account balance to be stable as a proportion of GDP. In GEMSA, the balance on current account is approximated in the long-run by the BOT.
GEMSA contains many variables to allow for shifts in technology and household preferences. In the policy scenarios, most of these variables are exogenous and have the same values as in the baseline projection.
6.2 Modelling Petroleum and Electricity Subsidies
As mentioned in Section 5, the core database reports no initial indirect tax or subsidy data. To simulate the removal of subsidies in the policy simulation, we explicitly introduce subsidies in the baseline simulation.Footnote 8 The baseline results therefore include subsidies on petroleum and electricity, whereas the policy run simulates the removal of these subsidies.
6.2.1 Subsidies in the Baseline
Based on Jadwa Investment (2015) and historical IMF (2013) information, we calculated that in 2015 the subsidy cost on petroleum products and electricity was approximately 221 billion riyal, which is equivalent in value to 9.1% of GDP in 2015.Footnote 9 We introduce these subsidies gradually over the period 2016, 2018. By 2018, all subsidies on petroleum and electricity are accounted for in the baseline simulation. We assume that these levels of support are maintained through the simulation period.
6.2.2 Subsidies in the Policy Simulation
Saudi Arabia is extending the timeline to remove subsidies. The government aims to increase domestic energy price levels gradually between 2018 and 2025 (compared to a previous target of 2020) (Nereim, Reference Nereim2017). Therefore, in the policy simulations we reduce the petroleum and electricity subsidy on the use of these products gradually from 2018 to 2025. GEMSA then determines the adjustment in regulated prices.
7. Results
Below, we present the macro and industry-specific results of the gradual removal of energy subsidies for the three alternative scenarios. Macroeconomic variables are dealt with first, followed by results for industry output. Results for other variables are available and can be requested by writing to the corresponding author.
7.1 Results for Macroeconomic Variables – Sim 1
In GEMSA, factor markets adjust from a short-run environment to a long-run environment. In the short run, the national real wage rate is sticky but employment can adjust, while capital stocks are fixed and rates of return are flexible. The reverse holds in the long run: fixed national employment and flexible real wage rate; fixed rates of return and flexible capital stocks.
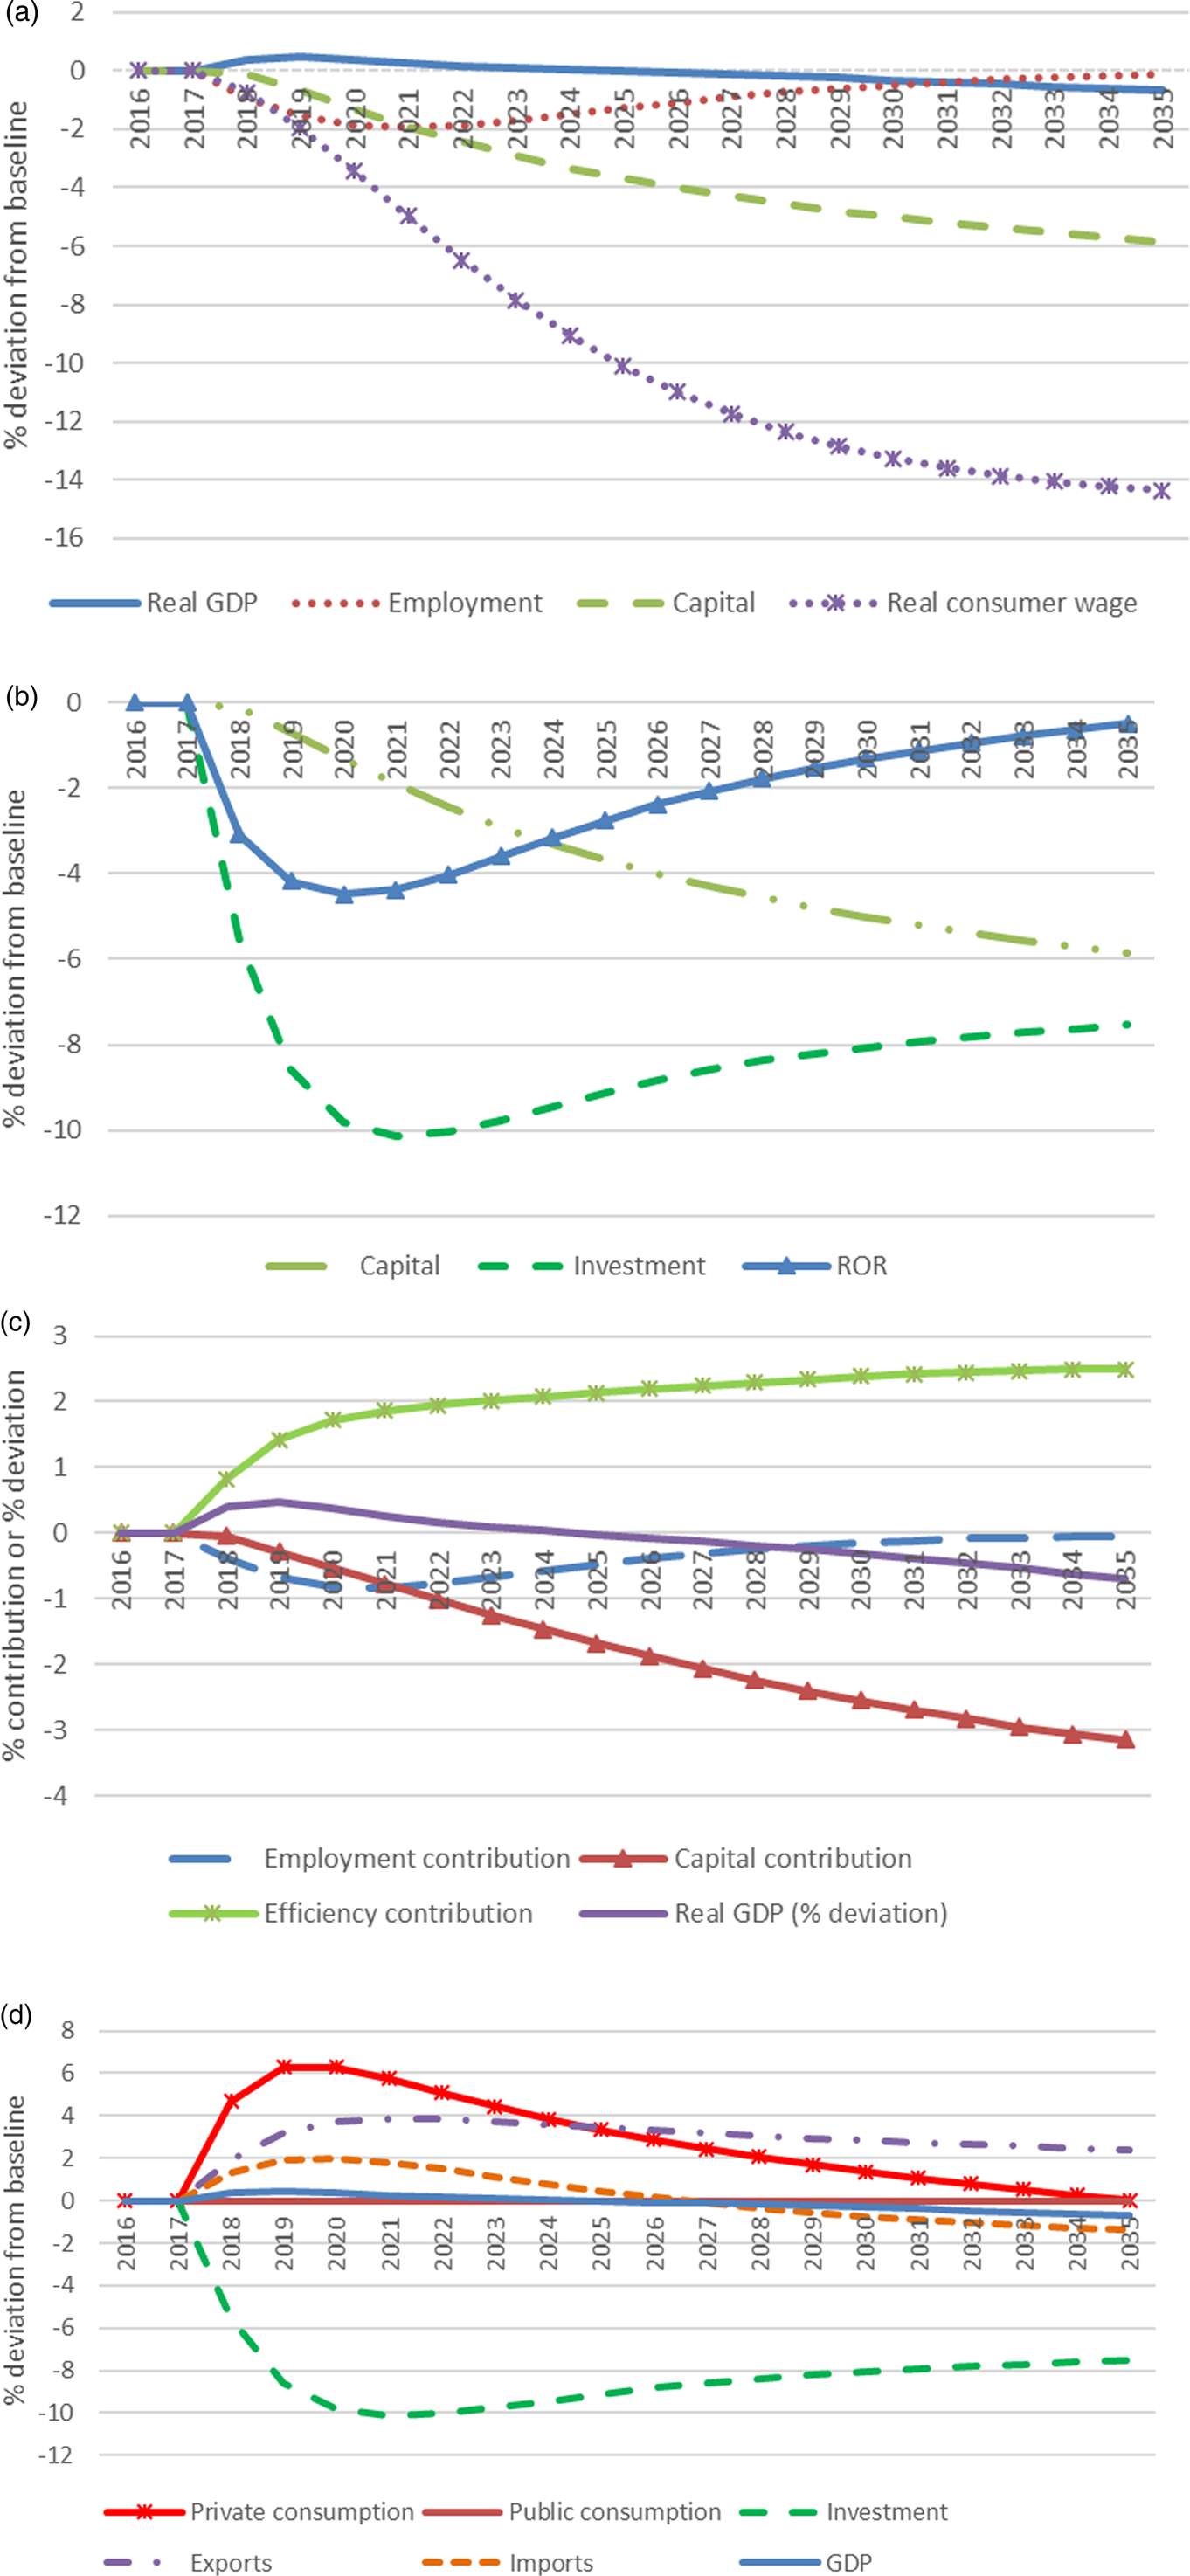
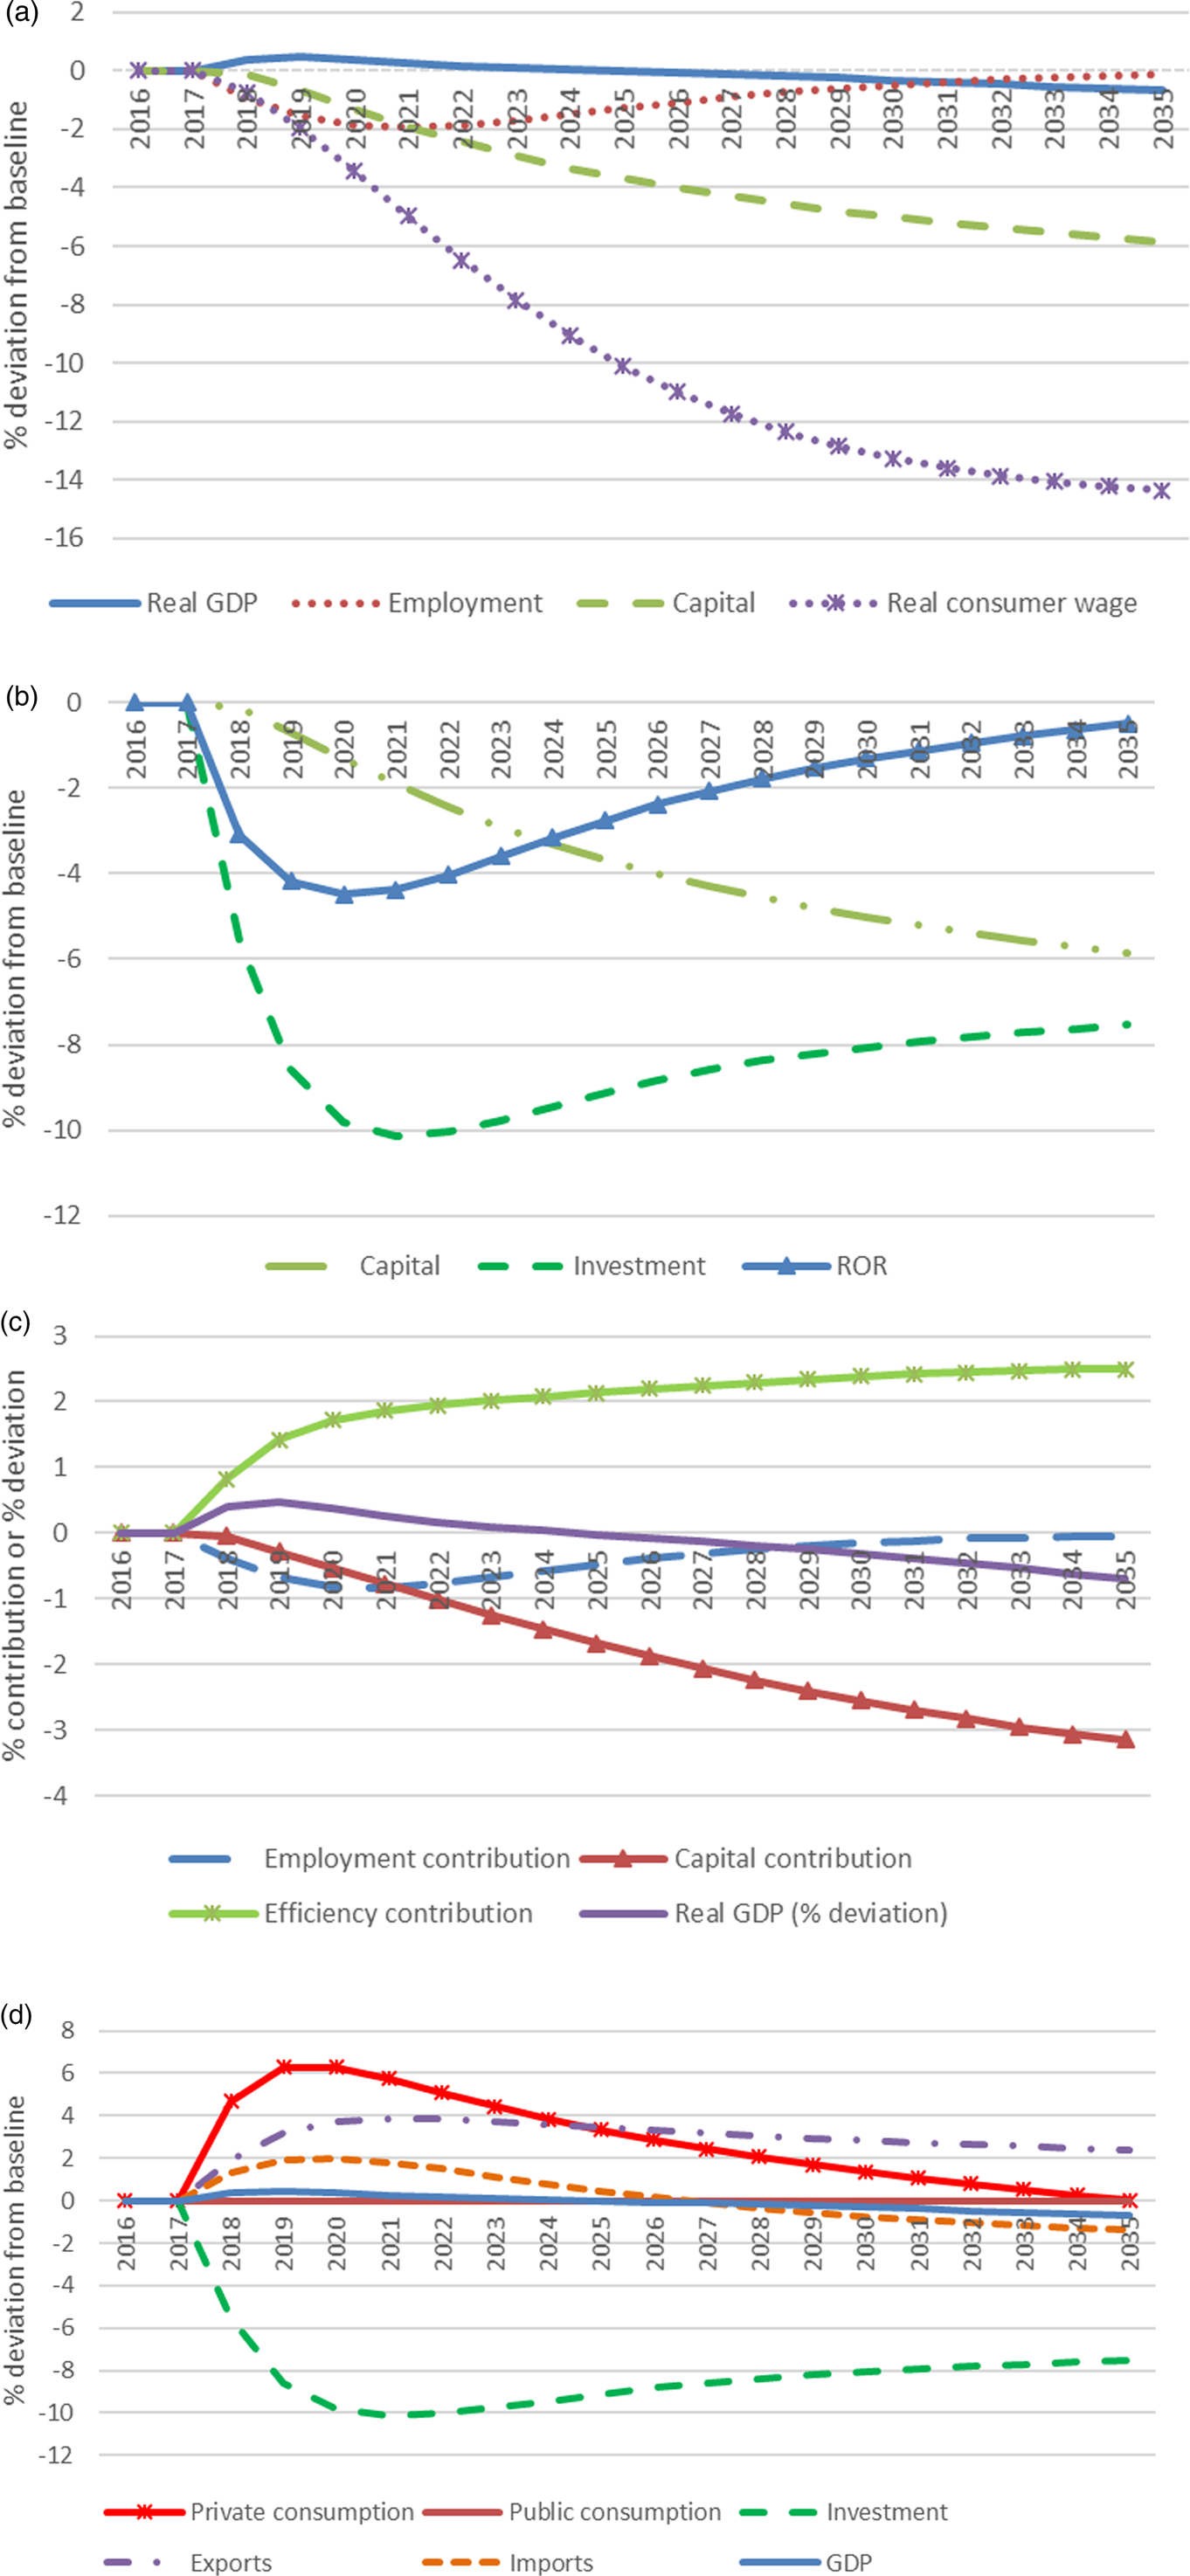
Figure 1a shows deviations from base case values for the key labour market variables – employment and the consumer real wage rate. Initially, subsidy removal causes employment to fall relative to its base case level. Over time, employment returns to its base case value via real wage adjustment.
Macro results (% deviation from baseline). (a) National employment, capital stock, real GDP, and real wage; (b) Investment, capital, and rates of return; (c) Contribution to the overall deviation in real GDP; (d) GDP expenditure components
The short-run fall in employment is due to our assumption of a sticky real consumer wage rate. The consumer real wage rate is defined as the ratio of the national price of labour to the CPI. A reduction in energy subsidies causes, across the economy, the price of spending (e.g., the CPI) to rise relative to the price of output (e.g., the price of GDP). If the real consumer wage is initially sticky, then the real cost of labour (defined as the price of labour relative to the price of GDP) will increase when subsidies are removed. An increase in the real cost of labour reduces the incentive to employ, thus lowering the economy-wide labour to capital ratio. With capital fixed in the short-run, employment must fall.
Over time, the real wage adjustment mechanism in the model steadily eliminates the short-run employment consequences of the reduction in energy subsidies. Thus, as shown in Figure 1a, we assume that in the long run the elimination of the energy subsidies has a negligible impact on employment, with all of the labour-market adjustment revealed as a fall in the real wage rate. By 2033, the real wage rate is around 14% below its base case level.
As the real wage rate progressively falls relative to its base case level, so capital declines. A decline in the real wage rate causes employers to use more labour and less capital. With labour returning to its base case value, capital must fall. As shown in Figure 1b, by the end of the simulation period capital is down almost 6% relative to its base case value.
Capital is the accumulation of investment. Thus, as shown in Figure 1b, as capital falls relative to base, so must investment. The investment response is relatively strong in the early years. By 2021, national investment has fallen relative to base by around 10%. This fall is attenuated in later years due to capital adjustment between sectors. By the end of the period, investment is down 7.8% relative to its base case value.
Figure 1c shows the percentage deviation in real GDP, along with contributions to the GDP deviation due to changes in employment and capital, and to changes in economic efficiency (defined below).
In the short-run, with capital unchanged and employment below base, we would expect real GDP to also fall relative to its base case level. However, as shown in Figure 1c, GDP rises relative to base in the first few years. In the long-run, with capital below its base case value and employment unchanged, we would expect real GDP to fall. Figure 1c shows that real GDP does indeed fall relative to base case values over time, but by less than suggested by the changes in factor inputs. In the long-run, real GDP is down 0.8% relative to its base case value, while employment is unchanged but capital has fallen by around 3%.
To explain the pattern of change for real GDP, we begin with the following equation defining GDP at market price from the input side as the sum of factor cost and the value of indirect taxes net of subsidiesFootnote 10:
 $$GDP = PL \times L + PK \times K + P \times Q \times T$$
where
GDP is nominal GDP;
PL and PK are the prices of labour and capital;
L and K are the quantities of labour and capital;
T is the average ad valorem rate of tax; and
P × Q is the tax base on which the average tax rate is levied (P is before-tax price and Q is quantity).
The percentage change form of (4) is:
 $$GDP\lpar {\,pgdp + xgdp} \rpar = PL \times L\lpar {\,p\ell + \ell } \rpar + PK \times K\lpar {\,pk + k} \rpar + P \times Q \times T\lpar {\,p + q + t} \rpar $$
where lower case names denote percentage changes in the corresponding upper case variables. For example, xgdp is the percentage change in real GDP and pgdp is the percentage change in GDP price.
Dividing (5) through by GDP yields the share-equation:
 $$pgdp + xgdp = SL\lpar {\,p\ell + \ell } \rpar + SK\lpar {\,pk + k} \rpar + ST\lpar {\,p + q + t} \rpar $$
The percentage change in real GDP is assumed to beFootnote 11:
 $$ xgdp = SL \times \ell + SK \times k + ST \times q - a$$
where a is minus the rate of technological progress expressed as a percentage. Note that the ‘a’ term captures all of the change in real GDP directly associated with improvements in the productivity of labour and capital.
Equation (7) and Figure 1c allow us to understand the percentage deviations in real GDP in terms of the contributions due to changes in employment (SL × l) and capital (SK × k), and due to the change in the quantities of taxed inputs (ST × q). Note that equation (7) contains two ‘efficiency’ terms.
• The ‘a’ variable represents the increase in technological efficiency. In the simulations reported in this paper, technological progress of factors (or technological efficiency) is assumed to be unaffected by the removal of energy subsidies. Thus ‘a’ is zero.
• The (ST × q) term captures the increase in allocative efficiency. In a world where goods and services are taxed, allocative efficiency increases when the volume of taxed goods (the variable ‘q’) increases. For the case of energy subsidies, ST is negative. Thus, the allocative efficiency term increases when the volume of subsidized goods falls.
According to Figure 1c, in the short run even though factor inputs fall real GDP is increased by subsidy removal. This is because the reduction in factor inputs is more than offset in the first few years by an improvement in allocative efficiency (ST × q) due to elimination of the large subsidy-related distortion in the economy. We note that in 2018, the share of taxes in GDP was around –8.0%. This is captured by ST in the (ST × q) term. The negative share reflects the predominance of the energy subsidies. The removal of energy subsidies causes domestic demand for energy commodities to fall. This is captured by q in the (ST × q) term.
When energy subsidies are first removed (i.e. ST rises but remains negative), q falls and allocative efficiency improves. This is illustrated by the green bars in Figure 1c. This improvement is pronounced in the first few years of the simulation. In these years, the efficiency gains outweigh the fall in employment and capital, leading to increased real GDP.
Over time, ST rises, i.e the negative share becomes smaller, as the ad valorem subsidy base falls. Gradually the cumulative allocative efficiency gains level off. At the same time, employment rises towards its base case value, but capital progressively falls. Eventually, the loss of real factor inputs more than outweighs the efficiency gains causing real GDP to fall below its base case value. The fall in real GDP, however, is less than would be implied by the changes in factor inputs alone.
Figure 1d reports deviations in the expenditure side components of GDP, namely real private consumption (C), real public consumption (G), real investment (I), and net exports (X – M). Via assumption, public spending (G) is exogenously held at its base case level throughout the simulation period. As seen in Figure 1b, investment (I) falls to accommodate the decline in capital available for production.
As can be seen in Figure 1d, real private consumption rises relative to its base case value and then, over time, slowly falls back towards base. In this simulation, we fix the nominal Balance of Trade (BOT) at its base line level (Section 6.1) via model-determined adjustment to the average propensity to consume (or, in reverse, the average propensity to save). Thus, if there is pressure for the BOT to improve (deteriorate), all else unchanged, the average propensity to consume must fall (rise).
With local energy prices increasing and demand falling, producers of commodities such as crude oil, look to foreign markets to sell their output. This leads to a deterioration of the terms of trade. Thus, with the nominal trade balance unchanged, the real trade balance (X–M) must move towards surplus – as shown in Figure 1d, the deviations in export volume (X) lie above the deviations in import volume (M). For this to happen, the deviation in real GDP (Y) must exceed the deviation in real gross national expenditure (C + I+G). With real government spending held at baseline and investment decreasing, real private consumption increases relative to its base case value in all years of the simulation (see Figure 1d).
7.2 Industry Results – Sim 1
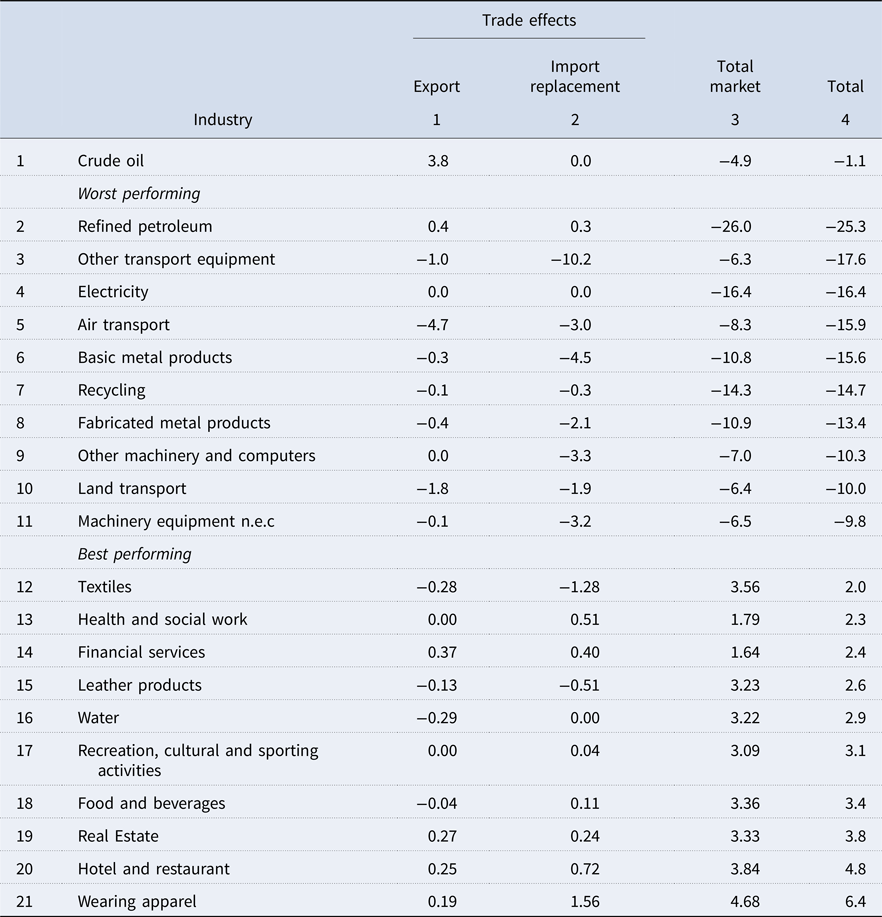
This section focuses on the effect of the removal of energy subsidies on industry output, highlighting the influence of trade effects. For reporting purposes, we rank the industries based on the percentage change in output for 2035. Table 2 presents the results for the crude oil and gas industry (line 1), and then for the ten most adversely affected (lines 2–11) and ten most advantaged (lines 12–22) industries. The percentage deviation in industry output is shown in column 4. The remaining columns separate the overall change in output into contributions from three underlying market forces. The first column of numbers (export) shows the contribution to the change in domestic commodity output, brought about by the change in exports. The second column of numbers (import replacement) is the contribution due to relative price changes favouring import replacement. The third column (market effect) shows by how much we would expect domestic-commodity production to change if output of the domestic commodity increased in line with the change in domestic demand for the commodity, regardless of source (i.e., domestic or imported).
Decomposing output results from Sim 1, 2035 (%)

Table 2 shows that the output of crude oil and gas (line 1) is 1.1% below baseline in 2035 (column 4). Column 3 shows that a contraction in overall size of the local market contributes 4.9 percentage points to the fall in total production. This is expected because although most of the crude oil and gas is exported, domestic industries, such as petroleum, chemicals, and electricity, also use oil and gas as an intermediate input. As these industries contract, so does their demand for crude oil and gas. Column 1 shows that increased export demand contributes 3.8 percentage points to the change in total production. Note that the contribution in column 2 is zero – no crude oil or gas is imported. Thus, for the largest industry in Saudi Arabia, the story is a mixed one. Cuts in domestic subsidies reduce domestic demand. However, some of this lost demand is offset by increased foreign demand, leading to a relatively mild 1.1% contraction in output. Note that exports expand, while local demand falls, because GEMSA gives Saudi oil and gas producers the capacity to shift between the two general sources of demand with fairly minimal cost.
As mentioned above, domestic users of crude oil and gas decreased their demand for crude oil and gas because their production activities contract as a consequence of higher energy prices. We see this confirmed in Table 2, which shows that the electricity and petroleum industries, are among the worst performing industries with their output falling by 25.3 and 16.4% respectively (column 4, lines 2 and 4). With the price of petroleum and electricity increasing for all buyers of these commodities, it is not surprising that nearly all of the decrease in domestic production (column 4) is explained by the fall in domestic demand for petroleum and electricity (column 3).
Other industries affected negatively by the removal of energy subsidies, such as other transport equipment (line 3), basic metals (line 6), other machinery and computers and machinery equipment (line 11), have some common features, namely: (i) they face strong import competition on local markets; and (ii) they sell mainly to investors in the creation of capital.Footnote 12 For example, the data suggest that 93.7% of other transport equipment used in KSA is imported. Table 2 shows that the total production of other transport equipment falls by 17.6% in 2035. The fall in total domestic demand for transport equipment contributes 6.3 percentage points (column 3), while the change in relative prices favouring imported transport equipment contributes a further 10.2 percentage points (column 2). Land and air transport industries are among the worst performing industries because a large share of their production costs is petroleum. With the increase in the price of petroleum, the price of their output increases, thereby reducing their competitiveness. As with other industries, the contraction of the domestic market (column 3) as well as the change in relative price favouring imported transport commodities, contributes to the fall in their domestic output.
The industries that gain most in terms of production include wearing apparel, hotels and restaurants, food and beverages, financial services, and recreational activities. A common feature of these sectors is that they face relatively little trade exposure, and sell primarily to households. As illustrated in Figure 1d, aggregate consumption is above baseline throughout the simulation period and therefore industries producing commodities mainly consumed by household's benefits Wearing apparel (line 22) is projection to experience an increase in domestic production of 6.4% (column 4). The increase in domestic demand for wearing apparel contributes 4.7 percentage points in the rise of domestic output.Footnote 13 However, column 2 shows that due to a relative price change favouring locally produced wearing apparel, output of the domestic wearing apparel industry increases by an additional 1.6 percentage points (over the growth in domestic demand). The first column shows that increased export demand accounts for 0.19 percentage points of the total expansion in wearing apparel production.
7.3 Introducing Incentives (Support) to Industries and Households (Sim 2 and Sim 3)
In Sim 2 and Sim 3, we evaluate the impact of introducing support to industries to ensure that investment decisions planned for 2018 onwards remain unaffected by the removal of subsidies. In Sim 2, monies are partly returned to the directly affected industries while in Sim 3, monies are returned to all manufacturing industries. The remainder is handed to households as a non-distorting lump sum payment.
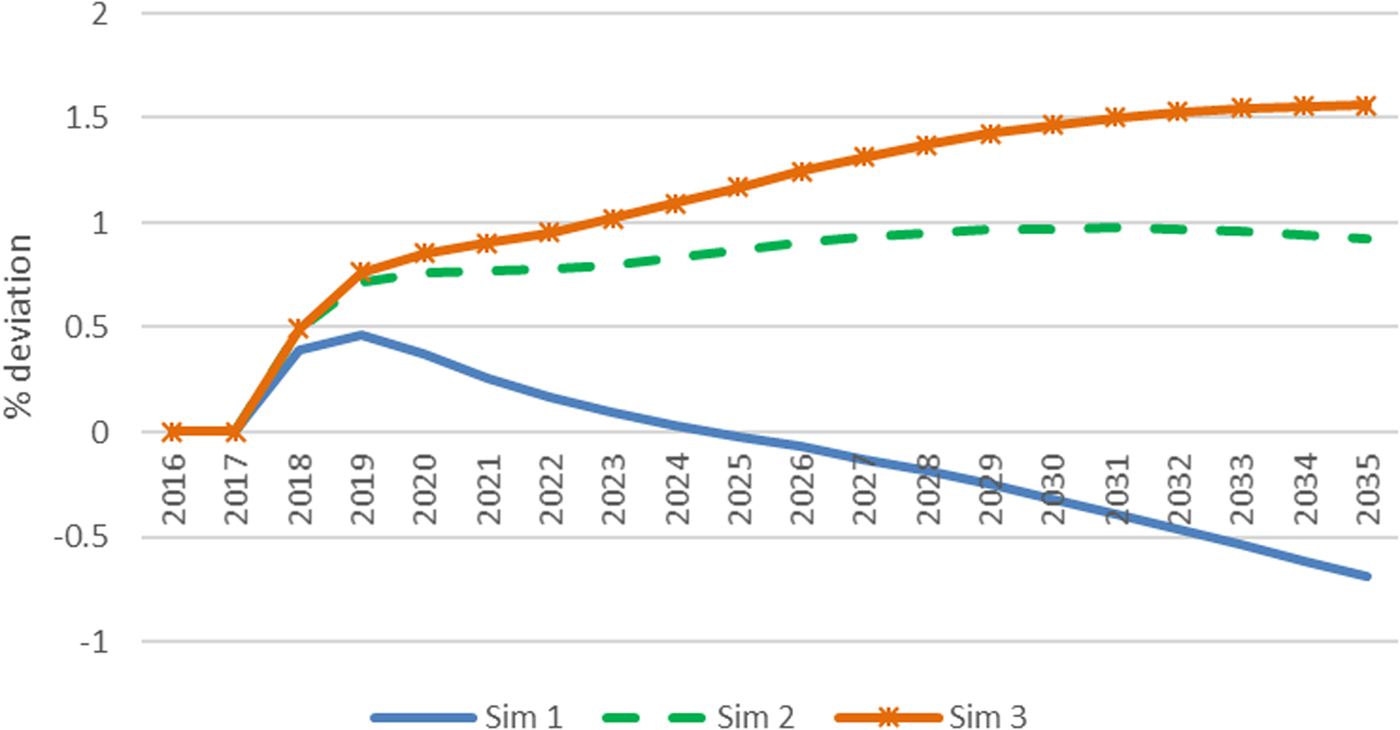
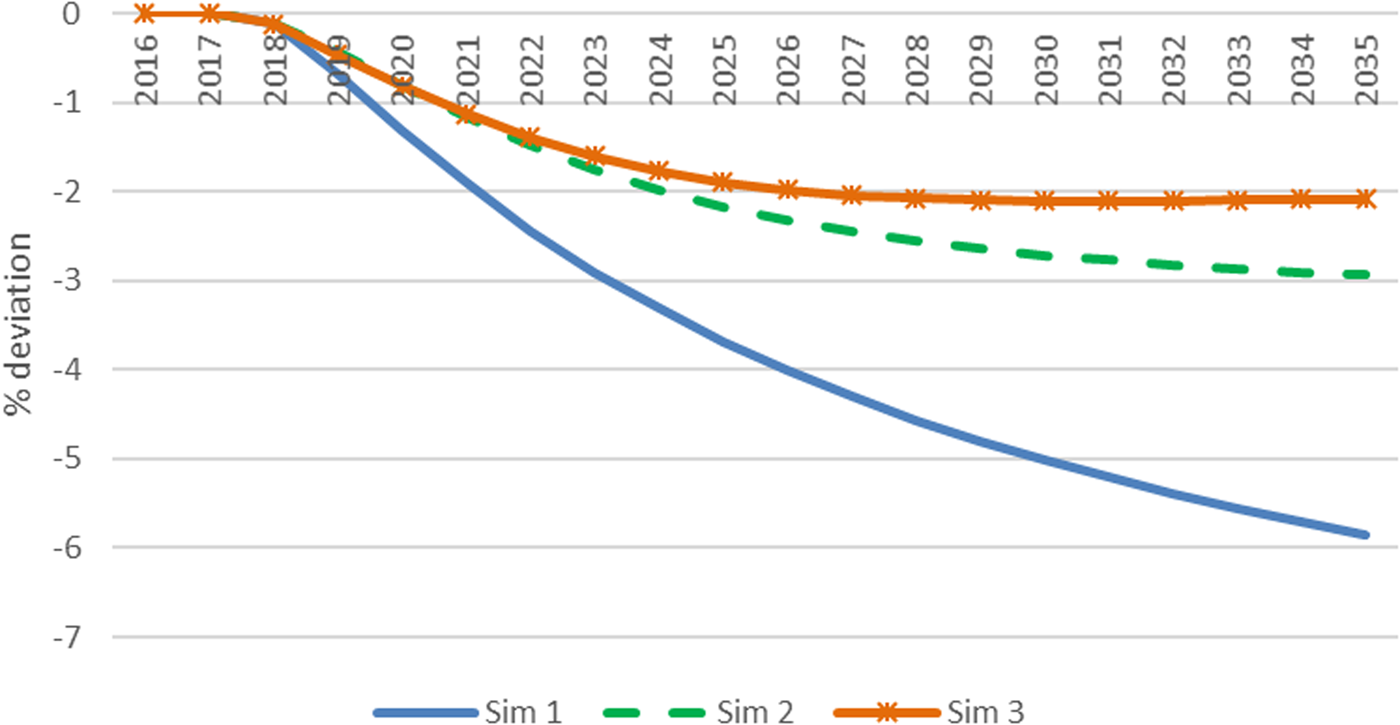
Figure 2 shows the GDP results for the three simulations. The results for Sim 2 and Sim 3 show that GDP improves in the long run when monies are returned to industries. The GDP result for Sim 1 is consistent with Figure 1c. When only the affected industries receive support, GDP is approximately 1% above base, while it is 1.5% above base when all manufacturing industries receive support. The support to industries mute the negative deviation in investment and therefore capital in the long run (Figure 3). Consequently, the negative impact on GDP is muted. Private consumption remains above baseline throughout the simulation period, partly due to the lump sum payment to households.
GDP for all simulations (% deviation from baseline)

Capital for all simulation (% deviation from baseline)

A point of interest is that the magnitude of the improvement in capital and GDP is more for Sim 2 (where only electricity and petroleum is assisted) than for Sim 3 (where all industries receive support). This result suggests that careful consideration should be given to the nature of support and to which industries support is offered, so as not to reduce the efficiency improvement gained from the removal of energy subsidies.
8. Conclusion
For the GCC countries, the lower oil prices impacted negatively on government revenue from oil sales, leading to an increase in budget deficits and a fall in foreign exchange reserves. Apart from long–term structural change, the immediate response to lower oil prices is the removal of energy subsidies. Using a dynamic CGE model (GEMSA) for Saudi Arabia, we estimate the impact of removing subsidies on petroleum and electricity commodities used by producers and households. This model is useful because of its detailed representation of the linkages between different agents in the economy and its treatment of taxes and prices. This model further highlights the degree of trade exposure by capturing the share of commodity-specific exports and imports in the local market.
We run three simulations to evaluate the impact of removing energy subsidies under alternative support programs. In Sim1, no support is given to industries or households. The costs saved by the government in removing subsidies improve the government balance. Removing subsidies effectively improves the efficient use of resource. Thus, while we expect capital and labour to fall, GDP should improve due to the efficiency gain. However, although there is an efficiency gain, with no support given to industries or households, investments and capital collapse throughout the simulation period leading to a fall in real GDP in the long run. Our results show that employment falls in the short-run because of an increase in the cost of labour. The cost of labour increases because removing the energy subsidies causes the price of spending (e.g. CPI) to rise relative to the price of production. Over time, the real wage rate and the cost of labour move towards the baseline, forcing employment back towards its baseline value.
In Sim 2 and Sim 3, we assume that monies are returned to the petroleum and electricity industries (as in Sim 2) or to all industries (as in Sim 3), to ensure that their investment decisions are unaffected from 2018 onwards. This support mutes the fall in capital and investment, and ultimately GDP. Under the different scenarios, GDP is above base at 0.9% (Sim 2) and 1.56% (Sim 3). The results suggest that consideration should be given to (1) what kind of support (incentives) is given to industries and households (e.g. cash payments) and (2) what other policies, apart from energy price reform, are required to improve GDP. Policies improving productivity as well encouraging diversification of, for example, the manufacturing sector, should be encouraged.
Our results show that the main winners are those industries who mainly sell their commodities to the household, such as food and beverages, hotels and restaurants, and real estate services. Nearly all of the output results are explained by an increase in local demand for these commodities. The industries that suffer the largest reductions in output are the petroleum and electricity industries, industries having a high share of energy commodities as an input to production (air and land transport), and industries selling most of their output to investment (machine equipment, fabricated and basic metals, and transport equipment). Although most of the change in industry output is explained by a change in local demand, higher production costs increase the demand for imported commodities thereby further depressing local production.
The results for the alternative simulations show that with monies returned to industries and households, the negative impacts on industry outputs become much smaller. In these simulations, the support to industries ensures that investment decisions planned for 2018 onwards remains unaffected by the removal of subsidies. Therefore, industries such as construction benefit greatly, as a large share of their output is used for investment activities.
The main purpose of subsidy removal in the KSA is to improve the budget deficit. Results from GEMSA highlight that the removal of energy subsidies increases the price of locally produced commodities, making it difficult for import competing industries and export oriented industries to remain competitive. These trade effects in themselves will further impact domestic production and use of commodities. Our results also suggest that although support to industries mitigate the increase in domestic prices and improve competitiveness, industries whose costs include a large share of petroleum and electricity, remain among the most severely affected industries.