Introduction
Tremendous applications of lead iodide (PbI2) in various fields of advanced technology [Reference Saliba, Matsui, Seo, Domanski, Correa-Baena, Nazeeruddin, Zakeeruddin, Tress, Abate and Hagfeldt1, Reference Park, Kedem, Kulbak, Yang, Jeon, Seo, Kim, Kim, Shin and Hodes2, Reference Zhang, Huang, Tan, Li, Zhang, Jia, Lin, Sun, Chen and Li3, Reference Melvin, Stoichkov, Kettle, Mogilyansky, Katz and Visoly-Fisher4, Reference Chen, Ding, Pan, Hayat, Alsaedi, Ding and Dai5] encouraged us to further investigate PbI2. PbI2 has been highly used as a photodetector and a precursor for high-efficiency (i.e., 21%) perovskite solar cell development, and in medical imaging, radiation detection at 300 K, lasers, etc. [Reference Saliba, Matsui, Seo, Domanski, Correa-Baena, Nazeeruddin, Zakeeruddin, Tress, Abate and Hagfeldt1, Reference Park, Kedem, Kulbak, Yang, Jeon, Seo, Kim, Kim, Shin and Hodes2, Reference Melvin, Stoichkov, Kettle, Mogilyansky, Katz and Visoly-Fisher4, Reference Sun, Hu, Shen, Lu, Huang, Zhang, Zhang and Zhu6, Reference Shkir, AlFaify, Yahia, Hamdy, Ganesh and Algarni7, Reference Abbaszadeh and Levin8, Reference Liu, Ha, Zhang, de la Mata, Magen, Arbiol, Sum and Xiong9]. According to the available literature, in the past few decades the research and development on pure and doped PbI2 thin films is quite limited. In previous reports, films of pure PbI2 are fabricated by spray pyrolysis [Reference Condeles and Mulato10, Reference Condeles, Lofrano, Rosolen and Mulato11], solution evaporation [Reference Condeles and Mulato12], electrochemical deposition [Reference Li, Yang, Jiang, Li and Zhao13], pulsed laser deposition [Reference Fan, Ren, Yang, Ren, Xiao, Zi, Yin and Liu14], flash evaporation [Reference Al-Daraghmeh, Saleh, Ahmad, Bulos, Shehadeh and Jafar15], chemical vapor deposition [Reference Wang, Gan, Chen, Yang and Zhai16, Reference Wang, Sun, Zhang, Lu and Shi17], close space deposition [Reference Zhu, Sun, Yang and Zheng18], and thermal evaporation/vacuum sublimation [Reference Ghosh, Bandyopadhyay, Roy, Kar, Lahiri, Maiti and Goswami19, Reference Shkir, Abbas and Khan20, Reference Shah, Bennett, Klugerman, Moy, Entine, Ouimette and Aikens21]. Xiao et al. fabricated the absorbing layer of PbI2 by spin coating for perovskite solar cell applications [Reference Xiao, Huang, Huang, Dkhissi, Zhu, Etheridge, Gray-Weale, Bach, Cheng and Spiccia22]. Recently Wang et al. reported a nanoparticles-induced pinhole-few PbI2 film for solar cells [Reference Wang, Sharma, Chen, Kao, Chen, Chen, Feng and Tai23].
Only reports on doped PbI2 thin films exist in the literature: e.g., preparation of Ag:PbI2 films by melting and determination of hole conductivity [Reference Kuiry, Roy and Bose24]; Bhavsar et al. prepared Al/Cu/Zn:PbI2 films by thermal evaporation and studied their structural and optical properties [Reference Bhavsar and Saraf25, Reference Bhavsar26]. Most of the reports suggest that it is not easy to prepare good quality PbI2 films as they contain pinholes which diminish the performance of the device, and a detailed discussion has been presented by Dmitriev et al. [Reference Dmitriev, Bennett, Cirignano, Klugerman and Shah27]. Recently, there are some reports on nanostructuring of PbI2 with single and double dopants such as Nd, Gd, Cs, Hg, La, Au, Ag:Mn, and Al:Mn [Reference Shkir, AlFaify, Yahia, Hamdy, Ganesh and Algarni7, Reference Shkir, Yahia, Ganesh, Algarni and AlFaify28, Reference Shkir and AlFaify29, Reference AlFaify, Shkir and Ganesh30, Reference Shkir, Ganesh, Yahia and AlFaify31, Reference Yahia and Abutalib32, Reference Yahia, Shkir, Ganesh, Abutalib, Zahran and Alfaify33, Reference Shkir, Yahia, Ganesh, Bitla, Ashraf, Kaushik and AlFaify34, Reference Ismail, Mousa and Amin35]. All reports revealed that the optoelectrical properties of PbI2 in nano/thin films are remarkably modified, leading to their use in several applications. As per documented reports, there is no/least literature available on PbI2 thin film fabrication with Gd doping through facile spin coating. As Gd plays a vital role in modifying the key physical properties of several semiconductors, the authors aim to fabricate thin films of pristine and various concentrations of Gd-doped PbI2. In this study, fabricated films were subjected to X-ray diffraction, FT-Raman spectroscopy, scanning electron microscopy, UV–VIS–NIR spectroscopy studies and their results are discussed.
Results and discussion
X-ray diffraction and FT-Raman analysis
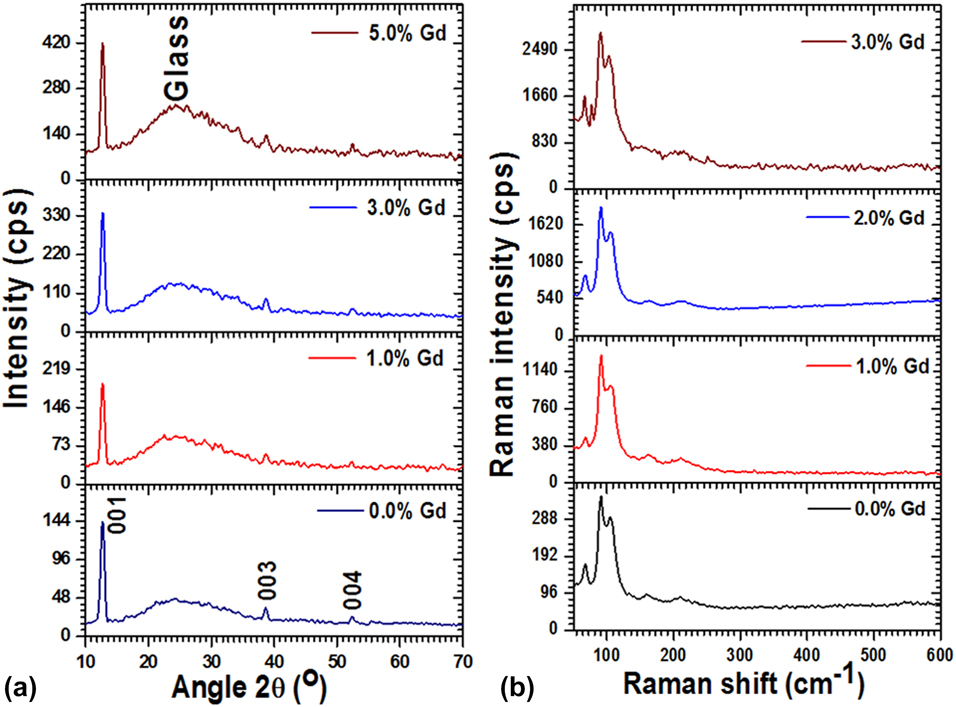
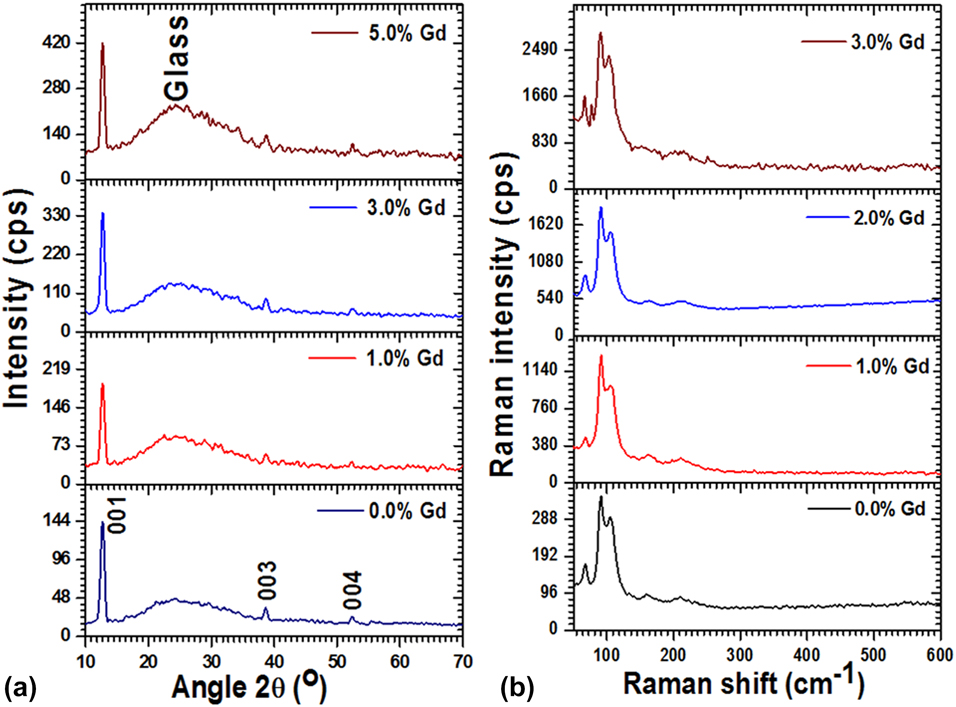
Figures 1(a) and 1(b) show the indexed X-ray diffractometer (XRD) patterns and FT-Raman spectra for all fabricated films. All films possess good crystalline nature as evidenced by high-intensity peaks/bands in both patterns. Both XRD and Raman patterns reveal that the increment in peak/band intensity with increasing Gd content in PbI2 signifies the enhancement of the crystalline nature of the films. After proper cell refinement to attain lattice constants using POWDERX software, the single-phase formation was confirmed, which was reconfirmed by vibrational analysis. The estimated lattice parameters are listed in Table I, which are in good agreement with the standard values reported in JCPDS# 07-0235 and also with other reports on Gd:PbI2 [Reference Shkir, Yahia, Ganesh, Algarni and AlFaify28, Reference Shkir and AlFaify29]. The tabulated data reveal the variation in lattice parameters with Gd doping in the PbI2 matrix and also confirm the 2H-polytypic nature of PbI2 films. Furthermore, the recorded XRD data were used to determine the peak angular position, d values, FWHM, I/I o, etc., which were used to estimate the crystallite size, density of dislocation, strain, and number of crystallites in an unit cell using [Reference Shkir, Yahia, Ganesh, Bitla, Ashraf, Kaushik and AlFaify34, Reference Shkir, Taukeer Khan, Ganesh, Yahia, Ul Haq, Almohammedi, Patil, Maidur and AlFaify36, Reference Shkir, Khan, Khan, El-Toni, Aldalbahi and AlFaify37]  $L = {{0.9\lambda } \over {{\beta _{2\theta }}\cos \;\theta }}$,
 $\delta = {1 \over {{L^2}}}$,
 $\varepsilon = {{{\beta _{2\theta }}\cos \;\theta } \over 4}$, and
 $n = {{\pi {L^3}} \over {6V}}$, respectively, and the results are tabulated in Table I. Also, the value of texture coefficient (TC) was estimated using a known equation [Reference El-Kadry, Ashour and Mahmoud38] and is listed in Table I. It can be noticed from the tabulated data that the value of L increased with the doping content and so the δ and ε are decreased, indicating the reduction of defects in films. The highest value of TC was observed for 3 wt% Gd:PbI2 films, indicating its high crystallinity compared with that of others.
(a) XRD patterns and (b) FT-Raman spectra for all Gd:PbI2 films.
Obtained lattice constants, D, δ, ε, N, and TC for all Gd:PbI2 films.

Vibrational spectra for all films are presented in Fig. 1(b), and all contain about five modes of vibrations. The main vibrational modes of PbI2 are situated at 91 ± 2 cm−1 and ∼68 ± 3 cm−1, which are assigned to the A1g symmetric stretching mode and doubly degenerated Eg mode of shearing activity of two I layers; however, these bands were previously reported at 97 and 74 in bulk [Reference Kasi, Dollahon and Ahmadi39, Reference Wangyang, Sun, Zhu, Yang and Gao40]. The other three modes of vibrations are positioned at 106 ± 2, 163 ± 3, and 211 ± 4 cm−1, which are in good agreement with previous reports [Reference Liu, Ha, Zhang, de la Mata, Magen, Arbiol, Sum and Xiong9, Reference Kasi, Dollahon and Ahmadi39, Reference Sears, Klein and Morrison41]. All observed modes of vibrations show the shift in their position compared with the bulk, indicating relaxed binding and small-scale nanostructure formation.
SEM mapping and morphological analyses
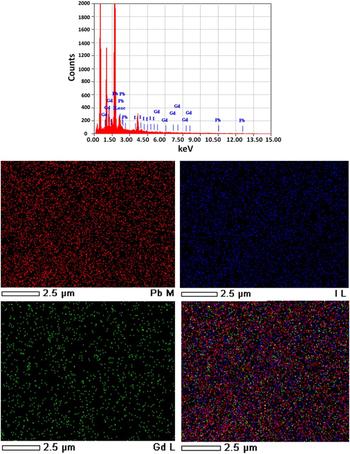
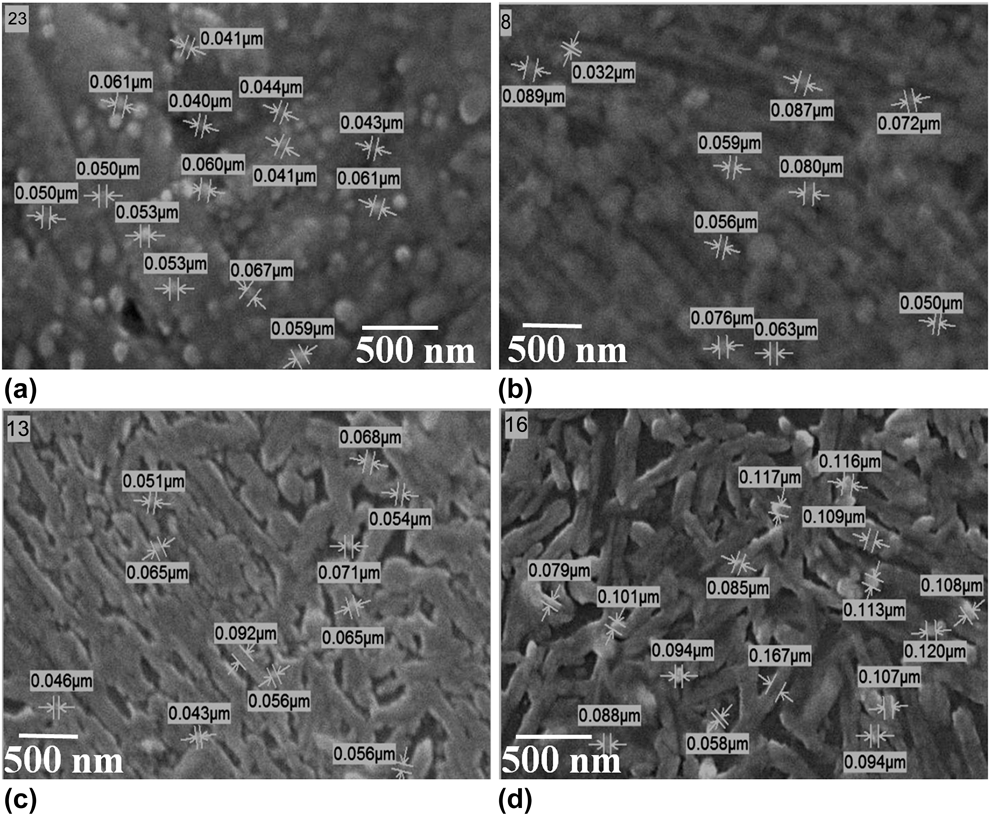
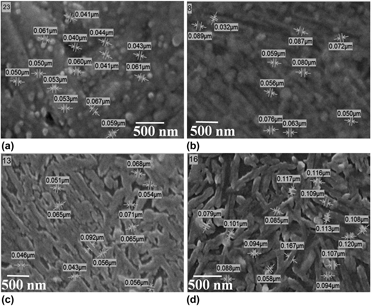
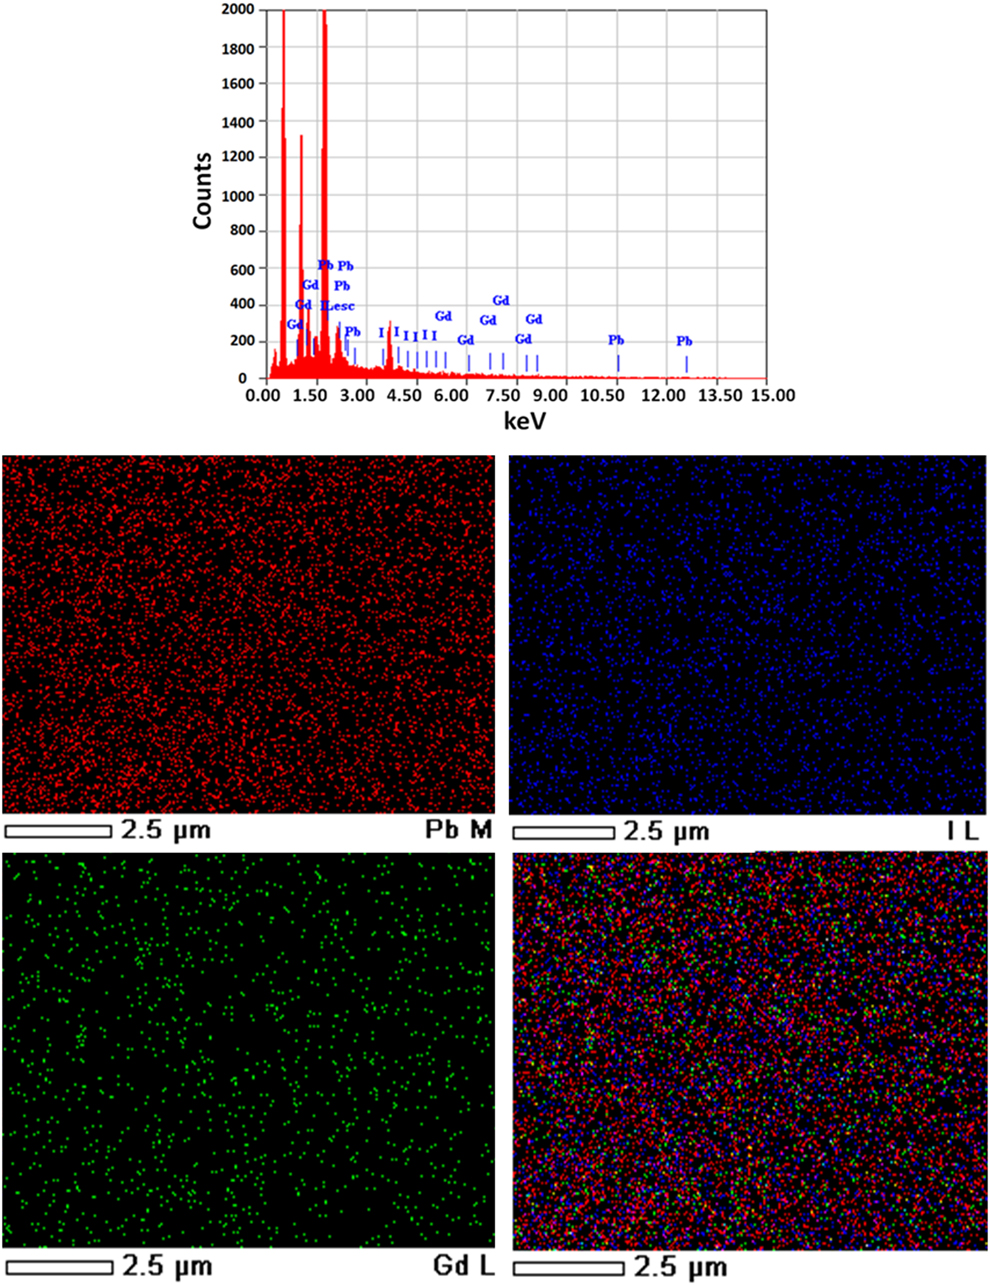
SEM elemental mapping along with the EDX spectrum (3 wt% Gd:PbI2) is displayed in Fig. 2. EDX revealed that all components such as Pb, I, and Gd are present in the grown films. Moreover, SEM elemental mapping provides clear evidence about the homogeneous distribution of the Gd dopant all over the PbI2 matrix. SEM micrographs were captured to investigate the surface morphology of films and also to measure the grain size, as depicted in Figs. 3(a)–3(d). The size of the grains is manually mentioned on the images using SMILE View software. It can be seen that the pure PbI2 film [Fig. 3(a)] contains spherical nanoparticle-like morphology and the average grain size is ∼51.6 nm. When 1.0 wt% Gd was doped in PbI2, the morphology was drastically modified, converting to rods from nanoparticles; however, the films contained nanoparticles in regular order, forming rods, and the average grain size slightly increased to ∼66.4 nm. Moreover, when the concentration of Gd was increased to 2 and 3 wt%, the nanorods became more dominating; however, all were made of low-dimension nanoparticles, and the grain size was measured to be ∼60.62 and 103.7 nm for 2 and 3 wt% Gd:PbI2 films, respectively. This shows that the Gd strongly influences the morphology of PbI2 films. It can be noticed that the grain size is slightly higher than the crystallite size obtained by Scherrer’s rule; the reason for such difference might be the formation of nanoclusters. Also, a single grain may contain a number of domains of diverse orientations, which ultimately contributes to the larger size obtained by SEM compared with XRD.
EDX/SEM mapping image for 2 wt% Gd:PbI2 films.
SEM micrographs: (a) 0.0 wt%, (b) 1.0 wt%, (c) 2 wt%, and (d) 3 wt% Gd:PbI2 films.

Optical studies
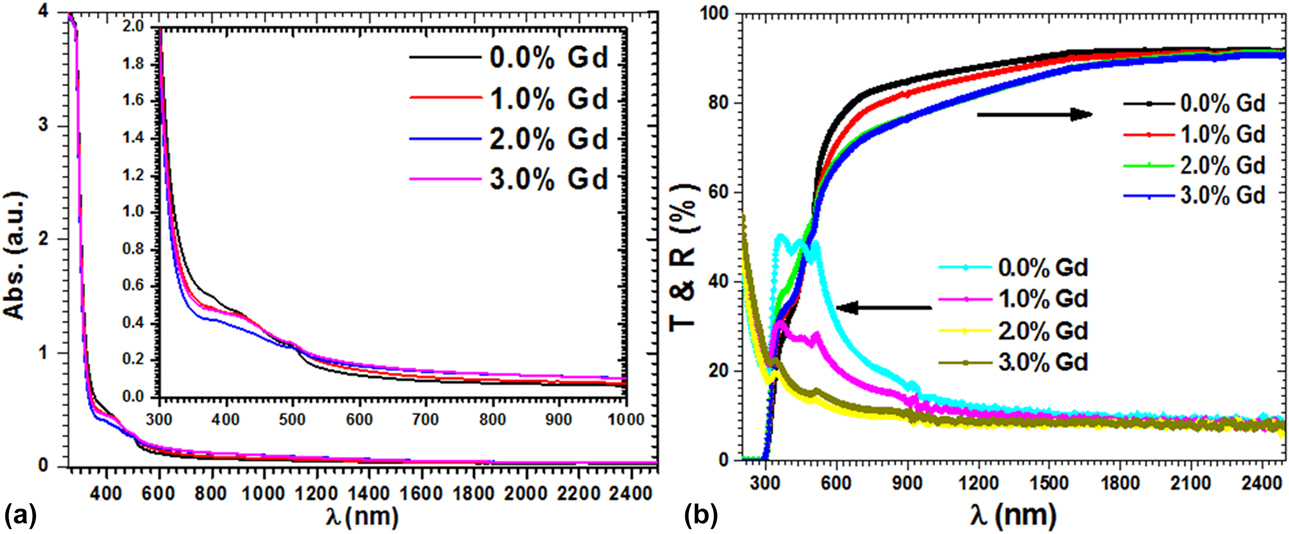
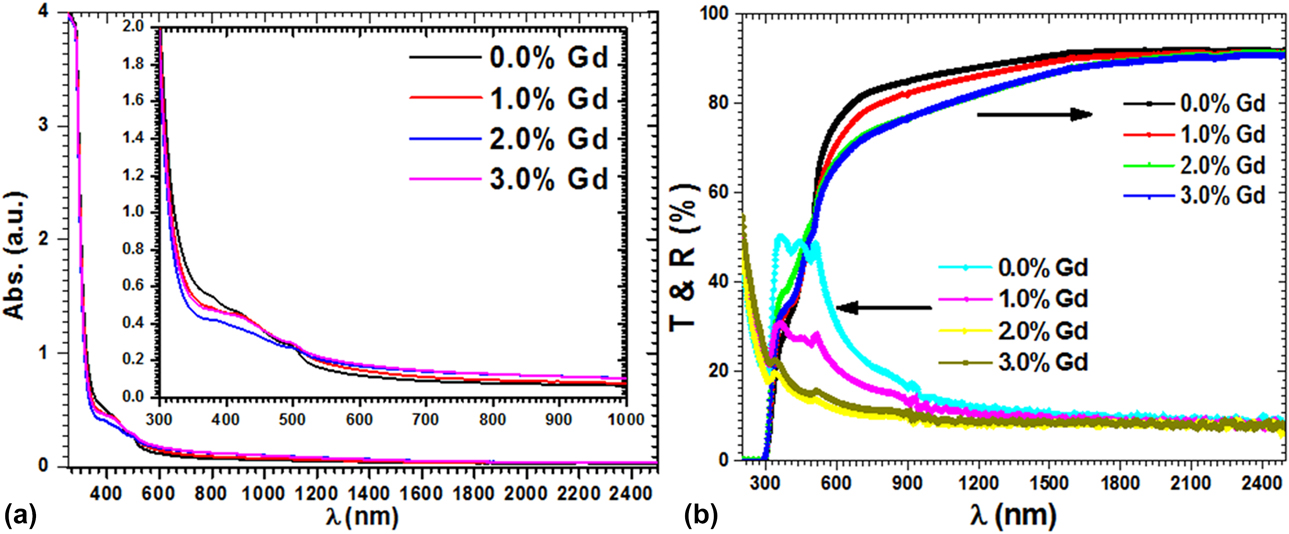
Measured absorbance, transmittance, and reflectance spectra are displayed in Figs. 4(a) and 4(b). It can be noticed from the absorption spectra that the grown films have very low absorbance in the 500- to 2500-nm region. There seems to be two absorption edges; however, the main absorption edge shows a shift toward higher wavelength with increasing Gd content. The transmission spectra for all films revealed that the films are of high transparency in the Visible-NIR range, viz., in the range of 72 to 92. High optical transparency makes the grown films highly applicable as window layers for multilayer solar cell devices. The transparency of films is showing a decrease with Gd doping content, however still high. The reflectance from grown films is shown in Fig. 4(b), which shows low value in the higher wavelength region.
(a) Absorptions and (b) T and R spectra of all Gd:PbI2 films.
Energy gap, absorption index, and refractive index studies
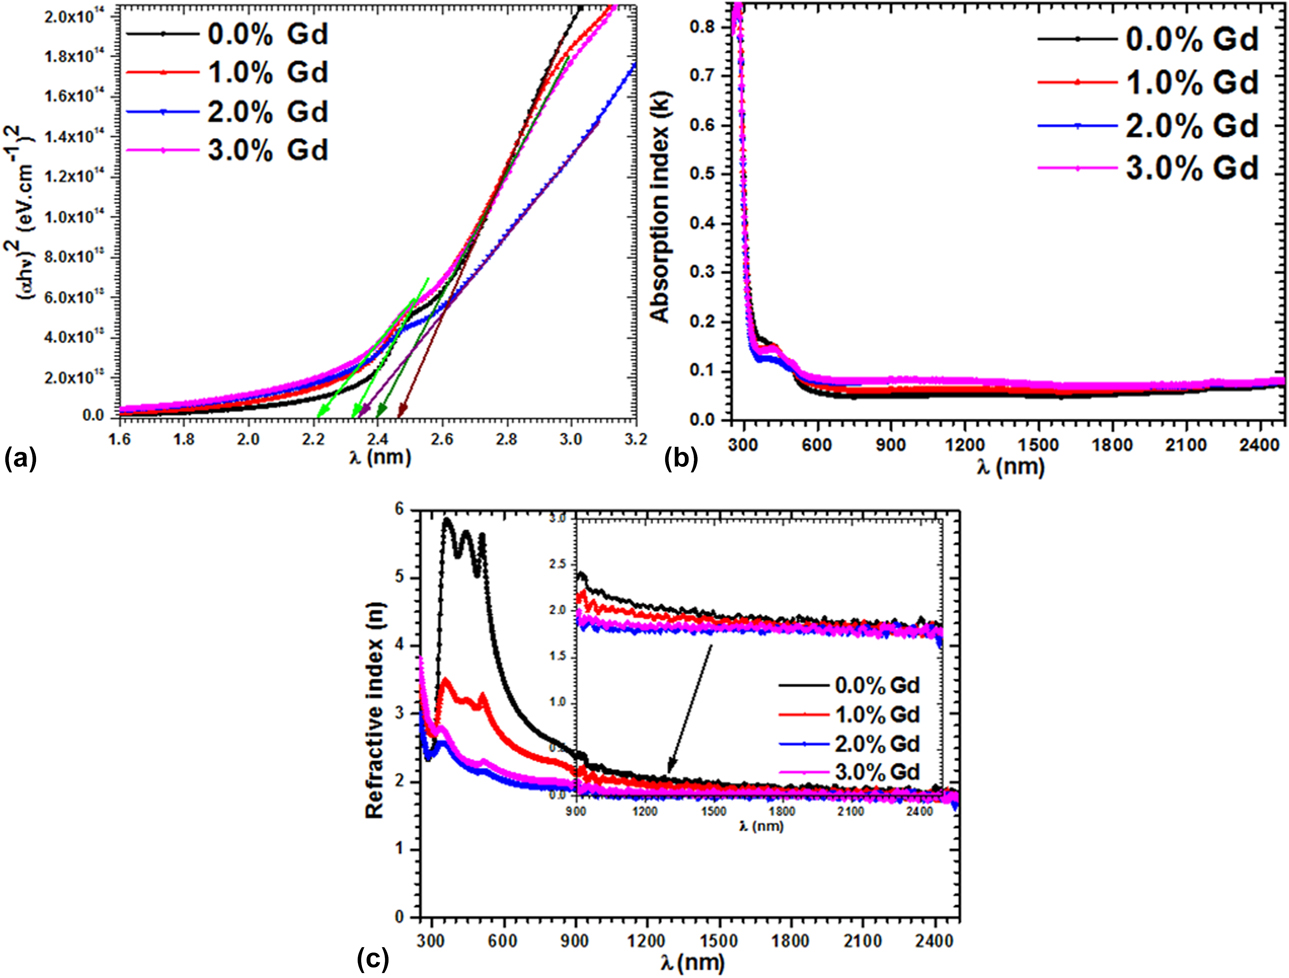
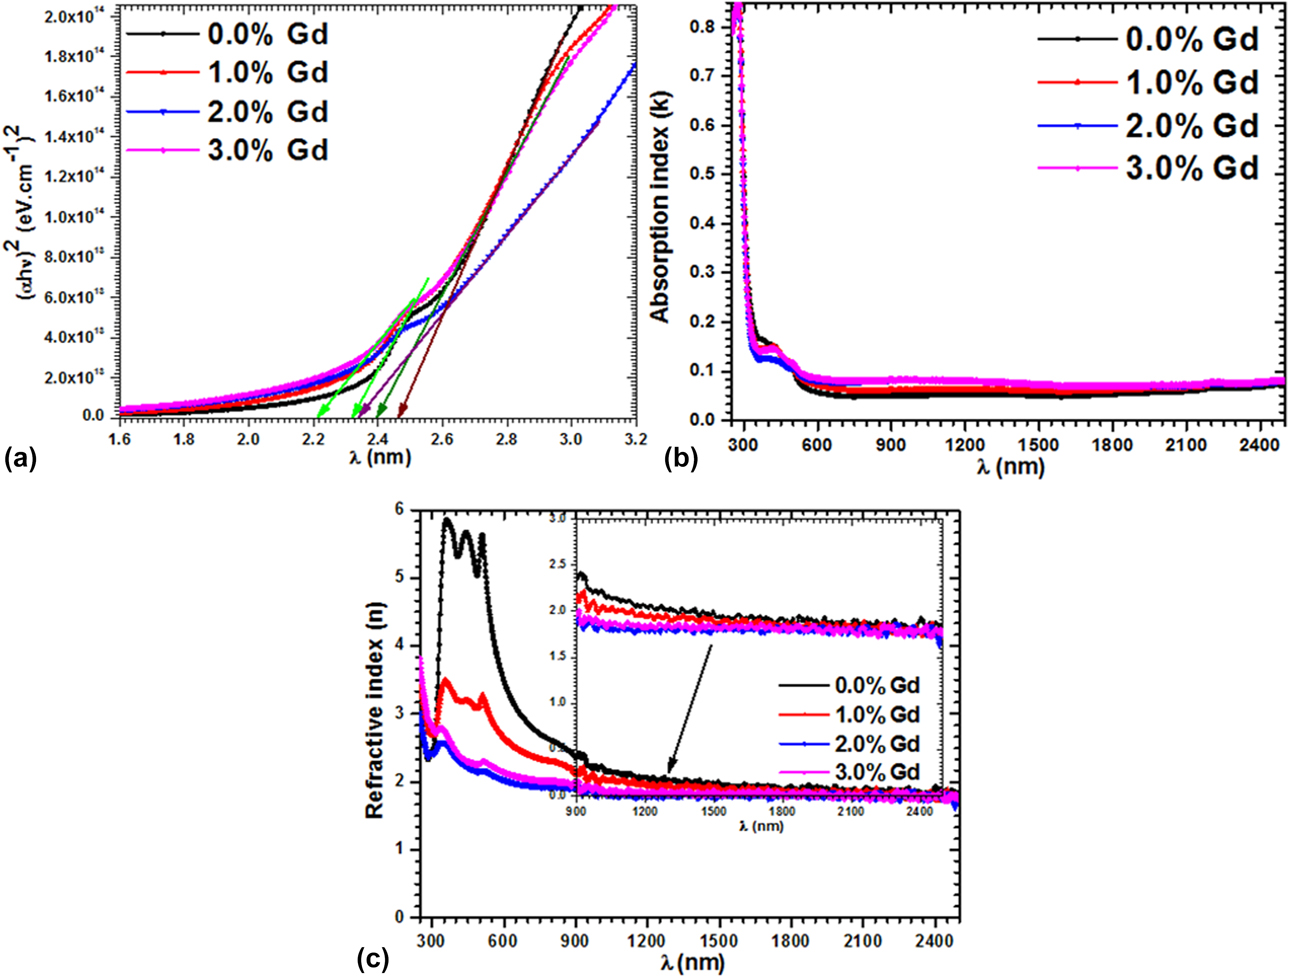
The calculated energy gap (E g), absorption index (k), and refractive index (n) plots are presented in Figs. 5(a)–5(c). E g, k, and n values were estimated using the following rules [Reference Shakir, Kushwaha, Maurya, Bhagavannarayana and Wahab42, Reference Shkir, Aarya, Singh, Arora, Bhagavannarayana and Senguttuvan43, Reference Mohd, Ashraf and AlFaify44, Reference AlFaify and Shkir45, Reference Alfaify and Shkir46]: (αhν)1/m = A(hν − E g), where α, A, h, and m are the coefficient/constant of absorption, energy, Plank, and optical transition progression, viz., = 1/2 for direct transitions. Initially, α was estimated by 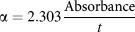 $\alpha = 2.303{{{\rm{Absorbance}}} \over t}$, where t is the thickness of films. Figure 5(a) shows Tauc’s graphs of (αhν)2 versus hν and a line of extrapolation has been marked toward the hν axis, where (αhν)2 = 0. E g values were noted from the plots in the 2.34–2.46 eV range for all films. Moreover, there is another E g in all films in the range of 2.21–2.32 eV [see inset of Fig. 5(a)]. The E g values of grown films are reduced by Gd doping. Similar type of trend was observed for synthesized Gd:PbI2 nanostructures [Reference Shkir, Yahia, Ganesh, Algarni and AlFaify28, Reference Shkir, AlFaify, Yahia, Ganesh and Shoukry47]. However, these values are in good accord and higher than those in previous reports on thin films and crystals [Reference Ghosh, Bandyopadhyay, Roy, Kar, Lahiri, Maiti and Goswami19, Reference Zhu, Wei, Jin and Xiang48, Reference Shkir, Khan, El-Toni, Aldalbahi, Yahia and AlFaify49, Reference Khan, Shkir, Almohammedi and AlFaify50]. Such observations can be explained by the Burnstein–Moss effect [Reference Shkir, Taukeer Khan, Ganesh, Yahia, Ul Haq, Almohammedi, Patil, Maidur and AlFaify36, Reference Ilanchezhiyan, Mohan Kumar, Vinu, Al-Deyab and Jayavel51]. The value of k and n was estimated by the following equation [Reference Arif, Shkir, AlFaify, Sanger, Vilarinho and Singh52, Reference Shkir, Ganesh, AlFaify and Yahia53]:
 $k = {{\alpha \lambda } \over {4\pi }}$ &
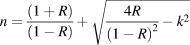 $n = {{(1 + R)} \over {(1 - R)}} + \sqrt {{{4R} \over {{{\left( {1 - R} \right)}^2}}} - {k^2}}$, and graphed in Figs. 5(b) and 5(c) with respect to λ. It can be noticed from Fig. 5(b) that there is a sharp decrease in k values in the UV region, which then become stable in the 600- to 2500-nm wavelength region. However, these values are noted to be reduced by Gd doping content. The n values are observed to be high below the 600-nm wavelength [see Fig. 5(c)], which however also become constant in the higher wavelength range; the value is noted to be in the range of 1.8–6. This kind of trend has also been reported previously on PbI2 [Reference Buckman, Hong and Wilson54].
(a) Tauc’s plot, (b) k versus λ, and (c) n versus λ for all Gd:PbI2 films.
Dielectric constant, loss, tan δ, and optical conductivity analysis
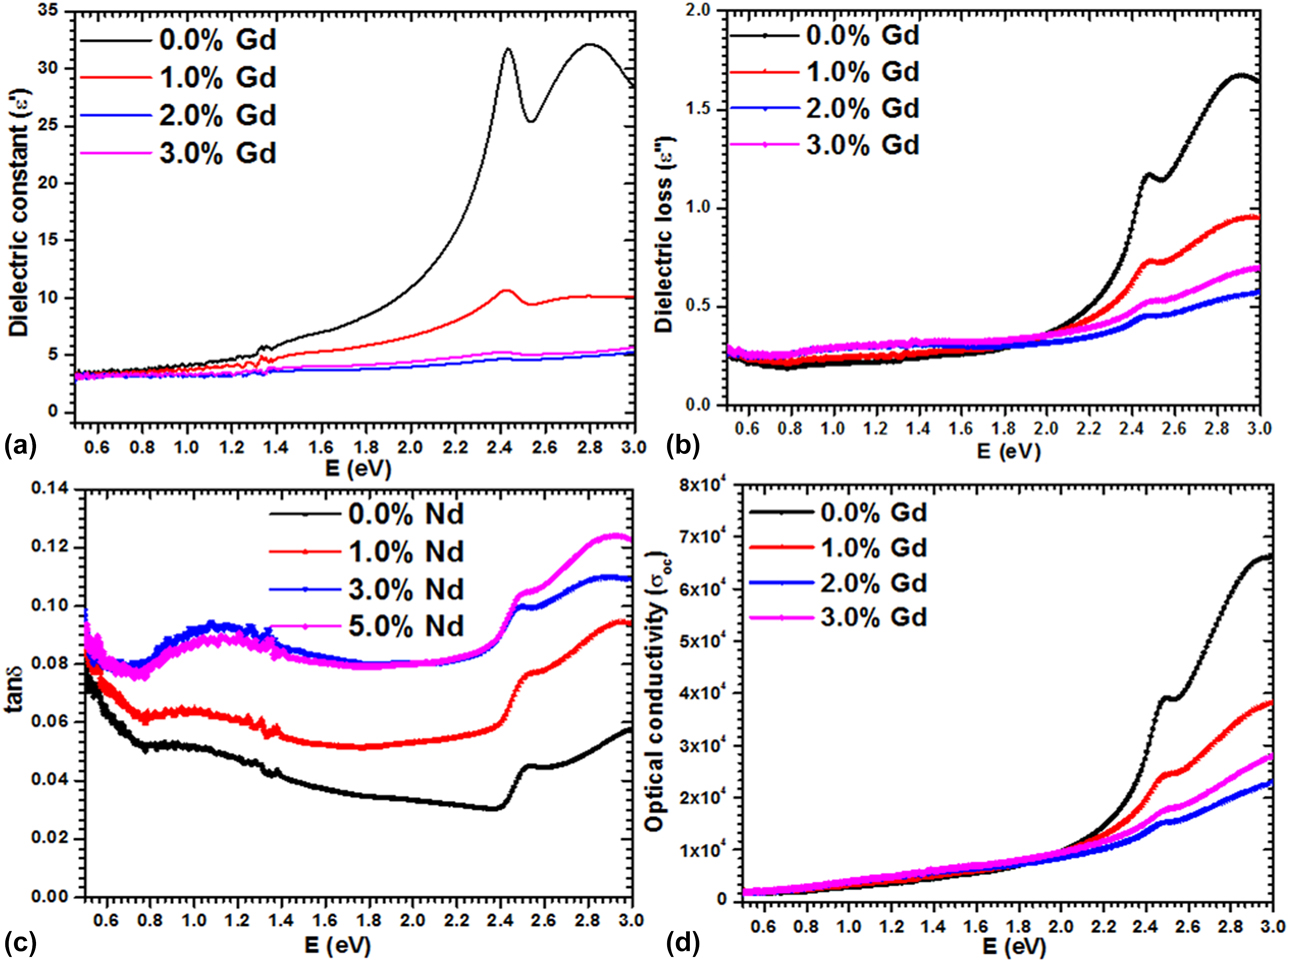
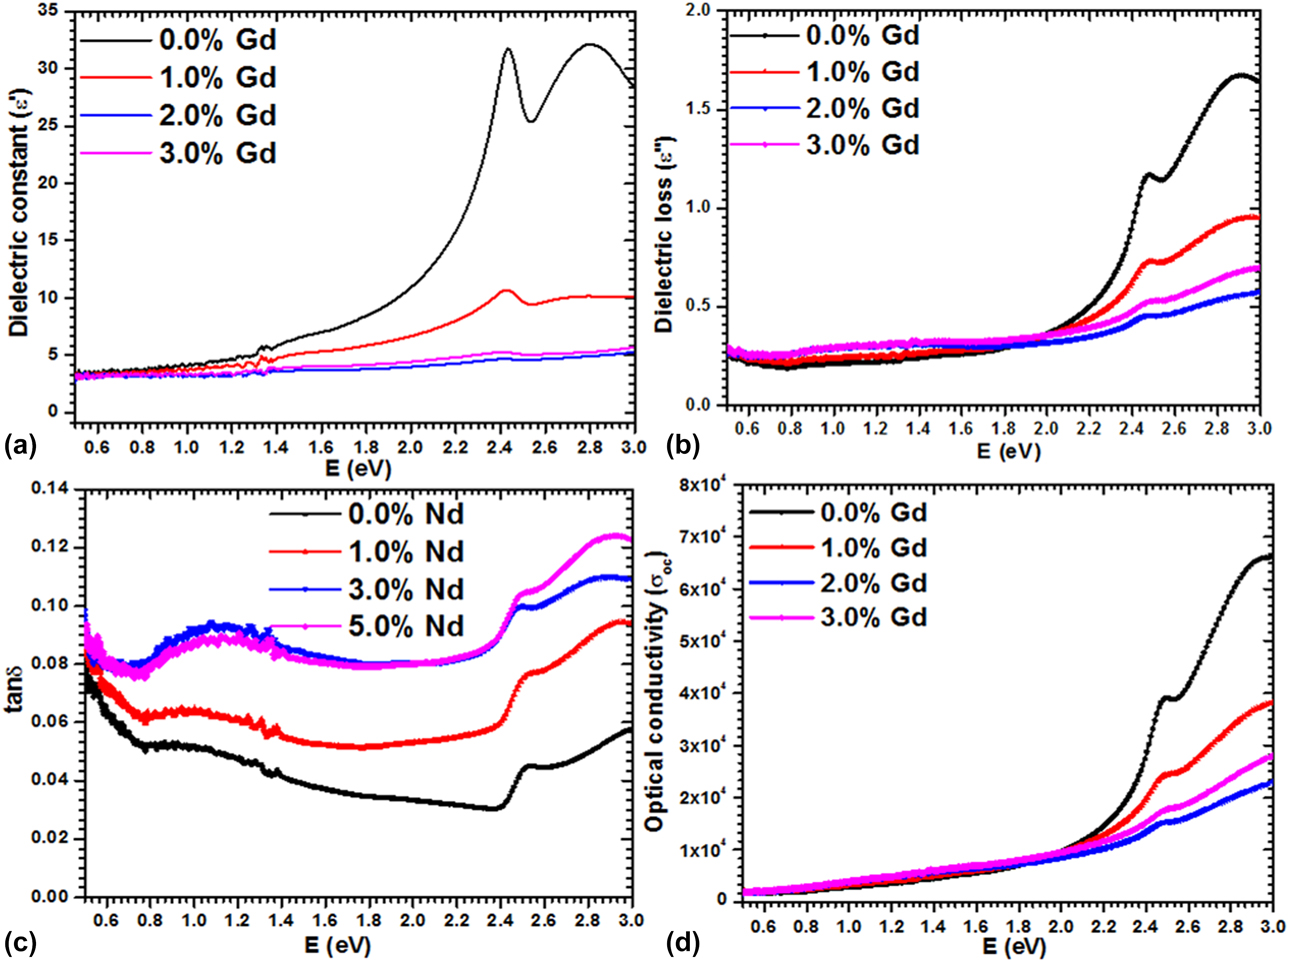
Thin films are found to have tremendous applications such as in capacitive storage, CMOS, ICs, and DRAM [Reference Panda and Tseng55, Reference Ren, Trolier-McKinstry, Randall and Shrout56, Reference Moazzami, Hu and Shepherd57, Reference Chaneliere, Autran, Devine and Balland58, Reference Mohd, Khan, Hamdy, Algarni and AlFaify59]. Films can be easily tailored according to requirement and also undergo low-temperature crystallization compared with bulk, and hence can be facilely assimilated in microelectronics. Hence, we investigate the dielectric behavior of all grown films as follows: the dielectric constant real and imaginary parts (ε′ & ε″) were calculated by ε = ε′ + iε″ [Reference Usha, Sivakumar and Sanjeeviraja60]. The ε′ and ε″ are related to n and k as [Reference Kim, Yim, Son and Leem61] ε′ = n 2 − k 2 and ε′ = 2nk, respectively. Figures 6(a) and 6(b) depict the variation of ε′ and ε″ versus E (eV). The value of ε′ was noted to be in the range of ∼3.52–31.74, and pure PbI2 has the highest value compared with the doped one; as with Gd doping content, its value was decreased and this may be due to the quality of films, grain size, roughness, disorderness, etc. The ε″ and tan δ showed a similar trend to ε′ and were in the range of 0.22–1.6 and 0.03–0.13, respectively, as displayed in Figs. 6(b) and 6(c). The lowest value of tan δ and ε″ was observed for 2 wt% Gd:PbI2 films. Such low values of these parameters signify that the films contain lesser defects. Optical conductivity was also determined through the well-known rule  ${\sigma _{{\rm{opt}}}} = {{\alpha nc} \over {4\pi }}$ and plotted in Fig. 6(d). Figure 6(d) displays large values (in the order of 104) for all films, which increased with increasing the energy; such behavior of films indicates their superior photo response.
Plots of (a) ε′ versus E (eV), (b) ε″ versus E (eV), (c) tan δ versus E (eV), and (d) σoc versus E (eV) for all Gd:PbI2 films.
Linear, third-order nonlinear susceptibilities and nonlinear refractive index analyses
In a nonlinear system, the change in output values is not proportional to the change in input values according to mathematical science. Such system-based problems are highly applicable to physicists, engineers, biologists, mathematicians, etc. [Reference Strogatz62, Reference Sutter63]. In the recent past, a lot of research and development of new advanced materials is on progress [Reference Luo, Liang, Song, Zhao, Xu, Ye and Lin64, Reference Peng, Tang, Lin, Zhao, Luo, Yan, Chen and Ye65, Reference Zhang, Han, Wang, Chen, Yang and Pan66, Reference Karuppanan and Kalainathan67, Reference Alam, Schulz, Upham, De Leon and Boyd68, Reference Sandeep, Bhat and Dharmaprakash69]. Additionally, improvement in such properties with the addition of dopants/additives is also happening at a faster pace [Reference Sandeep, Bhat and Dharmaprakash69, Reference Bannur, Antony, Maddani, Poornesh, Rao and Choudhari70, Reference Shkir, Ganesh, AlFaify, Yahia and Zahran71, Reference Talwatkar, Sunatkari, Tamgadge and Muley72, Reference Shkir, Arif, Ganesh, Manthrammel, Singh, Maidur, Patil, Yahia, Algarni and AlFaify73]. Hence, herein we have studied the nonlinear optics of lead iodide doped with different concentrations of Gd through a simple route, with only optical measurements.
According to nonlinear optics, the nonlinear polarization (P) can be described as follows [Reference Kim, Yim, Son and Leem61, Reference Frumar, Jedelský, Frumarova, Wagner and Hrdlička74]:  $P = {\varepsilon _0}\left[ {{\chi ^{\left( 1 \right)}}{E^1} + {\chi ^{\left( 2 \right)}}{E^2} + {\chi ^{\left( 3 \right)}}{E^3} + \ldots } \right]$, here symbols such as χ(1), χ(2), and χ(3)… are termed as linear and nonlinear additives to susceptibility. χ(1) is defined as
 ${{\left( {n_0^2 - 1} \right)} \over {4\pi }}$ [Reference Adair, Chase and Payne75, Reference Ticha and Tichy76] and χ(3) values are evaluated by [Reference Fournier and Snitzer77, Reference Wang78, Reference Wynne79, Reference Nasu and Mackenzie80]
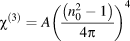 ${\chi ^{\left( 3 \right)}} = A{\left( {{{\left( {n_0^2 - 1} \right)} \over {4\pi }}} \right)^4}$ (constant A = 1.7 × 10⁻¹⁰ esu for χ(3)). The nonlinear refractive index (n (2)) is related to the linear index (n (0)) and expressed as n = n (0) + n (2)E 2; it is fully dependent on light intensity and χ(3) and, therefore, is written as
 ${n_2} = {{12\pi } \over {{n_0}}}{\chi ^{\left( 3 \right)}}$ [Reference Ticha and Tichy76, Reference Sharma and Katyal81].
Figures S1(a) and S1(b) (see Supplementary material) expose the evaluated values of χ(1) and χ(3) versus E (eV) (up to 3 eV). The χ(1) value for pure PbI2 is noticed in the range of 0.25–2.5; however, for 1, 2, and 3 wt% Gd-doped PbI2, these values are in the range of 0.15–0.9. This clearly shows that the values of χ(1) are slightly reduced by Gd doping; however, it is analogous to previous reports on different films [Reference Shkir, Ganesh, AlFaify, Yahia and Zahran71, Reference Ganesh, Yahia, AlFaify and Shkir82, Reference Shaaban, El-Hagary, Hassan, Ismail, Emam-Ismail and Ali83]. Furthermore, the values of χ(3) are noticed to be in the range of 4 × 10⁻¹³ to 6.5 × 10⁻⁹ in 0.5–3 eV energy range for pure PbI2; however, for doped PbI2, the value is found to be in the range of 8 × 10⁻¹⁴ to 6 × 10⁻¹¹ over a similar energy range. These results clearly signify that the value of χ(3) is reduced by Gd doping in PbI2; however, it is higher and comparable with previous values for several film systems [Reference Shkir, Ganesh, AlFaify, Yahia and Zahran71, Reference Ganesh, Yahia, AlFaify and Shkir82, Reference Shaaban, El-Hagary, Hassan, Ismail, Emam-Ismail and Ali83]. The possible reason for such diminution is variation in polarizing effect in fabricated films, and this effect may be due to the change in crystallite size of grown films with Gd concentration. Figure S1(c) (see Supplementary material) presents the energy versus n (2) values; from this figure, it can be perceived that n (2) has similar tendency to χ(3) and its values are detected in the range of 5 × 10⁻¹² to 4.28 ×10⁻⁸. The observed values for n (2) are analogous to other reports [Reference Shkir, Ganesh, AlFaify, Yahia and Zahran71, Reference Ganesh, Yahia, AlFaify and Shkir82]. The reduction in all nonlinear parameters might be due to the increase in crystallite size with Gd concentration.
Conclusion
Facile and cost-effective methods have been presented to achieve high-quality films of Gd:PbI2. The c-axis orientation of grown films was confirmed by X-ray diffraction analysis along with single-phase and good crystallinity. The single phase was further confirmed by FT-Raman spectroscopy analysis, and also main vibrational bands of PbI2 due to symmetric stretching (A1g) and dual degenerated (Eg) for shearing motion of iodine layers are noticed at ∼91 ± 2 cm−1 and 68 ± 3 cm−1, respectively. The D values are noted to be enhanced from 16 to 32 nm with the increase in Gd concentration in PbI2, indicating crystallinity improvement. Furthermore, the size of grains was measured in the 50- to 103-nm range by SEM. Gd doping was confirmed by EDX, and further homogeneous distribution of Gd was approved through SEM mapping. The grown films have ∼72–92% transparency, which is excellent for colored materials, recommending their application in optoelectronics. The shift in absorption edge was noticed, which signifies the shift in energy gap of films with Gd doping and was found to be in the range of 2.31–2.05 eV. Such tailored band gap for PbI2 makes it suitable for solar cell applications. The n values are noticed in the 1.85–2.3 range. The values of ε′ are found to be in the range of 2.5–35, and σOC is also reduced by Gd doping; however, both are found to increase with frequency. The χ(1), χ(3), and n (2) values are noted to be in the range of 0.15 to 2.5, 8 × 10⁻¹⁴ to 6.5 × 10⁻⁹, and 5 × 10⁻¹² to 4 × 10⁻⁸, respectively. After careful discussion and conclusion, we found that the Gd:PbI2 films may be applicable in optoelectronics and solar cell applications.
Experimental details
Materials, thin films, and device fabrication and characterizations
First, the synthesis of PbI2 with 0.0, 1.0, 2.0, and 3.0 wt% Gd nanostructures was achieved according to the previous procedure [Reference Shkir, Yahia, Ganesh, Algarni and AlFaify28] using Pb(C2H3O2)2, NaI, PVA, CTAB, and Gd(NO3)3 as the Gd source. For fabricating thin films of constant thickness, an equal amount (0.5 g) of prepared nanostructures was weighed and dissolved in a constant volume of DMF (5 mL) and stirred for more than 1 h at 50 °C to achieve homogeneously transparent yellow-colored solutions. From each solution, a constant amount was taken with a dropper during the fabrication of films on glass substrates using spin coating to avoid thickness variations, allowing us to study only the effect of Gd on the key characteristics of PbI2. Subsequent heating was applied to all films in an open environment on a hot plate at 90 °C to evaporate the solvent. Structural, vibrational, morphological, optical, and electrical properties of all fabricated films were studied using a Shimadzu X-600 Japan X-ray diffractometer (XRD), Shimadzu, Kyoto, Japan; DXR FT-Raman spectrometer from, Thermo Fisher Scientific, Waltham, Massachusetts (λexc = 532 nm, 2 mW power); JSM 6360 LA, Japan SEM; Jasco V-570 UV–VIS–NIR spectrophotometer, Solon, Ohio; and Keithley 4200-SCS-I-V system.
Supplementary material
To view supplementary material for this article, please visit https://doi.org/10.1557/jmr.2019.121.
Acknowledgments
The authors extend their appreciation to the Deanship of Scientific Research at King Khalid University for funding this work through general research project under Grant No. G.R.P- 132/40.