The field of SLAFootnote 1 has made significant progress, both substantive and methodological, since its inception in the second half of the 20th century (e.g., Lightbown, Reference Lightbown2000; Ortega, Reference Ortega2009; Pica, Reference Pica1997). During this time, theoretical and empirical advances have been summarized and discussed regularly in the scholarly literature. In contrast, relatively little attention has been paid to the state or development of the field’s quantitative research methods, an unfortunate circumstance given the empirical rigor needed to reliably and accurately inform second language (L2) theory and practice.Footnote 2
Although largely absent from the metadiscourse in SLA, some L2 researchers have hinted at the need for greater reflection on methodological rigor in L2 research in the context of broader conversations that encompass issues such as social utility and research ethics (e.g., Kubanyiova, Reference Kubanyiova2008; Ortega, Reference Ortega2005). More pointed calls for reform of quantitative L2 methods and reporting practices in particular have surfaced in meta-analyses and other types of reviews. These studies have found widespread evidence for, among other trends, (a) a lack of pretesting in quasi-experimental studies (e.g., Norris & Ortega, Reference Norris and Ortega2000); (b) low or unreported estimates of instrument reliability (e.g., Chaudron, Reference Chaudron2001); and (c) missing data, including basic descriptive statistics needed to calculate an effect size (i.e., d value; Plonsky, Reference Plonsky2011a; Wa-Mbaleka, Reference Wa-Mbaleka2006). Complementary to these findings, surveys of L2 researchers have found a lack of perceived importance of methodological rigor in different subdomains of the field such as computer-assisted language learning (CALL; Egbert, Reference Egbert2007; Smith & Lafford, Reference Smith and Lafford2009).
Beyond any methodological, statistical, and psychometric motivations for adhering to rigorous research and reporting practices, Gass, Fleck, Leder, and Svetics (Reference Gass, Fleck, Leder and Svetics1998) suggest that “respect for the field of SLA can come only through sound scientific progress” (p. 407; see also Henning, Reference Henning1986). In other words, methodological infirmity not only hinders progress in the development of theory but may also negatively affect the reputation and legitimacy of SLA as a discipline and limit its potential to contribute to parent fields such as linguistics, education, and psychology from which SLA was conceived and has long since borrowed research traditions (Gass, Reference Gass1993; Norris & Ortega, Reference Norris, Ortega, Gass and Mackey2012).
There is no controversy over the necessity of rigorous quantitative methods to advance the field of SLA. Like any social science, progress in this field depends on sound research designs, principled data analyses, and transparent reporting practices. However, as previously mentioned, very little scholarly activity in the field has sought to describe the “how” of SLA, and much less has addressed explicitly the quality of its empirical efforts.Footnote 3 In other words, whether or not and to what extent studies in SLA have been carried out in adherence to standards of quality is an empirical question. The study reported here represents a step toward answering that question by systematically describing and assessing quantitative research and reporting practices in SLA. My motivation for carrying out this study is simple: By looking to the past of SLA, I hope to contribute to its future. To do so, I examine study quality in L2 research; study quality is defined for the purposes of this study as the combination of (a) adherence to standards of contextually appropriate, methodological rigor in research practices and (b) transparent and complete reporting of such practices.
The literature review that follows is divided into two main sections. The first is an introduction to the measurement of study quality, an area central to the present study and to synthetic research more generally but obscure to many SLA researchers. I then describe SLA research and reporting practices and concerns about study quality from three unique but often coinciding perspectives. I first examine methodological findings from meta-analyses and other reviews of L2 research. These articles are generally more concerned with the substantive issues of the subdomains they review, focusing only peripherally on methods, but their findings and comments related to quantitative research practices are nonetheless useful and informative to this discussion. I then present a complementary perspective found in surveys and guidelines of L2 journals. The literature review ends with a summary of Plonsky and Gass (Reference Plonsky and Gass2011), the first large-scale empirical investigation of methodological quality in SLA.
BACKGROUND
Assessing Study Quality
Study quality, an interdisciplinary domain in its own right but most often discussed in the context of meta-analysis, is the source for much of the orientation and conceptual impetus for this study. To date, as many as 300 measures have been proposed to assess the quality of quantitative empirical research (K. Wells & Littell, Reference Wells and Littell2009). These measures are often used by meta-analysts to weight effect sizes from primary studies on the basis of the quality or the appropriateness of their designs, analyses, and reporting practices. The rationale for this technique is that studies of higher quality should contribute more to the meta-analytic mean.
Although it is not my intention to assign a weighted value to the research reports investigated in this study, the criteria included in previous instruments of this type (e.g., sample size, random assignment to experimental conditions) constitute an important source and a point of departure for an operational definition of study quality and for an instrument designed to describe and to assess L2 research and reporting practices. In the case of this study, with its field-wide scope that encompasses the variety of subfields and designs therein, I defined study quality rather broadly as (a) adherence to standards of contextually appropriate, methodological rigor in research practices and (b) transparent and complete reporting of such practices.Footnote 4
In line with this definition of study quality, the range of items included in the instrument for this study was intentionally broad so as to be relevant to as many studies in the sample as possible. Some measures or items (e.g., whether or not a study included a delayed posttest) were, inevitably, only applicable to a certain type of design (e.g., experimental studies), but these data were not coded as missing from studies for which their use did not apply. Additionally, because of the wide range of observational or nonexperimental designs in the sample, design features associated with quality will only be assessed among (quasi-)experimental studies.
Previous Studies of L2 Research and Reporting Practices
As mentioned in the introductory section, study quality as a domain of inquiry has just begun to attract attention in the quantitative SLA literature. Nevertheless, descriptions and critiques of methodological and reporting practices in SLA have surfaced occasionally in research syntheses, meta-analyses, and historical reviews. In this section, I survey a number of such studies in three subsections and connect findings to discussions from related disciplines when appropriate; these subsections are (a) reviews of L2 research, (b) reviews and guidelines of L2 journals, and (c) Plonsky and Gass (Reference Plonsky and Gass2011).
Methodological Quality as Addressed in Reviews of L2 Research
The comments and concerns raised in reviews of quantitative L2 research have centered mainly around three related issues: study designs, statistical analyses, and reporting practices. In one of the first meta-analyses of L2 research, Norris and Ortega (Reference Norris and Ortega2000) synthesized research on the effectiveness of instruction. On the basis of their review, the authors included suggestions for improving the designs of future research on L2 instruction as well as for the field more generally, such as the inclusion of control groups and increased pretesting in (quasi-)experimental studies to more accurately measure the effects of interventions and verify comparability of groups. Plonsky (Reference Plonsky2011a) likewise called attention to the lack of delayed posttests among studies of L2 strategy instruction. In some cases, the problems found by both Norris and Ortega and Plonsky threaten the external validity of previous findings. In other cases, additional findings (e.g., the longevity of treatment effects) were not examined, thus leaving unnecessary gaps in the empirical literature. Many such problems are easily remedied with proper planning at the design stage of a study.
In his historical review of 9 decades of classroom-based research in The Modern Language Journal, Chaudron (Reference Chaudron2001) included a thoughtful and, at times, critical discussion of methodological shortcomings. For example, he lamented measures of low reliability, generally poor design, and the fact that “intact groups [as opposed to random assignment to experimental conditions] are the norm” (pp. 66–67; see also Henning, Reference Henning1986; Lazaraton, Reference Lazaraton2000, Reference Lazaraton and Hinkel2005; Nunan, Reference Nunan1991, Reference Nunan, Ritchie and Bhatia1996). Yet Nunan (Reference Nunan1991), in a similar review of 50 selected reports published in Studies in Second Language Acquisition, noted the relatively small portion of classroom-oriented research actually carried out in classrooms. Nunan went on to prescribe more “classroom-based as opposed to classroom-oriented research” to increase the relevance of SLA research to language practitioners (p. 259). He also observed that the majority of the studies he examined were nonexperimental or observational in nature. Finally, a number of L2 scholars have warned that the small samples typical of L2 research may be problematic because of their debilitating effect on statistical power (Chaudron, Reference Chaudron1986; Crookes, Reference Crookes1991; Flahive & Ehlers-Zavala, 2010; Hauser, 2001; Henning, Reference Henning1986; Larson-Hall, Reference Larson-Hall2010; Lazaraton, Reference Lazaraton1991; Norris & Ortega, Reference Norris, Ortega, Norris and Ortega2006; Oswald & Plonsky, Reference Oswald and Plonsky2010; Plonsky & Gass, Reference Plonsky and Gass2011; Plonsky & Oswald, Reference Plonsky, Oswald, Mackey and Gass2012). Addressing this problem may be difficult because it is unclear exactly why sample sizes tend to be small in SLA. Besides the obvious logistical challenge of recruiting large numbers of L2 learner participants, other factors may be at play, such as unfamiliarity with the implications of statistical power (Lazaraton, Riggenbach, & Ediger, Reference Lazaraton, Riggenbach and Ediger1987; Loewen et al., Reference Loewen, Lavolette, Spino, Papi, Schmidtke, Sterling and Wolffin press) or a lack of previous research reporting effect sizes to facilitate power analyses and determine appropriate sample sizes (Plonsky & Gass, Reference Plonsky and Gass2011).Footnote 5
With respect to statistical analyses and reporting practices, two major themes are evident from the synthetic literature describing L2 research. The first is the prevalence of means-based analyses (Gass, Reference Gass, Ritchie and Bhatia2009; Nunan, Reference Nunan1991; Teleni & Baldauf, Reference Teleni and Baldauf1989), which is a quality-neutral attribute. The second theme, which is more problematic, is that data often go missing in reports of L2 research. More specifically and perhaps surprisingly, the problem is most acute among simple descriptive statistics such as means and, especially, standard deviations. In their review of the use of meta-analysis in SLA, Oswald and Plonsky (2010) commented on and cited the number of studies that six L2 meta-analyses excluded because the data reported were insufficient to calculate an effect size; these ranged from 16 excluded studies in Russell and Spada (Reference Russell, Spada, Norris and Ortega2006) to 35 in Plonsky (Reference Plonsky2011a). In three of these meta-analyses (i.e., Dinsmore, Reference Dinsmore, Norris and Ortega2006; Nekrasova & Becker, Reference Nekrasova and Becker2009; Russell & Spada, Reference Russell, Spada, Norris and Ortega2006), the number of primary studies excluded for this reason actually exceeded the total number of studies included.
These figures should give us pause because, depending on their pervasiveness, missing descriptive statistics have the potential to weaken progress in the field in several ways. First and most immediately, unreported data restricts our ability to interpret the findings of primary studies. Second, as meta-analysts regularly point out, it is often impossible to calculate certain effect sizes (e.g., Cohen’s d) when descriptive statistics such as standard deviations are missing. In other words, because meta-analyses depend on the data reported in primary studies, missing data at the primary level necessarily yield missing data at the secondary or meta-analytic level, which (a) lowers power for moderator analyses, (b) renders potentially vast amounts of research un-meta-analyzable and therefore inefficient and unaccounted for, and (c) may produce a biased sample of primary studies.
Descriptive statistics are not the only aspect of reporting conventions found to be in need of improvement. Concerns have also been expressed over the reporting of reliability estimates and other types of data. Nekrasova and Becker (Reference Nekrasova and Becker2009) and Norris and Ortega (Reference Norris and Ortega2000), for example, found that only 6% and 16%, respectively, of the primary studies in their meta-analyses of the effects of practice (Nekrasova & Becker) and instruction (Norris & Ortega) reported any estimate of reliability for their dependent measures. Likewise, Mackey and Goo (2007) reported in their meta-analysis of L2 interaction that only two of the studies in their sample reported test reliability. Of course, whether or not instruments used in L2 research are highly reliable is of greater importance than the presence or absence of a quantitative indication of that reliability, but the availability of reliability estimates is also critical for interpreting research findings. Without an estimate of reliability, it is not clear whether small or nonstatistical effects in experimental studies, for example, should be attributed to an ineffective treatment or to a measure with low reliability, which is a distinction that has critical implications for the model being tested as well as for future studies of the phenomenon in question (Oswald & Plonsky, Reference Oswald and Plonsky2010; Polio, Reference Polio and Porte2012).
The reporting of reliability coefficients is also useful in the context of meta-analysis, in which reliability estimates are often used to weight study effects as described earlier (see Norris & Ortega, Reference Norris, Ortega, Doughty and Long2003, and Read, Reference Read2007, for discussions of issues related to reliability in L2 research in general, and Polio, Reference Polio1997, Reference Polio and Porte2012, for discussions of reliability related to studies of L2 writing). Other practices found to be absent or problematic by previous reviews of quantitative L2 research include (a) reporting of effect sizes and confidence intervals (Mackey & Goo, Reference Mackey, Goo and Mackey2007; Norris & Ortega, Reference Norris and Ortega2000; Plonsky, Reference Plonsky2011a), (b) stating research questions or hypotheses to be tested (Henning, Reference Henning1986), (c) checking the assumptions of statistical tests (Nunan, Reference Nunan1991), (d) providing graphic displays of data (Nekrasova & Becker, Reference Nekrasova and Becker2009), (e) reporting a predetermined level of statistical significance (Henning, Reference Henning1986), and (f) reporting whether or not participants were assigned to conditions randomly (Lazaraton, Reference Lazaraton and Hinkel2005; Nunan, Reference Nunan, Ritchie and Bhatia1996; Polio, Reference Polio and Porte2012).
This review may seem overly critical toward the field of SLA. To be fair, and to situate this discussion in a broader context, it is worth noting that many of the same issues present in L2 research have also been observed in other fields. Bangert and Baumberger (Reference Bangert and Baumberger2005) tallied statistical analyses and reporting practices in 256 studies published over 11 years in the Journal of Counseling & Development. They found that fewer than half of the studies in their sample that conducted tests of statistical significance reported effect sizes, and only two studies reported a power analysis (see comparably bleak findings with respect to the use and perception of statistical power in organizational research in Cashen & Geiger, Reference Cashen and Geiger2004; Mone, Mueller, & Mauland, Reference Mone, Mueller and Mauland1996; and Sedlmeier & Gigerenzer, Reference Sedlmeier and Gigerenzer1989). Similarly low or lower rates of effect sizes and confidence intervals were obtained by Kieffer, Reese, and Thompson’s (Reference Kieffer, Reese and Thompson2001) and Keselman et al.’s (Reference Keselman, Huberty, Lix, Olejnik, Cribbie, Donahue and Levin1998) studies of research published in several prominent educational journals. Additionally, Keselman et al. found that studies that reported having checked statistical assumptions were scarce. Finally, the reporting of reliability is another area of weakness apparently shared by both L2 research and other social sciences. Three decades ago, Willson (Reference Willson1980) found that only 37% of the quantitative studies surveyed and published in the American Educational Research Journal reported a reliability coefficient. He went on to criticize the field for this “unexcusable” practice “at this late date” (p. 9). More recent studies also have found reliability to be reported in as few as half of the studies published in different journals (Meier & Davis, Reference Meier and Davis1990; Thompson & Snyder, Reference Thompson and Snyder1998; Vacha-Haase, Ness, Nilsson, & Reetz, Reference Vacha-Haase, Ness, Nilsson and Reetz1999).
Reviews and Guidelines of L2 Journals
In the previous section, I summarized occasional and problematic trends in research and reporting practices as found in reviews of L2 research. Complementary to those findings, two studies of scholars’ perceptions of applied linguistics journals have found a relatively low priority given to methodological rigor. Egbert (Reference Egbert2007) surveyed members of the research interest section of the Teachers of English to Speakers of Other Languages (TESOL) International Association on their journal-reading preferences, and only 2 of 31 respondents cited sound research design in articles as a factor in determining the value of TESOL-related journals. However, seven mentioned the much broader trait of “quality of articles” (Egbert, Reference Egbert2007, p. 162), which may include methodological rigor. In a similar study, Smith and Lafford (Reference Smith and Lafford2009) asked established CALL researchers to cite their criteria for evaluating CALL journals. None cited quality in design or methodology employed (see also Magnan, Reference Magnan2007).
Contrary to and perhaps because of the perceived value of methodological rigor in L2 journals, editors of some journals have taken steps to improve the research and reporting practices found in the journals they oversee. In contrast to the bottom-up approach to reform seen in recommendations by individual researchers cited above such as Norris and Ortega (Reference Norris and Ortega2000, Reference Norris, Ortega, Norris and Ortega2006) and Oswald and Plonsky (Reference Oswald and Plonsky2010), this channel for reform takes a top-down approach. That is, editors can and have occasionally utilized their position to incite change. In an editorial statement (Ellis, Reference Ellis2000), Language Learning joined at least 23 other academic journals (see Vacha-Haase & Thompson, Reference Vacha-Haase and Thompson2004) in the social sciences that require that submitting authors “always present effect sizes and their confidence intervals for primary outcomes” (p. xii; see a reiteration of this policy by DeKeyser & Schoonen, Reference DeKeyser and Schoonen2007). Since then, Language Learning & Technology, The Modern Language Journal, and TESOL Quarterly have released similar guidelines with respect to effect sizes and other reporting practices that include stating the hypotheses to be tested, describing whether or not assumptions for statistical tests were met, and using graphs and tables to complement in-text presentations and explanations of quantitative data. To my knowledge, no other L2 journals have policies that state that submitting authors are required to adhere to any of these conventions (see DeVaney’s, Reference DeVaney2001, survey of editorial policies and preferences of non-L2 journals regarding the reporting of effect sizes and related practices; see also reviews of reporting practices from education and psychology in Sun, Pan, & Wang, Reference Sun, Pan and Wang2010, and Matthews et al., Reference Matthews, Gentry, McCoach, Worrell, Matthews and Dixon2008).
Plonsky and Gass (Reference Plonsky and Gass2011)
Plonsky and Gass’s (Reference Plonsky and Gass2011) study was motivated by much of the same literature reviewed here. Like the present study, the authors used meta-analytic techniques to examine study designs, statistical procedures, and data-reporting practices. In fact, the only major difference between Plonsky and Gass’s and the present study is scope. Whereas the present study examines L2 research as a whole, Plonsky and Gass focused on one particularly long-standing and influential line of inquiry in SLA: the interactionist tradition.
To carry out the 2011 study, Plonsky and Gass designed an instrument for describing and assessing quantitative research and reporting practices—a slightly modified version of which is used in the present study—and surveyed 174 published reports of research on L2 interaction. Their results revealed several strengths in study designs and reporting practices, such as the use of delayed posttests in 80% of (quasi-)experimental studies and the reporting of reliability in 64% of the sample. Additionally, Plonsky and Gass found several design-related weaknesses, such as a lack of pretesting (21% of quasi-experiments did not pretest), small samples and low statistical power (estimated at .56 according to a post hoc analysis), and a lack of random group assignment, even among experimental lab-based studies. They also observed inconsistencies in data-reporting practices. Means were often reported without standard deviations, t tests and ANOVAs were often reported without corresponding t and f values, and several reporting practices associated with quality (e.g., power analyses, checking statistical assumptions, confidence intervals) were largely absent.
Although Plonsky and Gass (Reference Plonsky and Gass2011) provide us with a rich data set regarding the state of research and reporting practices in the interactionist tradition, we cannot assume that this publication is representative of the rest of the field of SLA. In fact, I have already pointed out several examples of practices that vary from one subdomain of L2 research to another (e.g., reporting of reliability, frequency of missing data). What this study aims to produce, then, is a description and evaluation of designs, analyses, and reporting practices found in the larger field of SLA. In doing so, it will provide the L2 community with a source of empirical data to inform reflections on and perhaps reforms of research practices.
RESEARCH QUESTIONS
In light of the two-part goal of describing and evaluating L2 research, two research questions were addressed:
1. To what extent has L2 research included various design features and statistical procedures, both (a) generally or descriptively and (b) with respect to those associated with methodological and experimental rigor?
2. What types of data have been reported in L2 research, both (a) generally or descriptively and (b) with respect to those associated with transparency?
METHOD
The research questions were addressed by surveying a representative body of quantitative L2 research. The techniques used to retrieve, code, and analyze this body of primary research are characteristic of research synthesis and meta-analysis. However, this study differs from those brands of synthetic research in that the focus of this study is almost exclusively methodological (i.e., the “how” of L2 research) rather than substantive (i.e., the “what”).
Study Identification and Retrieval
The first step in carrying out this study was to determine a principled, representative, and accessible domain of empirical research within the field of SLA. I defined the domain along three dimensions: (a) location (i.e., sources of L2 research), (b) time (i.e., the dates to be included), and (c) substance or content (i.e., the types of research reports to include). Following Plonsky and Gass (Reference Plonsky and Gass2011), I began with the assumption that journals (as opposed to books or other publication formats) constitute the primary means by which SLA research is disseminated (Smith & Lafford, Reference Smith and Lafford2009; VanPatten & Williams, Reference VanPatten and Williams2002). Beyond the fact that journals are the medium of choice for publishing primary L2 research, they are also generally accessible through hard copy and electronic library resources. Moreover, primary studies published in books were excluded on the grounds that the number of possible sources would preclude the collection of an even and representative sample. I initially considered the 15 journals identified by 45 associate and full professors of SLA as regularly publishing L2 research (VanPatten and Williams, Reference VanPatten and Williams2002): Applied Language Learning, Applied Linguistics, Applied Psycholinguistics, Bilingualism: Language and Cognition, Canadian Modern Language Review, Foreign Language Annals, Journal of Second Language Writing, Language Awareness, Language Learning, Language Teaching Research, The Modern Language Journal, Second Language Research, Studies in Second Language Acquisition, System, and TESOL Quarterly. After consulting descriptions on journal Web sites, the list of potential sources was reduced to four journals that focus primarily or exclusively on L2 learning (as opposed to language teaching, technology, or other L2-related issues): Language Learning, The Modern Language Journal, Second Language Research, and Studies in Second Language Acquisition. The scopes of these journals were then examined more closely, and The Modern Language Journal was excluded because of its slightly broader interest in issues such as L2 pedagogy and the profession of language teaching. I also decided that Second Language Research would not be adequately representative of the field, given that the studies it publishes almost exclusively employ psycholinguistic methods and are related to morphosyntactic elements of the L2. The two remaining journals were included in the study: Language Learning and Studies in Second Language Acquisition. Although neither journal quality or any other index for journal prominence such as impact factor was considered in selecting sources of publication—my position in this article is that quality is an empirical issue and one that has yet to be examined—Language Learning and Studies in Second Language Acquisition were the two most highly rated SLA journals according to VanPatten and Williams’s (Reference VanPatten and Williams2002) survey. I, therefore, acknowledge that the sample for this study may present an overly generous or positive view of methodological quality.
With respect to the temporal dimension, all studies published 1990–2010 (inclusive) in the two journals were eligible for inclusion. A 2-decade span of research was chosen to examine the current state of research and reporting practices in the field as well as to permit analyses of recent changes across the 1990s and the first decade of the 2000s. Unfortunately, an examination of changes that have occurred over time is outside the scope of this article.
The substantive dimension was very inclusive. Because of the broad nature of the study and the narrow scope employed when selecting source journals (e.g., Lazaraton, Reference Lazaraton and Hinkel2005, referred to Language Learning and Studies in Second Language Acquisition as “niche” [p. 218] journals within the parent field of applied linguistics), the default was to include all primary, quantitative studies related to L2 learning that fell within the other two dimensions. However, a very small number of reports was excluded on the basis of the following criteria: (a) the substantive focus was studied and discussed only in relation to L1 acquisition (e.g., Nicoladis & Krott, Reference Nicoladis and Krott2007), (b) the exact same study was published elsewhere in the pool of candidate studies, such as in the Best of Language Learning Monograph Series (e.g., Pulido, Reference Pulido2004), (c) the study was a literature review or meta-analysis (e.g., Li, Reference Li2010), or (d) the report presented only qualitative data (e.g., Waring, Reference Waring2009). This final exclusion criterion was determined based on the interest of this study in quantitative research and reporting practices. All theoretical (i.e., nonempirical), methodological, and editorial articles were also excluded.
To summarize, I included all quantitative, primary L2 studies published in Language Learning or Studies in Second Language Acquisition from 1990 to 2010. A total of 606 reports met these criteria; 327 were published in Language Learning and 279 in Studies in Second Language Acquisition.
Coding
Each study was surveyed using a modified version of the protocol developed and first used by Plonsky and Gass (Reference Plonsky and Gass2011). In designing the instrument, Plonsky and Gass drew from a number of sources, all of which were discussed in the literature review; these were (a) previous instruments for assessing methodological quality from the meta-analysis literature (e.g., Valentine & Cooper, Reference Valentine and Cooper2008), (b) surveys of methodological and analytic practices from other fields (e.g., Goodwin & Goodwin, Reference Goodwin and Goodwin1985; Kieffer et al., Reference Kieffer, Reese and Thompson2001), (c) recommendations found in the Publication Manual and other American Psychological Association (APA) publications (i.e., Journal Article Reporting Standards Working Group, 2008; Wilkinson & the Task Force on Statistical Inference, 1999), (d) recommendations and findings of previous reviews of L2 research (e.g., Lazaraton, Reference Lazaraton2000; Norris & Ortega, Reference Norris and Ortega2000), and (e) reviews and guidelines of L2 journals (e.g., Ellis, Reference Ellis2000). For (c) and (e), only the most recent guidelines were used.
On the basis of the findings and recommendations of these sources, five different categories of data were coded: (a) study identification (e.g., year of publication, journal), (b) design (e.g., random group assignment, pretesting), (c) analyses (e.g., correlation, t test), (d) reporting of data (e.g., reliability coefficients, means), and (e) outcomes (i.e., effect sizesFootnote 6). The complete coding scheme will be available both for download via the IRIS database (www.iris-database.org) and from the author on request. Due to the wide range of observational or nonexperimental design types, and following Plonsky and Gass (Reference Plonsky and Gass2011), quality-related features coded for in category (b) were limited to those relevant to (quasi-)experimental research. To limit the number of potential items or variables in categories (c) and (d), I focused especially on means-based analyses (e.g., t tests, ANOVAs) and related data-reporting practices (e.g., means and standard deviations). This constraint was motivated by the predominance of means-based analyses in L2 research (Gass, Reference Gass, Ritchie and Bhatia2009; Lazaraton, Reference Lazaraton and Hinkel2005) and the problems associated with missing data related to these analyses at the meta-analytic level (see, e.g., Plonsky, Reference Plonsky2011a; Wa-Mbaleka, Reference Wa-Mbaleka2006). I did not, however, code only for tests that compared means and related statistics; all types of statistical procedures were recorded (e.g., chi-square, factor analysis). In contrast to similar reviews from other fields (e.g., Bangert & Baumberger, Reference Bangert and Baumberger2005; Goodwin & Goodwin, Reference Goodwin and Goodwin1985), I did not assign an a priori evaluation of sophistication to statistical techniques such as basic, intermediate, or advanced. Rather, in the absence of any recent surveys of L2 researcher knowledge of statistics, each type of analysis was treated equally.
I coded all 606 articles. An additional trained rater recoded a subset of 10 studies chosen at random from the sample. This number of studies may seem small, but it was simply not practical to perform double coding of the typical 10–20% (i.e., 60–120 studies) for this extraordinarily large sample. I calculated agreement between myself and the other rater as both a simple percentage and Cohen’s kappa to account for agreement due to chance among categorical variables. Overall interrater agreement was 82%, κ = .56, SE = 0.04, 95% CI [0.48, 0.63], which is fair. Cohen’s kappa is known to be overly conservative, especially when estimating reliability among a large number of categories (e.g., Aguinis, Pierce, Bosco, & Muslin, Reference Aguinis, Pierce, Bosco and Muslin2009; Brutus, Gill, & Duniewicz, Reference Brutus, Gill and Duniewicz2010; Fleiss, Reference Fleiss1971; Landis & Koch, Reference Landis and Koch1977). Nevertheless, I was concerned about the error rate, so I recoded the same set of study reports and found intrarater reliability of 96%, κ = .90, SE = 0.04, 95% CI [0.86, 0.94]. No additional studies were recoded, which was a decision made partly because of the high level of agreement found in Plonsky and Gass (Reference Plonsky and Gass2011). Their study used a version of the same instrument to code reports drawn from the same population as the current study and found 99.5% and 96.3% agreement for the first and second additional raters, respectively, who coded 10 studies each or 12% of the sample of 174 studies. Their overall percentage agreement was 97.9%. Furthermore, the difference in interrater reliability between Plonsky and Gass’s and the present study may be explained, in part, by the much greater homogeneity of studies in Plonsky and Gass. The most difficult items in the coding scheme were those that either involved inferencing on the part of the coder (e.g., whether a subsample should be designated as a comparison vs. control group) or were easy to miss even with careful reading (e.g., a single missing standard deviation or t value). Most of the coding categories, however, are relatively straightforward for those with training in quantitative methods.
Following Plonsky and Gass (Reference Plonsky and Gass2011), four study features were considered most important when exploring methodological quality in experimental studies. They were as follows and in order of preference for empirical control: (a) random assignment to experimental conditions, (b) inclusion of a control or comparison group, (c) pretesting, and (d) delayed posttesting (see Campbell & Stanley, Reference Campbell and Stanley1963; Shadish, Cook, & Campbell, Reference Shadish, Cook and Campbell2002).
Analysis
The analyses required to answer my research questions were relatively straightforward and similar to reviews of quantitative research practices in other fields (e.g., Goodwin & Goodwin, Reference Goodwin and Goodwin1985; Kieffer et al., Reference Kieffer, Reese and Thompson2001; Willson, Reference Willson1980). Both were addressed by calculating frequencies and percentages for the different designs, statistical analyses, and data-reporting practices found in the sample. Following Plonsky and Gass (Reference Plonsky and Gass2011), I also cross-tabulated frequencies and percentages for four design types: (a) observational studies carried out in classrooms, (b) observational studies carried out in laboratories, (c) experimental studies carried out in classrooms, and (d) experimental studies carried out in laboratories. Frequencies and percentages were also calculated for the four features associated with experimental control (i.e., random group assignment, inclusion of a control or comparison group, pretesting, and delayed posttesting) across the two experimental design or setting types: experimental studies carried out in classrooms and experimental studies carried out in laboratories.
RESULTS
Results for Research Question 1: Samples, Analyses, Settings, and Experimental Designs
The first research question was motivated by an interest in describing and evaluating several facets of study design and methodological quality. Specifically, it asked about the extent to which a number of methodological features and statistical or analytical procedures were present in quantitative L2 research. Table 1 shows the size of samples in L2 research, a factor related to statistical power and precision of findings and, thus, research quality. Overall, the studies in this sample included 1,732 unique samples, with most studies (i.e., 85%) including 1–4 groups or samples. The samples in a very small number of studies were in the thousands, but the median group or sample size was 19.
Sample sizes in L2 research

Note.
Min = minimum; max = maximum.
a Modal k per study = 1.
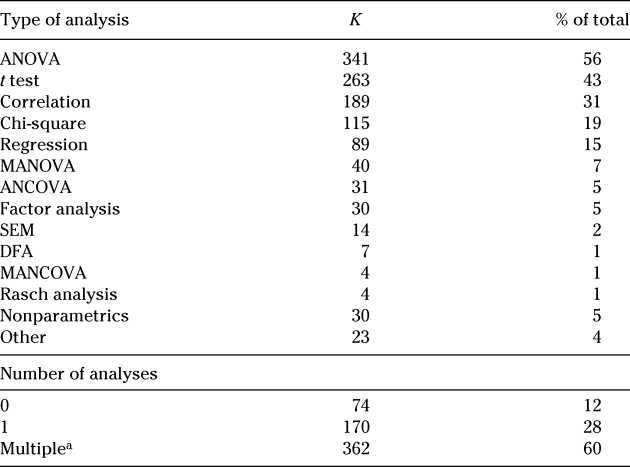
Research Question 1 also asked about the use of different statistical procedures and techniques. In Table 2, we see that the majority of studies in SLA tested for differences between group means using (in descending order) ANOVAs, t tests, MANOVAs, ANCOVAs, and MANCOVAs. Nonparametric equivalents of these tests were also used occasionally. Approximately 30% and 15% of the studies in this sample used correlations and regressions, respectively, and categorical or frequency data were used to calculate chi-square in about one fifth of the sample. Additional analyses carried out sporadically include factor analysis, structural equation modeling, discriminant function analysis, Rasch analysis, cluster analysis, unidimensional and multidimensional scaling, and growth curve analysis.
Statistical analyses in L2 research

a Maximum unique analyses = 6; statistical tests per study: M = 35 (SD = 64), 95% CI [30, 40], median = 18, min–max = 0–975.
Research in SLA often employs multiple statistical techniques in conjunction with one another. Table 2 also shows that 60% of the sample reported using multiple analyses, although no inferential statistics were reported in 12% of the sample, and 28% reported using a single statistical analysis. Related to the number of unique analyses is the number of tests of statistical significance (see Table 2). Studies of SLA research included 35 p values on average, with a median of 18 p values and corresponding analyses. However, the distribution of the number of p values is positively skewed, with several outliers (on the high end), as indicated by the somewhat large standard deviation (i.e., 64) relative to the mean. The intensive and extensive use of statistical testing in SLA also has debilitating implications for statistical power. Finally, due to the wrongful and arguably unethical omission of nonstatistically significant findings (see results below related to inferential statistics), these numbers may not accurately reflect statistical testing in SLA; in reality, these data likely underestimate the already large number of tests carried out.
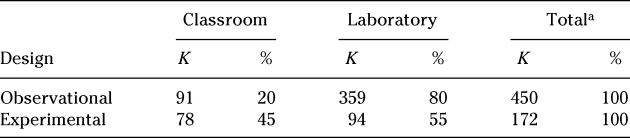
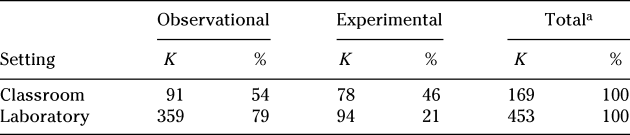
Tables 3 and 4 show the frequency and percentage of studies for which different designs and settings were employed.Footnote 7 Overall, we see that the vast majority of L2 research is lab based as opposed to classroom based and observational as opposed to experimental. There also appears to be a relationship between designs and settings. Whereas experimental research was carried out nearly equally in classrooms and labs, observational studies were 80% lab based and only 20% classroom based.
Major designs across research settings in L2 research
a A small number of studies were both observational and experimental (e.g., Loewen, Reference Loewen2005) or were carried out in both laboratories and classrooms (e.g., Lyster & Izquierdo, Reference Lyster and Izquierdo2009). Thus, the total number of studies across all cells, and the total number of studies that percentages are based on, is greater than 606.
Research settings across major designs in L2 research
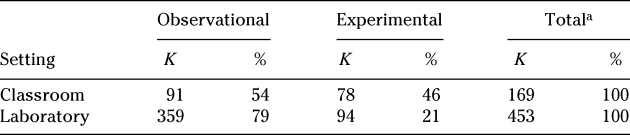
a A small number of studies were both observational and experimental (e.g., Loewen, Reference Loewen2005) or were carried out in both laboratories and classrooms (e.g., Lyster & Izquierdo, Reference Lyster and Izquierdo2009). Thus, the total number of studies across all cells, and the total numbers of studies that percentages are based on, is greater than 606.
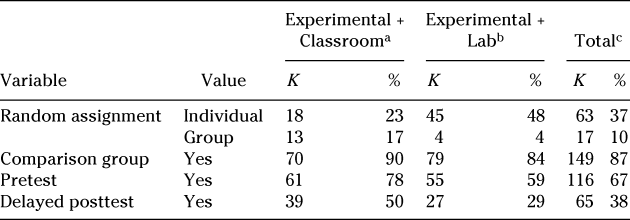
Looking across the four design features associated with quality in (quasi-)experimental designs (i.e., random assignment to experimental conditions, inclusion of a control or comparison group, inclusion of a pretest, inclusion of a delayed posttest), the results are somewhat mixed (see Table 5). Overall, about half of the experimental studies reported to have assigned participants to experimental conditions randomly, whether by group or individually. As might be expected, lab studies were more likely than classroom-based studies to randomize conditions, which is the preferred practice for studies seeking to measure treatment effects among two or more conditions. The use of comparison groups was very common. Approximately 90% of experimental L2 research carried out in both classrooms and labs compared the effects of interventions to a control or comparison group. A somewhat smaller number of experimental studies included pretests to test or control for pretreatment differences (i.e., 78% of classroom- and 59% of lab-based studies). Among experimental studies in this sample, approximately 38% examined the durability of treatments using one or more delayed posttests, but the rate of inclusion of delayed posttests is not consistent across research settings: Classroom studies were substantially more likely to measure effects at a delayed interval than were lab studies (i.e., 50% as opposed to 29%, respectively).
Design features associated with quality in experimental L2 research
a Out of a total of 78 Experimental + Classroom studies.
b Out of a total of 94 Experimental + Lab studies.
c Out of a total of 172 (quasi-)experiments.
Results for Research Question 2: Reporting Practices
Research Question 2 approaches study quality by examining data-reporting practices with respect to several sources, including the guidelines provided by the APA and several SLA journals, measures of methodological quality from the research synthesis literature (e.g., Valentine & Cooper, Reference Valentine and Cooper2008), recommendations for improving SLA reporting practices (e.g., Chaudron, Reference Chaudron2001; Norris & Ortega, Reference Norris, Ortega, Norris and Ortega2006), and meta-analyses that have identified missing data in different areas of L2 research (e.g., Mackey & Goo, Reference Mackey, Goo and Mackey2007). I grouped reporting practices into three categories: (a) descriptive statistics, (b) inferential statistics, and (c) other types of data and reporting practices associated with study quality and recommended by the APA Publications and Communications Board Working Group on Journal Article Reporting Standards (2008) but not covered by the first two categories.
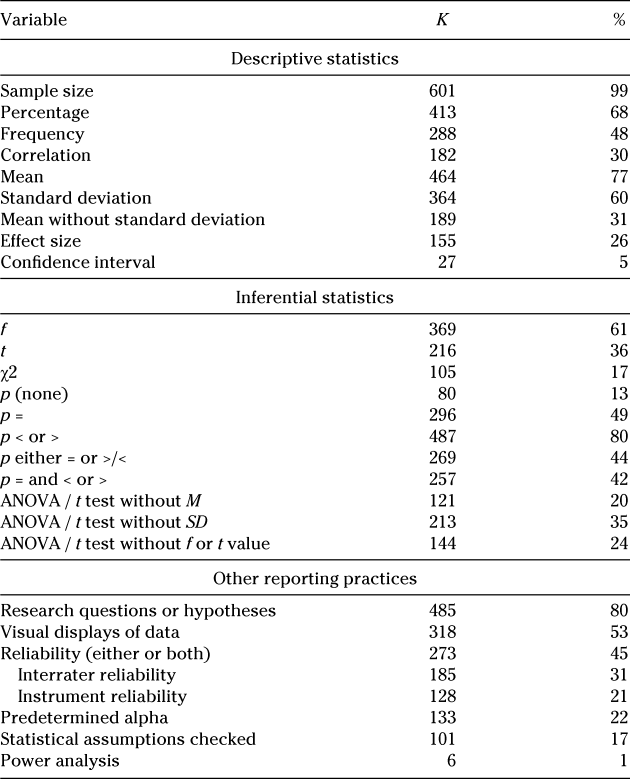
Table 6 displays the frequencies and percentages of studies reporting different descriptive statistics. Thorough reporting of data in this category not only enables consumers of primary research to more fully understand and assess study findings but also avails primary data to would-be meta-analysts who require such data to calculate an effect size. The most commonly reported descriptive statistic, not surprisingly, was sample size, which was reported in 99% of the articles in the sample. Also regularly reported were percentages (in 68% of the sample), frequency data (48%), and correlations (30%), all of which reflect the use of analyses described earlier such as chi-square tests, correlations, regressions, and so forth. Means are reported in 77% of the sample, which is reflective of the largely means-based analyses in SLA, but standard deviations, which we would expect or hope to be reported equally as often as means, were reported in only 60% of the sample. The difference of 17%, however, obscures the frequency with which means are reported without standard deviations because reporting both statistics does not ensure that all means reported in studies with means were accompanied by their standard deviations. For this reason, studies were also coded for the presence of a mean without a standard deviation, which was found in 31% of the sample. About a quarter of the studies in the sample reported an effect size, but only 5% reported confidence intervals to show the precision of their results. Although not coded for throughout the entire sample, it was noticed that at least nine studies that reported effect sizes did so only for statistically significant results. This practice suggests a bias toward statistically significant results in that those authors did not deem it necessary to report effect sizes along with nonstatistical results.
Reporting practices in L2 research
Table 6 also displays the frequencies and percentages of studies that reported different types of inferential statistics with particular attention to means-based analyses, which are, by far, the most common type of analysis in SLA. Roughly in line with the results for statistical tests in Table 2, f and t statistics were reported in 61% and 36% of the sample, respectively. Although high, these figures are somewhat lower than the percentage of studies that reported use of ANOVAs (i.e., 56%); regressions, which also produce f values (15%); t tests (43%); and other tests comparing means. Moreover, the number of studies failing to report one or more f or t value is much higher. Nearly one quarter of the sample (i.e., 24%) reported a statistical test that compared means without reporting the appropriate f or t statistic. In many cases, these omissions co-occurred with nonstatistically significant p values. Similar to the situation described in the previous paragraph in which effect sizes were reported for statistical results only, an even larger number of reports (k = 27) omitted f and t values when p > .05 but did not omit them when p < .05. Some of these omissions were implicit, such as when the results of nonstatistically significant ANOVAs were reported as “f < 1.” In many other cases, authors carried out statistical tests but explicitly stated that only those results found to be statistically significant would be reported, which offers further evidence of the suppression of nonstatistically significant results. In addition to test statistics such as f and t, the descriptive statistics that accompany those tests were often omitted as well. One or more means and standard deviations being compared in a statistical test were not reported in 20% and 35% of the sample, respectively. Although not necessarily indicative of a bias toward statistically significant results, this finding provides field-wide evidence for the missing data problem in SLA that is discussed regularly in meta-analyses of L2 research (e.g., Russell & Spada, Reference Russell, Spada, Norris and Ortega2006).
In an effort to understand better the reporting practices for inferential statistics, this part of the analysis also considered the different ways that p values that result from tests of statistical significance are reported. Before presenting the results, it is worth noting a couple points related to null hypothesis significance testing (NHST), a practice that has been condemned for decades by quantitative methodologists (e.g., Cohen, Reference Cohen1994; Lykken, Reference Lykken1968; Schmidt, Reference Schmidt1996; Thompson, Reference Thompson2001), cautioned against sporadically by L2 researchers (Crookes, Reference Crookes1991; Larson-Hall, Reference Larson-Hall2010; Lazaraton, Reference Lazaraton1991; Nassaji, Reference Nassaji and Porte2012; Norris & Ortega, Reference Norris and Ortega2000, Reference Norris, Ortega, Norris and Ortega2006; Oswald & Plonsky, Reference Oswald and Plonsky2010; Plonsky, 2009, Reference Plonsky2011a), and brought to justice recently in the U.S. Supreme Court (Matrixx Initiatives Inc. v. Siracusano, 2011) on the grounds that it is unreliable, uninformative, and arbitrary, among other arguments. Beyond the controversy of what role, if any, NHST ought to have in quantitative research, the APA recommends reporting of the “direction, magnitude, degrees of freedom, and exact [emphasis added] p level, even if no significant effect is reported” (Journal Article Reporting Standards Working Group, 2008, p. 843). Despite this recommendation, the results in Table 6 show that four out of five reports of L2 research report one or more p values as greater or less than a particular cutoff for statistical significance such as .05 (i.e., not an exact value). Approximately half of the studies in this sample report exact p values. Studies were also coded for their (in)consistency in reporting p values; 44% of the sample reported p values in a consistent manner throughout the report, and 42% of the studies reported both relative and exact p values.
The frequencies and percentages of studies with additional reporting practices associated with quality are shown in Table 6 as well. These results are mixed at best, in that only one could be said to be reported consistently in SLA research—that is, research questions or hypotheses (i.e., in 80% of the sample). Visual displays of data were present in just more than half of the sample. Reliability coefficients were found in almost half, with 31% reporting an estimate of interrater reliability and 21% instrument reliability (e.g., internal consistency). Although almost all of the studies reported using statistical tests (see Table 2), only 22% reported setting an a priori level of statistical significance, 17% reported checking the assumptions of their statistical tests, and power analyses were reported in only six studies (i.e., 1% of the sample), two of which were carried out post hoc.
DISCUSSION
The goal of this study was to describe and assess the quality of quantitative methods in L2 research. In light of the multidimensional nature of study quality and the range of methodological features explored, I did not set out to characterize the breadth of SLA research as high or low in quality. Rather, this study asked about the extent to which a number of quantitative research and reporting practices were present in L2 research. In the discussion that follows, I address the results pertinent to this question, situate them in the context of previous research, and suggest changes in practice when appropriate. Rather than discuss findings in a result-by-result fashion, and because there are many conceptual overlaps among findings, the discussion below is organized into three themes: (a) means-based analyses; (b) missing data, NHST, and statistical power; and (c) design preferences. The focus throughout is on study quality in the observed sample with an eye toward advancing and improving methodological practices in future research.
Means-Based Analyses
The results of this study began with a description of different statistical analyses in L2 research. As found in previous reviews (e.g., Gass, Reference Gass, Ritchie and Bhatia2009; Teleni & Baldauf, Reference Teleni and Baldauf1989), the most common statistical tests in L2 research are, by far, those that compare means. Skidmore and Thompson (Reference Skidmore and Thompson2010) similarly found ANOVA or ANCOVA to be the most frequently used statistic in education and psychology journals. Unlike SLA, however, they found regression and correlation to be second and third most frequent, and t tests were least frequent, behind factor analyses, cluster analyses, and nonparametric statistics. That L2 research depends mostly on analyses that compare means is not in and of itself problematic, assuming that (a) those statistical tests are chosen on the basis of their appropriateness for the available data and for the questions being posed rather than out of convention or convenience (I return to this issue in two paragraphs); (b) certain assumptions are met (e.g., normal distributions; see C. S. Wells & Hintze, Reference Wells and Hintze2007), a condition only verified in 17% of the present sample;Footnote 8 and (c) the data are reported thoroughly and faithfully, which this study has shown is often not the case (see the Missing Data section).
The heavy use of analyses such as t tests and ANOVAs observed in this study also means that almost all statistical tests found in L2 research fall under the general linear model (GLM), with the exception of chi-square tests (in 19% of the sample) and the nonparametric equivalents of t and f tests (in 5%), which are conceptually, if not statistically, related to the GLM. However, having read roughly 600 methods sections, I have the sense that the related and hierarchical relationship within the family of GLM statistics is largely unknown to L2 researchers. I mention this not to draw attention to gaps in our knowledge but rather because I wonder if a clear introduction to the GLM and its constituent analyses would prompt a shift in analyses, as was seen in psychology following Cohen (1968; see Skidmore & Thompson, Reference Skidmore and Thompson2010).
Regardless of whether L2 researchers necessarily recognize most of the statistics they use and read about as belonging to the GLM—a revelation obscured or omitted in most quantitative L2 methods textbooks—it may be worth reflecting on the use of ANOVA-type statistics and asking whether SLA is best served by ANOVA and, if not, whether other options exist. I cannot resolve these issues entirely here, but I will attempt to initiate a conversation by making a couple points.
First, it appears that the default status of ANOVA has come to shape certain conventions of design and measurement in L2 research, the most notable of which is the conversion of continuous-level data to a nominal scale. Researchers in SLA as well as in other social sciences often convert interval-type variables into categorical (i.e., between-participants) ones (e.g., motivation: low, high; proficiency: low, intermediate, high; age: pre- or postpubescent) to then compare these new groups’ means on one or more dependent variables. Several voices from other disciplines (e.g., Humphreys, Reference Humphreys1978) and at least one in SLA (Lee, Reference Lee2010) have spoken out against the nominalization of continuous data and have argued instead for correlational or regression analyses. Their point, and the one I would like to make here, is that “variance is the ‘stuff’ on which all analyses are based” (Skidmore & Thompson, Reference Skidmore and Thompson2010, p. 791); trading variance for what appears to be a cleaner analytical approach results in a waste of data and a loss of statistical power (Cohen, 1968). This issue was brought to the forefront in psychology following Cohen’s (Reference Cohen1968) classic paper. He demonstrated very convincingly that multiple linear regression presents a more parsimonious and statistically powerful modeling tool than ANOVA, whether the independent variables are intervally or nominally scaled (with dummy coding of the latter).
My second point is much the same: L2 theory and research may benefit from greater use of regression analysis. As Cohen (Reference Cohen1968) explained, regressions and ANOVAs take slightly different analytic paths to reach the same results. To illustrate this concept, consider the fact that (a) ANCOVA is essentially a regression that removes the covariance in the covariate(s), and (b) the well-known eta squared, which is usually calculated from an ANOVA, is a type of squared correlation ratio and is mathematically and conceptually identical to the R squared value that results from a regression. However, ANOVA and regression part ways in terms of their utility, parsimony, and statistical power when multiple independent variables are of interest. Whereas multiple ANOVAs would be needed to determine the presence and magnitude of main effects, interactions, and so forth, a regression handles them all in a single test and provides a quantitative indication of their contributions and errors relative to the model. Along these lines, multivariate analyses have also been suggested as an alternative to running multiple ANOVAs, which were found by this study to be very common in L2 research. For example, MANOVA preserves statistical power and better reflects the multivariate nature of the reality we attempt to measure (Fish, Reference Fish1988; Raykov & Marcoulides, Reference Raykov and Marcoulides2008, chapter 1; see Gelman, Hill, & Yajima, 2012, for an alternate, Bayesian perspective on multiple comparisons). Looking back at Table 2, which shows the use of statistical significance testing in SLA, we could expect these figures to be lower (thus preventing inflation of Type I error) if more studies had employed regressions and MANOVAs instead of ANOVAs.
Missing Data, NHST, and Statistical Power
My second research question asked about the thoroughness of data reporting in L2 research. As with many of this study’s results, the findings here are mixed, at best. Before discussing the results for this phase of the analysis, I want to reiterate my perspective on data-reporting practices as a measure of study quality. I do not equate completeness with overall study quality nor incompleteness with low quality. Rather, I view the thoroughness with which data are reported as one among several indicators of study quality. This section discusses problems associated with transparency in published L2 research along with related challenges the field faces concerning NHST and statistical power.
With respect to the reporting of descriptive statistics, the most notable finding is that approximately one third (i.e., 31%) of the studies in the sample reported one or more means without standard deviations. This practice is problematic because it greatly limits interpretability in primary studies and restricts data from inclusion in meta-analytic reviews.
Problems related to missing data are also related to and even amplified by the fact that quantitative L2 research relies heavily—almost exclusively—on the flawed notion of using statistical significance to test hypotheses and, thereby, to move theory forward and to inform practice. In fact, the median number of p values reported per study included in the present synthesis was 18. This figure may seem high in terms of its debilitating effect on statistical power, especially considering the median sample or group size of 19, but the actual number of statistical tests is likely even larger.
This pattern of omitted data among descriptive statistics and p values continues into the realm of inferential statistics. Studies that carried out ANOVAs or t tests regularly left out f or t statistics (i.e., 24% of the sample) as well as the means and standard deviations being compared in those tests, especially when p > .05. What is particularly troubling is the fact that many of these authors provided explicit statements about not reporting test statistics and descriptives for nonstatistical results by deliberate choice, showing that they equate a lack of statistical significance with insignificance. These findings are highly problematic in light of the potential for bias that they introduce (Pigott, Reference Pigott, Cooper, Hedges and Valentine2009). Consider the following from the field of medicine. Chan, Hróbjartsson, Haahr, Gøtzsche, and Altman’s (Reference Chan, Hróbjartsson, Haahr, Gøtzsche and Altman2004) review of 122 published articles found that outcomes reported thoroughly were twice as likely to be statistically significant than outcomes that were missing data such as means, standard deviations, or t values. On the basis of the stated omission of f or t values in 27 studies and of effect sizes in 9 studies only when p > .05 (but not when p < .05), there is reason to believe that the same practice observed by Chan et al. may also be found in L2 research. Again, the main cause for concern here is not so much the impact that missing data have on primary studies themselves but their effect on meta-analytic means, which perhaps we should begin to assume to be inflated by nonstatistical findings that go unreported. The bumper sticker for those who feel strongly about this issue might read something like “Beware: Effects in rear view mirror are smaller than they appear!” A formal assessment of the presence of publication bias in SLA is certainly needed.
Related to these erroneous omissions are three additional reporting practices related to steps to be taken prior to conducting statistical tests and required by journal or societal guidelines. First, only 22% of the sample reported a predetermined level of statistical significance. This finding is approximately the same as found in the interactionist literature, in which just 25% reported an a priori cutoff for statistical significance (Plonsky & Gass, Reference Plonsky and Gass2011). Second, 17% of the sample reported having checked statistical assumptions, which, when unmet, can have an adverse effect on power by preventing a test from identifying statistical significance. Third, and finally, is statistical power itself. Only six studies in the sample (i.e., 1%) conducted a power analysis. Again, the rarity of power analyses does not necessarily indicate low power. On the basis of the median sample size of 19 and a d value of .71, as calculated in the larger study from which the present data set was drawn (Plonsky, Reference Plonsky2011b), however, we can roughly gauge post hoc power in the field at .57, or a 57% chance of appropriately detecting statistical significance.
The evidence of a “power problem” seems to be accumulating. To review: L2 studies (a) tend to rely on very small samples, (b) typically conduct about 18 tests of statistical significance, (c) do not generally produce very large effects (median d = .71, which is likely inflated), (d) regularly omit results of nonstatistical results, (e) rarely check or report whether statistical assumptions have been met, (f) rarely use multivariate analyses, and (g) almost never conduct power analyses.
Because of these problems related to power and the prominence of NHST in L2 research, I suggest, first, that individual researchers conduct a priori power analyses to determine appropriate sample sizes. Second, and more generally, I would also encourage researchers to be skeptical of p values and to remember that (a) a p value at less than .05 with a large sample is meaningless because any size difference between groups (or correlation) will reach statistical significance given a large enough sample; (b) small samples with statistical findings may not be reliable either because they are likely infected with high sampling error or represent a large effect, neither of which are captured by the small p value; and (c) when small samples are used to study small effects, a finding of statistical significance is probably, if not necessarily, an overestimate (Gelman & Weakliem, Reference Gelman and Weakliem2009). Third, as an alternative or in addition to p values, I suggest calculating and reporting effect sizes along with a contextualized explanation of their meaning. To do so and to do so well, researchers have to accept that their findings will probably be best understood as a matter of degree, not a dichotomous yes or no (or even a trichotomous small, medium, or large; see Oswald and Plonsky, Reference Oswald and Plonsky2010, and Plonsky and Oswald, Reference Plonsky, Oswald, Mackey and Gass2012, for some ideas on how to interpret effect sizes such as in simple standard deviation units, in relation to previous studies and meta-analyses, or relative to the L2-specific benchmarks we propose).
Mixed results were also found for several other reporting practices associated with quality. In contrast to Henning’s (Reference Henning1986) claim that research questions and hypotheses were not often stated, this study found them clearly reported in 80% of the sample. Reliability in one form or another was found to be reported in 45% of the sample. But this practice appears to vary among different subdomains, as previous reviews have found reliability coefficients in as few as 6% of their samples (L2 practice; Nekrasova & Becker, Reference Nekrasova and Becker2009) and as much as 64% (L2 interaction; Plonsky & Gass, Reference Plonsky and Gass2011). Regardless of variability across SLA, there is clearly room for improvement in estimating and reporting reliability. Similar to other types of inconsistently reported data, omission of an estimate of reliability not only weakens the interpretability and trustworthiness of individual studies but also restricts meta-analysts from making the most of existing research and leaves future researchers to use the same or a similar instrument without a point of comparison for their instruments and samples.
Inconsistencies and infidelities such as those discussed in this section may be dealt with by and are the responsibility of journal reviewers and editors, if not individual researchers. However, many reviewers may be burdened by the largely thankless task at hand and may feel that closely examining the statistical analyses and reporting thereof to be too time-consuming or outside their realm of expertise. Perhaps with these issues in mind, a former editor of The Modern Language Journal expanded the review process of the journal to include a “specific review for appropriateness of research design, methods, and statistical procedures” (Magnan, Reference Magnan1994, p. 8) for all empirical submissions that advance beyond the first round of reviews. Editors of other journals could and should consider adopting a similar practice.
Design Preferences
I also examined major design types and settings found in L2 research. Many of these study features are descriptive and not necessarily associated with quality but are important for understanding the major approaches taken in SLA. Because the focus here is on study quality, however, I begin with a discussion of findings for four features associated with experimental rigor or control—(a) random assignment, (b) inclusion of a control or comparison group, (c) pretesting, and (d) delayed posttesting—across both classroom and lab studies.
In contrast to what we might expect, classroom-based studies were generally more likely to exhibit these features than lab studies (see Table 5). The only exception was in random group assignment, which was found in 52% of lab and 40% of classroom studies. Again, the logistics of classroom-based research make it easy to understand this difference. It is less clear, however, why the figure would be so low in lab studies.Footnote 9 It may be that some lab researchers did, in fact, assign participants randomly but did not report having done so. Other researchers may not be familiar with preferred practices in experimental research design. Still others may have pretested to verify comparability of groups and thus deemed random assignment unnecessary. The three other features, discussed in the next paragraph, were all found in a greater portion of classroom than lab studies.
Comparison groups were very frequent overall (i.e., 87%) and in both settings (i.e., 90% of classroom studies vs. 79% of lab studies), which is similar but in a pattern opposite to that of Plonsky and Gass’s (Reference Plonsky and Gass2011) findings (i.e., 60% vs. 95%, respectively). Pretesting was relatively frequent in classroom studies and somewhat less so in labs (i.e., 78% vs. 59%, respectively). As I mentioned in the previous paragraph, some researchers may have assigned participants randomly to experimental conditions and may have, therefore, determined a pretest unnecessary. With the small sample and accordingly low power or large sampling error found in SLA, however, it may be best to pretest in all experimental studies (see Norris & Ortega, Reference Norris and Ortega2000.) In addition to using pretest scores to verify comparability of groups or as covariates, greater pretesting in experimental research would also enable more precise estimates of gains that can be compared to and meta-analyzed with similar studies. Delayed posttesting was found in relatively few classroom (i.e., 50%) or lab (i.e., 29%) studies (38% overall). These results are surprising compared to those of Plonsky and Gass (i.e., 77% classroom, 81% lab) and are disappointing in light of the theoretical and practical value of understanding the longevity of instructional effects in SLA.
Along with these four indicators of experimental quality, I also examined basic designs and settings across the sample of L2 research. Among the studies surveyed, approximately three quarters have been lab based, a somewhat surprising finding given the applied nature of the field and the tendency for researchers to translate their findings into classroom implications. Of course the logistical challenges of classroom research need to be recognized. It is not always practical, pedagogically appropriate, or methodologically viable for L2 researchers to carry out studies in actual classrooms. At the same time, in spite of those who apply SLA research to the classroom or make calls for teachers to do so (see Hatch, Reference Hatch1978; Ortega, Reference Ortega, Hinger, Newby and Unterrainer2012), a lab-based majority may indicate L2 researchers’ preference or priority in a classic trade-off: Whereas classroom research can preserve ecological validity, lab studies provide the researcher with greater control. I use the term “control” loosely here to refer to design elements associated with quality and statistical validity (e.g., random assignment to experimental conditions) as well as, more broadly, to the ability to manipulate the procedures, logistics, and environment surrounding a study.
With respect to the design types chosen, which is an issue related to study setting, the data show that the vast majority of L2 research is not experimental but observational. Despite the relative frequency of these two major design types, it is interesting and perhaps telling that nearly all SLA meta-analyses have synthesized corpora of (quasi-)experimental studies (Oswald & Plonsky, Reference Oswald and Plonsky2010; Plonsky, Reference Plonsky and Porte2012). The more immediate relevance of experimental research for classroom instruction may partly explain this incongruity. Or perhaps experimental research more often addresses the more intensely debated questions of SLA—for instance, the effectiveness of instruction, feedback, and CALL—and thus prompts greater attention from meta-analysts.
The relative abundance of observational research may also be a function of logistics and control, as previously described in the context of research settings. The one-shot, lab-based designs of many nonexperimental studies (e.g., those that use grammaticality judgment tests or a battery of aptitude and proficiency measures) may appeal to researchers as a means to acquire data more immediately than a pre-post-delayed design with multiple intact classes, multiple instructors, multiple treatment sessions, and considerable potential for contamination and attrition. Another interpretation of these data would argue that researcher choices related to designs and settings are simply based on the questions they pose. Whereas a strength of this study is its macrolevel perspective on how L2 research is carried out and reported, it tells us nothing about researchers’ motivations and decisions. Case studies of individual researchers as they design, carry out, analyze, and report data may shed light on this process.
CONCLUSION
This study set out to gain a better understanding of quantitative research and reporting practices in SLA. This goal involved both an evaluation of the quality of primary research and a more descriptive, nonevaluative assessment of research and reporting practices. The data collected for this study provide us with a quantitative indication of many aspects of L2 research previously unknown, such as the extent to which L2 research is lab versus classroom based, the inclusion of delayed posttests in experimental research, and the frequency of NHST. A considerable number of weaknesses were also observed in the sample of primary studies, and the concerns raised by these weaknesses empirically assessed in the present study merit serious attention. In particular, the Discussion section highlighted the need for field-wide reform of data analyses and data-reporting practices and greater consideration of statistical power and the related notion of statistical significance. Looking forward, the findings of this study should prompt the field of SLA, at the very least, to reflect on and to investigate further the means by which L2 research is carried out and reported. Ideally, more concrete action will be taken at both institutional and individual levels to enact reform. I am hopeful and optimistic that the necessary steps will be taken to improve this field and the means by which it moves forward.