
Introduction
The frantic working schedules, worldwide witnessed by human race, are associated with the increasing incidences of chronic diseases such as diabetes, stress, cancer, and other metabolic disorders. Oral squamous cell carcinoma (OSCC) is highly prevalent globally and is a major cause for high mortality rate[Reference Siegel, Miller and Jemal1] with a higher number in south-east Asian countries.[Reference Krishna Rao, Mejia, Roberts-Thomson and Logan2] It is one of the common forms of head and neck cancer that involves the formation of cancerous lesions around the oral cavity and oropharynx.[Reference Rivera3] Major risk factors include tobacco usage, alcohol consumption, smoking, and human papillomavirus (HPV) infection, while other less prominent factors are poor oral hygiene, improper diet, microbial infection, chronic exposure to sun, or certain chemicals.[Reference Rivera3] The delay in diagnosis of the onset of disease remains one of the major contributors to the low survival rate due to oral cancer. In addition to this, the classical methods are invasive, labor-intensive, and expensive making the detection process quite cumbersome for routine diagnosis.[Reference Mehrotra and Gupta4] This poses a strong need to develop easy to use, fast, and accurate diagnostic tools. To this end, the point-of-care devices, such as biosensors, are the preferred options in healthcare services.
With the identification of various oral cancer-specific biomarkers (proteins expressed by cancerous cells that are indicative of its progress), the prospect of early-stage detection and treatment follow-ups may witness a paradigm shift.[Reference Nimse, Sonawane, Song and Kim5] Electrochemical detection of tumor-specific biomarkers through specific biosensing devices promises for point-of-care and early detection of oral cancer.[Reference Chikkaveeraiah, Bhirde, Morgan, Eden and Chen6] Interleukin-8 (IL8) is one such biomarker from the family of cytokines that plays a vital role in tumor growth and metastatic processes in many cancer types.[Reference Watanabe, Iwase, Ohashi and Nagumo7] IL8 marks the oral cancer progression with its significantly high levels of expression in saliva (720 pg/mL) of OSCC patients compared to that in healthy persons (250 pg/mL).[Reference St. John, Li, Zhou, Denny, Ho, Montemagno, Shi, Qi, Wu, Shinha, Jordan, Wolinsky, Park, Liu, Abemayor and Wong8] This wide difference in the expression level of IL8 in saliva makes it an intriguing tool for developing noninvasive biosensor for salivary OSCC detection. This diagnostic tool may promise for accurate and reliable oral cancer diagnosis as well as its monitoring throughout the treatment procedures.
The amalgamation of nanomaterials-based transducer systems into electrochemical biosensing devices has recently attracted a lot of attention of the researchers due to their ability to provide fast, simple, and accurate measurement of biomarkers present at very low concentrations in the body fluids.[Reference Anik and Timur9,Reference Rusling, Sotzing and Papadimitrakopoulos10] Among various nanomaterials proposed, graphene oxide (GO), a planar lattice structure comprising of sp2-bonded carbon in a honeycomb network along with few sp3-bonded carbon attached to functional groups, exhibits outstanding properties, namely high surface area, mechanical strength, conductivity, and charge carrier mobility, making it a preferred nanomaterial for biosensing applications.[Reference Wang, Xiong, Xiao and Duan11] Moreover, new prototypes involving conjugation of nanoparticles with enhanced heterogeneous electron-transport properties on GO sheets (or its derivatives) are being fervently looked upon to attain advancement in biosensing capability in terms of specificity and disease monitoring time.[Reference Verma, Singh, Shukla, Kaswan, Arora, Ramirez-Vick, Singh and Singh12,Reference Pachauri, Dave, Dinda and Solanki13] ZnO nanoparticles are direct bandgap semiconductors known for high charge transfer capabilities and biocompatible nature with high surface area to volume ratio that provide a suitable microenvironment for immobilization, as well as stability of biomolecules on their surface.[Reference Arya, Saha, Ramirez-Vick, Gupta, Bhansali and Singh14] It was envisioned that integration of GO (or its derivatives) with ZnO nanoparticles could significantly raise the sensitivity of the electrochemical biosensors.
Here, we report the synthesis of zinc oxide–reduced graphene oxide (ZnO–rGO) nanocomposite and its application as transducer matrix for the fabrication of a label-free, noninvasive, and cost-effective immunosensing platform for sensitive detection of oral cancer biomarker (IL8). The immunosensor showed successful detection of oral cancer biomarker “IL8” at sub-picomolar ranges with very high sensitivity, selectivity, and good stability. The enhanced electron-transfer property exhibited by ZnO–rGO nanocomposite allowed efficient detection of IL8 in saliva as well. The immunosensor represents an edge over classical diagnosis methods for faster detection and clinical evaluation of tumor progression in OSCC patients.
Materials and methods
Reagents and techniques
The chemicals used for the synthesis of GO, i.e., potassium permanganate, sulfuric acid, sodium nitrate, hydrogen peroxide, were obtained from Merck India Pvt. Ltd., while graphite powder was provided by Acros Organics. ZnO nanoparticles were prepared using zinc acetate dihydrate and lithium hydroxide as precursors obtained from Sigma-Aldrich India. A 1:1 (v/v) composition of N-ethyl-N′-(3-dimethylaminopropyl) carbodiimide hydrochloride (EDC) and N-hydroxysuccinimide (NHS) obtained from Sigma-Aldrich India was used for activation of carboxylic groups in ZnO–rGO composite. Other chemicals used for preparation of Zobell's solution (potassium hexacyanoferrate(II) trihydrate, potassium hexacyanoferrate(III), potassium chloride), phosphate buffer saline (PBS; potassium phosphate monobasic, sodium phosphate dibasic dihydrate, sodium chloride), and blocking agent (ethanolamine) were of ACS grade, also purchased from Sigma-Aldrich. Indium-coated tin oxide (ITO) substrates were provided by Macwin, India. The target antigen IL8 and its corresponding antibody, i.e., polyclonal IL8 antibody derived from rabbit, were purchased from Bioss, USA.
The physicochemical characterizations were performed using powder x-ray diffractometry (XRD) [model used: Rigaku miniflex 300 containing Cu Kα x-ray source], UV–Visible (UV–Vis) spectrophotometry [model used: Agilent Cary 5000], energy-dispersive x-ray spectroscopy (EDX) [model used: Zeiss EVOMA10], and transmission electron microscopy (TEM) [model used: Tecnai G2 F30 STWIN]. Cyclic voltammetry (CV) and differential pulse voltammetry (DPV) techniques were used to perform electrochemical measurements on PalmSens3 potentiostat in conjugation with a three-electrode system where silver/silver chloride (Ag/AgCl) electrode and Pt-mesh wire, respectively, were used as reference and counter electrodes, while fabricated nanocomposite-based electrodes were applied as working electrodes.
Synthesis of ZnO–rGO nanocomposite
The ZnO–rGO nanocomposite was synthesized from GO and ZnO nanoparticles using the wet chemical route. Firstly, modified Hummer's method reported by Cote et al.[Reference Cote, Kim and Huang15] was applied for the synthesis of highly exfoliated two-dimensional powdered GO. The powdered GO was uniformly dispersed into ethanol through sonication to prepare 1 mg/mL GO solution. Then, ZnO nanoparticles of ~3-5 nm were synthesized using the sol–gel process reported elsewhere[Reference Spanhel and Anderson16] with 0.13 M zinc acetate dihydrate (as Zn2+ ion source) and 0.34 M lithium hydroxide monohydrate (as OH− ions source) solutions prepared in ethanol. Finally, 3 mL of as-synthesized ethanolic dispersion of ZnO nanoparticles was mixed with 50 mL of 1 mg/mL ethanolic solution of GO and stirred overnight at room temperature. The overnight reaction led to the formation of ZnO nanoparticles on defect sites of rGO that was formed during the reaction from GO due to reducing properties of lithium hydroxide monohydrate present in the reaction mixture. The ZnO–rGO nanocomposite solution so obtained was utilized further for bioelectrode preparation.
Fabrication of bioelectrodes and response measurements
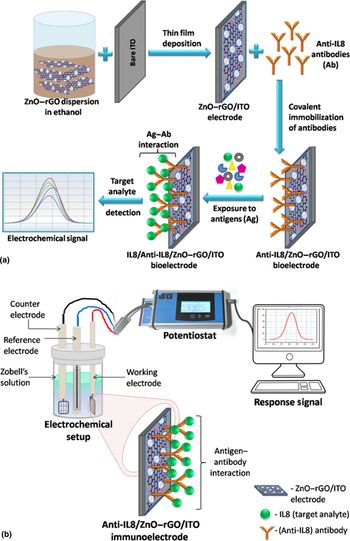
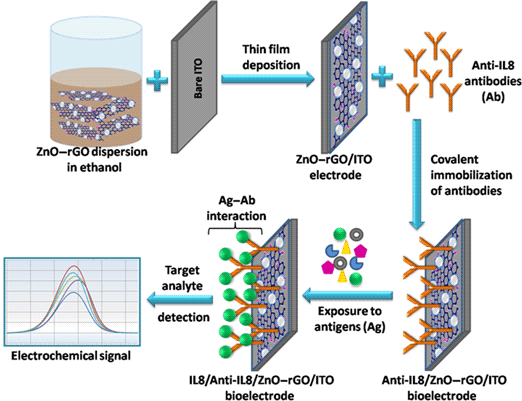
The thin films of ZnO–rGO nanocomposite were deposited onto ITO-coated glass substrates (6 × 15 mm2) using the spin coating technique. Then, 50 µL of 1:1 v/v EDC (0.5 M)–NHS (0.1 M) mixture was dropcasted on the film surface and left undisturbed for 30 min. The electrodes were washed with 50 mM PBS and then treated with 20 µL of 1 µg/mL of IL8 antibodies followed by incubation for 4 h. After the immobilization of antibodies, the films were again washed with PBS and then coated with 1 M ethanolamine to block the unbound active sites on ZnO–rGO surface. The electrochemical activity of the films before and after surface modification was determined using the CV technique. The prepared bioelectrodes (Anti-IL8/ZnO–rGO/ITO) were finally exposed to various concentrations of IL8 antigen for 10 min duration for which the response studies were assessed using the DPV method. The overall fabrication process of Anti-IL8/ZnO–rGO/ITO immunoelectrodes and the electrochemical setup used for conducting the electrochemical studies are demonstrated with the aid of a schematic shown in Fig. 1.
Schematic diagram showing (a) the fabrication process of Anti-IL8/ZnO–rGO/ITO immunosensor and (b) the electrochemical setup applied for recording the electro-analytical measurements of the prepared immunosensor.

Results and discussion
Characterization of ZnO–rGO nanocomposite
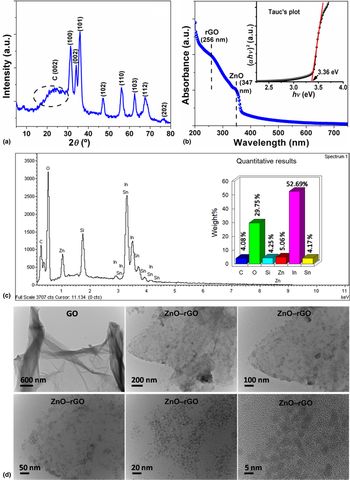
The structural and morphological features of the synthesized ZnO–rGO nanocomposite were investigated using various characterization techniques, i.e., Powder XRD, UV–Vis spectroscopy, EDX and TEM. X-ray diffraction pattern [Fig. 2(a)] of the ZnO–rGO nanocomposite was measured in order to explore its crystal structure. The XRD peaks in the 2θ range 30°–80° exhibited peaks related to (100), (002), (101), (102), (110), (103), (112), (202) planes that matched well with the hexagonal wurtzite structure of ZnO nanoparticles indexed with JCPDS card no. 36-1451.[Reference Chen, Hu, Chang, Wang, Zhang, Yang and Wu17] A broad hump at 2θ ~23.8° was also observed that indicated the formation of rGO in the nanocomposite system.[Reference Tien, Luan, Hoa, Khoa, Hahn, Chung, Shin and Hur18]
(a) Powder XRD pattern and (b) solution-based UV–Vis spectrum of ZnO–rGO nanocomposite. Inset shows Tauc's plot associated with the obtained optical behavior of ZnO–rGO nanocomposite. (c) EDX spectra and bar graph showing the chemical composition of ZnO–rGO nanocomposite film on ITO. (d) TEM images of GO and ZnO–rGO nanocomposite solutions deposited on 200-mesh copper grids.

Figure 2(b) shows the UV–Vis spectrum of the ZnO–rGO nanocomposite that comprised of red-shifted absorption peak related to n–π* (256 nm) transition occurring in rGO along with the characteristic absorption peak of ZnO nanoparticles at 347 nm indicating the conjugation of ZnO nanoparticles with GO.[Reference Wang, Tsuzuki, Tang, Hou, Sun and Wang19] The optical bandgap of ZnO–rGO nanocomposite was determined from the extrapolation of linear portion to the intercept of x-axis in a plot between (αhυ)2 versus energy (eV), i.e., Tauc's plot.[Reference Debanath and Karmarkar20] The prepared nanocomposite showed a smaller bandgap value (i.e., 3.36 eV) in comparison to unbound ZnO nanoparticles (bandgap—3.62 eV) (figure not shown) indicating toward facile charge transfer capability of the composite.
The elemental composition of the prepared nanocomposite was identified by subjecting the thin films of ZnO–rGO on ITO-coated glass (prepared using the spin-coating technique) to EDX analysis. The EDX spectrum [Fig. 2(c)] revealed peaks related to C and Zn belonging to the prepared nanocomposite, while the other peaks denoting In, Sn and Si were coming from the ITO substrate. The high intensity peak for O element was obtained due to contribution from both the nanocomposite and the ITO substrate. The quantitative distribution of these elements is depicted through the bar graph in Fig. 2(c).
The morphology of the ZnO–rGO nanocomposite was viewed at an atomic scale using a panel of TEM images recorded at different scales [Fig. 2(d)]. The TEM image of GO showed crumpled sheet-like structure with high transparency, while the TEM image of ZnO–rGO showed the dense distribution of monodispersed ZnO nanoparticles (~3–5 nm in size) onto the sheets of rGO further confirming the self-assembly of ZnO onto rGO surface.
Electrochemical studies
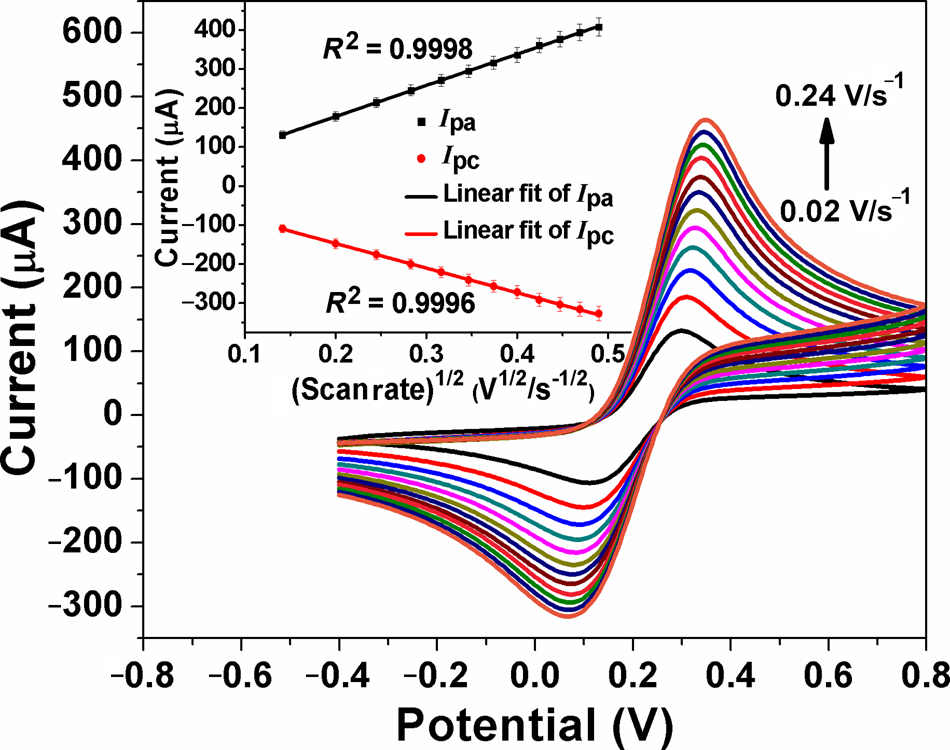
The electrochemical activity of the prepared thin films was evaluated by employing the CV technique for studying the redox reaction of ferro–ferri couple (i.e., Zobell's solution) at varying scan rates (0.02–0.24 V/s) using ZnO–rGO/ITO films as working electrodes [Fig. 3]. The recorded CV curves showed an increase in redox current with increasing scan rates in accordance with the Randles–Sevcik equation [Eq. (1)] that defines a direct relationship between current and square roots of scan rates:
 $$I_{\rm p} = (2.69 \times 10^5) n^{3/2} ACD^{1/2}\nu ^{1/2}$$
where I p is the anodic/cathodic peak current, n is the number of electrons involved in the redox process, A is the active surface area of electrode, C is the molar concentration of the redox species, D is the diffusion coefficient specific to the redox process, and ν is the applied scan rate value.
CV curves recorded at ZnO–rGO/ITO electrode for 3 mM Zobell's solution with varying scan rates. Inset shows the plot of anodic/cathodic peak currents versus square root of scan rates.

The films revealed quasi-reversible electrochemical characteristics as evident from the shift in potential values, E p (a positive shift in oxidation cycle and a negative shift in reduction cycle), corresponding to anodic (I pa) and cathodic (I pc) peak currents with a successive increase in scan rate. The ratio for forward-to-reverse peak currents lying in the range 1 < I pa/I pc < 1.29 additionally verified the occurrence of quasi-reversible electrochemistry at ZnO–rGO/ITO electrode where the rates of electron transfer and mass transfer are comparable.[Reference Wang21] Further, the graph given in Fig. 3 (inset) illustrates the straight line behavior of peak currents (μA) with respect to square root of scan rates (V1/2/s1/2) having correlation coefficient, R 2 = 0.9998 and 0.9996 (<1), suggesting the diffusion-based electron-transport process in the vicinity of the electrode.[Reference Wang21,Reference Bard and Faulkner22]
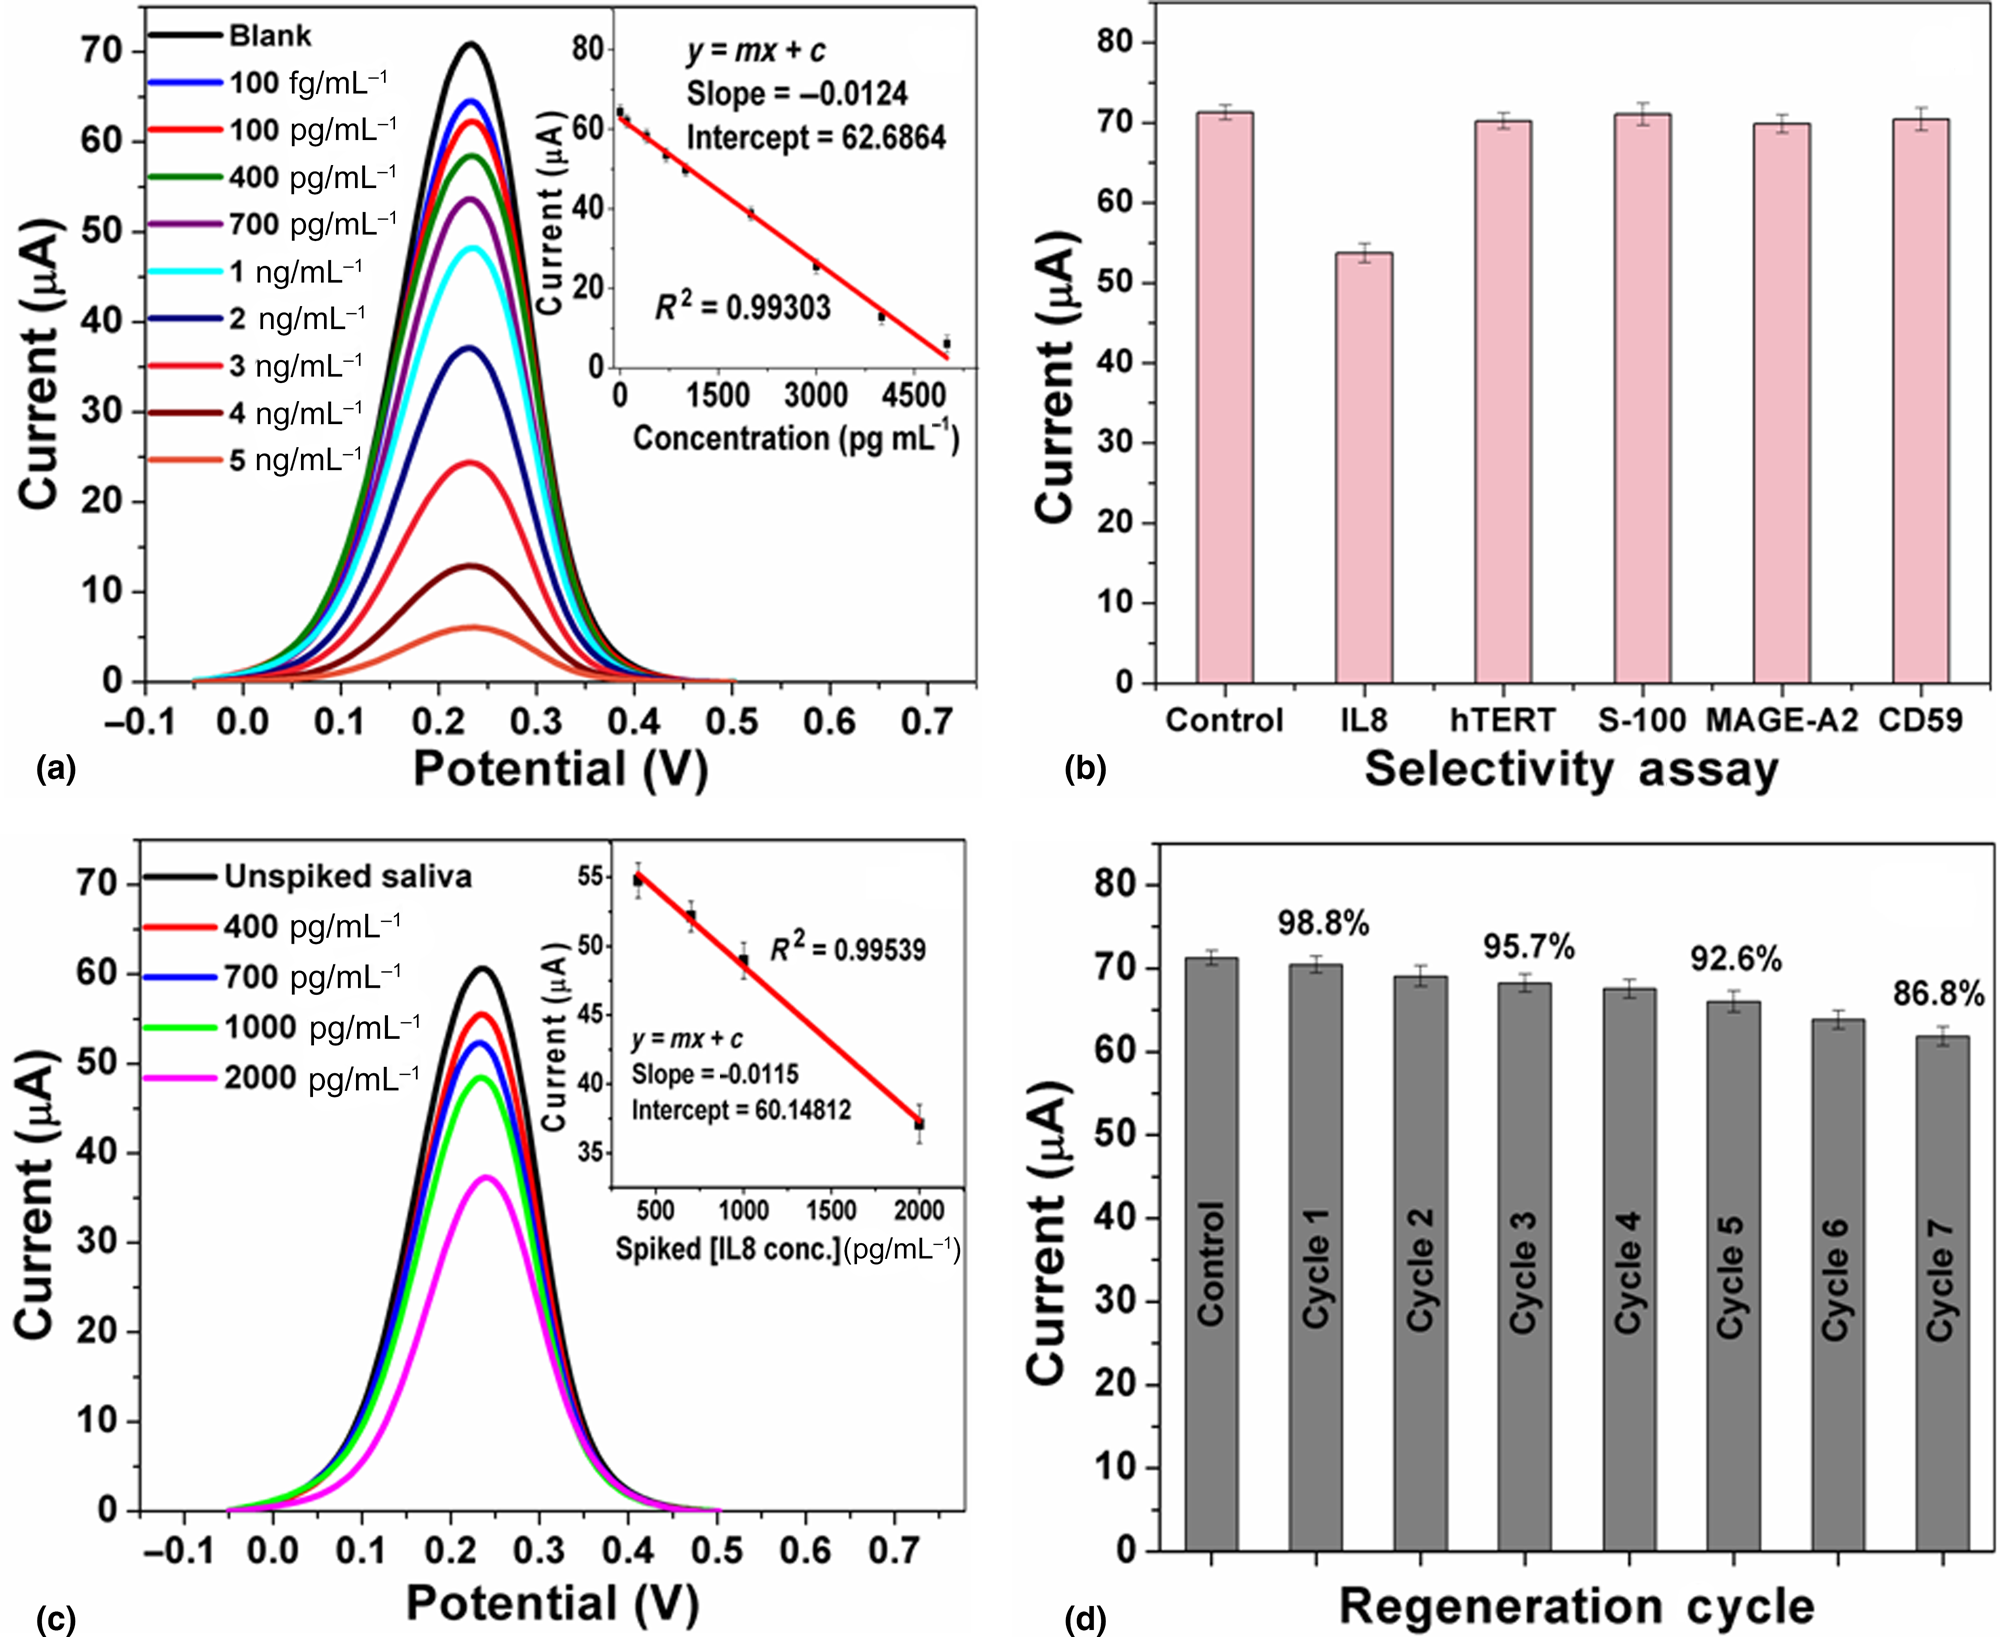
The ZnO–rGO/ITO electrodes were subjected to controlled immobilization process for covalent attachment of Anti-IL8 antibodies on their surface. The successful immobilization of the antibodies on ZnO–rGO/ITO electrodes was determined through FTIR spectroscopic measurements, given in Supplementary Fig. S1(a), that showed peaks related to stretching frequencies of amide C=O and N–H bonds, thus confirming the formation of amide linkage between antibody and the nanocomposite system. The resulting immunoelectrodes, Anti-IL8/ZnO–rGO/ITO, were tested for their response toward IL8 at a concentration range of 100 fg/mL–5 ng/mL using the DPV technique with applied pulse potential 0.02 V and 0.07 s of pulse time [Fig. 4(a)]. DPV curves, recorded to account for the antibody–antigen binding event, showed sharp well-defined oxidation peaks whose current (I p) values decreased with increasing analyte concentrations due to the presence of low conducting protein layer at the electrode interface. The optimal response time of the immunoelectrode toward IL8 was found to be 10 min. A calibration curve between peak current and analyte concentration was constructed [Fig. 4(a) inset], giving a linear response of current signal with the exposed IL8 concentration with the linear regression equation:
 $$I_{\rm p} = -0.01246 \, \lsqb {{\rm IL}8 \,{\rm conc}.} \rsqb + 62.6864,{\rm \;\;} R^2 = 0.99303$$
(a) DPV curves showing the response of Anti-IL8/ZnO–rGO/ITO immunoelectrode toward different concentrations of standard IL8 antigen (prepared in 50 mM PBS) in 3 mM Zobell's solution. Inset shows the corresponding calibration curve between the response current and concentration. (b) Bar graph showing the immunosensor response toward nontarget analytes in comparison with response toward IL8. (c) DPV curves showing the performance of immunosensor toward spiked IL8 concentrations in saliva. Inset shows the calibration plot of current versus concentration obtained for spiked saliva samples. (d) Bar graph illustrating the activity of the immunosensor after seven regeneration cycles.

The sensitivity of Anti-IL8/ZnO–rGO/ITO immunosensor as derived from the slope of the calibration curve was found to be 12.46 ± 0.82 µA mL/ng. The value for the limit of detection (LOD) of the immunosensor was calculated to be 51.53 ± 0.43 pg/mL (n = 3) using the following equation[Reference Verma, Choudhary, Singh, Chandra and Singh23,Reference Jain, Verma, Singh and Sharma24] :
 $${\rm LOD} = k \times \displaystyle{\sigma \over S}$$
where k = 3 corresponding to the confidence level parameter, σ is the standard deviation value for response signals obtained in the absence of an analyte, and S is the slope of the calibration plot which is equal to the sensitivity of the electrode.
Specificity is an important parameter that the immunosensor must exhibit in order to prevent false positives. To ensure the specificity of our fabricated immunosensor, it was exposed to other nontarget biomarker proteins, i.e., hTERT, S-100, MAGE-A2, and CD59, each having concentration of 700 pg/mL [Fig. 4(b)]. It was found that the oxidation peak current value for each of the nonspecific analytes was comparable to the response signal of the blank sample (i.e., control sample not containing any analyte) indicating negligible interference of the nonspecific analytes on the response of the immunosensor due to their noninteraction with the immobilized antibody on the electrode surface. On the other hand, the current decreased significantly when the immunosensor was exposed to the target analyte, i.e., IL8, confirming high specificity of immunosensor toward IL8 antigen. The high sensitivity and specificity exhibited by the immunosensor validates its superior electrochemical performance attributable to the structural defects induced low energy gap in the nanocomposite causing fast electron mobility.
In order to establish the diagnostic capability of the fabricated immunosensor, its performance was investigated in real biological samples. Four different concentrations (400 pg/mL, 700 pg/mL, 1 ng/mL, and 2 ng/mL) of standard IL8 were spiked into the saliva samples (in its undiluted form) collected from healthy volunteers and exposed to the immunosensor for 10 min duration. The response of the immunosensor recorded using a DPV technique [Fig. 4(c)] revealed unhindered detection of the spiked IL8 concentrations with a calibration curve fitting in the given linear regression equation:
 $$I_{\rm p} = -0.01157 \, \lsqb {{\rm IL}8 \, {\rm conc.}} \rsqb + 60.14812,{\rm \; \;} R^2 = 0.99539$$
The sensitivity (11.57 ± 0.72 µA mL/ng) obtained from the calibration curve [Fig. 4(c) inset] in case of saliva samples was quite comparable to that obtained for standard IL8 samples, thus proving the negligible matrix effect on the functioning of the immunoelectrodes. Further, the immunosensor exhibited appreciable recovery values in the range 95%–100%, for all the spiked IL8 concentrations with relative standard deviation (RSD) < 4%, signifying its competency for diagnosis of biological samples.
The regeneration capability of the immunosensor was also determined by subjecting the immunoelectrodes to 30 mM NaOH solution (pH 12) for 90 s to allow breaking of antigen–antibody interaction and then recording the oxidation cycle (n = 3) using the DPV. As evident from the bar graph [Fig. 4(d)] showing the current obtained after each regeneration cycle, the immunosensor retained 98.8% activity after the first regeneration cycle. The activity of the immunosensor then decreased to 95.7% after the third cycle and further down to 92.6% in the fifth cycle. After five regeneration cycles, the biochemical activity reduced significantly, implying that the immunosensor could effectively work for five successive uses.
The stability of the immunosensor was also analyzed by recording its response in triplicate toward 700 pg/mL of IL8 after every 10 days. The obtained results testified reliable performance of the immunosensor for up to 70 days when stored at 4 °C temperature. Repeatability of results is crucially important for the development of a biosensor that could be applied for reliable clinical diagnosis. To evaluate the repeatability of our fabricated immunosensor Anti-IL8/ZnO–rGO/ITO, we have presented the DPV results of 15 sets of measurements for four different concentrations of IL8 (400 pg/mL, 700 pg/mL, 1 ng/mL, and 2 ng/mL) in Supplementary Fig. S3. The overall RSD below 3.2% for all the concentrations of IL8 advocated the high rates of repeatability in the results. However, the little uncertainty recorded in the current values (given in Supplementary Table S1) for each of the exposed IL8 concentrations possibly arises from the non-ambient experimental conditions, open-ended materials processing practices and handling errors during antibody fabrication steps.
Conclusion and future outlook
We have highlighted the successful preparation of a robust immunosensing platform, Anti-IL8/ZnO–rGO/ITO, and its efficiency to detect oral cancer-specific biomarker IL8 in saliva samples. The atomically thin rGO sheets provided a high surface area and an ample amount of carboxylic groups that enabled the covalent attachment of antibodies on its surface. The overall smaller band structure and electronic synergy of rGO and ZnO in the nanocomposite matrix led to the achievement of high sensitivity (12.46 ± 0.82 µA mL/ng) and a LOD value (51.53 ± 0.43 pg/mL) which is 15 times lower than the physiochemical level of IL8 in saliva of oral cancer patients. Additionally, the fabricated immunosensor showed a remarkable response toward IL8 in saliva samples. The results obtained from the designed biosensor are reproducible and serve as a prototype for designing of noninvasive biosensing platform for diagnosis of other cancerous biomarkers through a single- or multianalyte-based detection mode.
Supplementary material
The supplementary material for this article can be found at https://doi.org/10.1557/mrc.2019.138.
Acknowledgments
The authors duly acknowledge support from the Director, CSIR-NPL and CSIR-Network project BSC0112. S.V. is grateful for the funding provided by CSIR (31/01/(0510)/2018-EMR-1) India.