




No CrossRef data available.
A CLUSTER DISTRIBUTION AS A MODEL FOR ESTIMATING HIGH-ORDER-EVENT PROBABILITIES IN POWER SYSTEMS
Published online by Cambridge University Press: 31 August 2005
Abstract
We propose the use of the cluster distribution, derived from a negative binomial probability model, to estimate the probability of high-order events in terms of number of lines outaged within a short time, useful in long-term planning and also in short-term operational defense to such events. We use this model to fit statistical data gathered for a 30-year period for North America. The model is compared to the commonly used Poisson model and the power-law model. Results indicate that the Poisson model underestimates the probability of higher-order events, whereas the power-law model overestimates it. We use the strict chi-square fitness test to compare the fitness of these three models and find that the cluster model is superior to the other two models for the data used in the study.
Information
- Type
- Papers from the 8TH International Conference on Probabilistic Methods Applied to Power Systems (PMAPS). Guest editor: James McCalley, Iowa State University
- Information
- Probability in the Engineering and Informational Sciences , Volume 19 , Issue 4 , October 2005 , pp. 489 - 505
- Copyright
- © 2005 Cambridge University Press
1. INTRODUCTION
This paper presents a discrete probability model for high-order events in electric power systems. By “high order,” we mean events where multiple elements are lost. Such events are relatively rare but often of extremely high consequence. There are at least two applications for this probability model. The first is to estimate rare-event probabilities for the transmission and generation planning process, where capital investments in new facilities must be weighed against the extent to which those facilities reduce risk associated with contingencies. The second is to estimate rare event probabilities in operations, for control-room decision-making. Here, preventive actions, which cost money and are routinely taken in anticipation of N − 1 events, are not reasonable for a rare event, since the certain cost of the preventive action cannot be justified for an event that is so unlikely. A more appropriate strategy for dealing with rare events in operations is to identify, in advance, corrective actions to be taken if the rare event occurs; that is, use computational power to build operational defense procedures to be used, following the occurrence of a rare event, as a decision aid to operators in arresting cascading sequences and mitigating severity. Given that the number of rare events is excessively large, one needs a way to decide, online, “what to compute next” in developing operational defense procedures; that is, one needs to prioritize the rare events for which defense plans are to be developed. The best way to prioritize is by event probability. Some work has been done in [6].
There are three ways to estimate power system rare-event probabilities. The first is to fit an existing probability model to historical data; the second is to use physical attributes of each individual event; the third is to use Monte Carlo simulation with variance reduction. Some work has been done in [4,7]. In this paper, we report on investigations via the first approach. There are also different metrics to use in characterizing power system rare events, including the number of customers interrupted, the power interrupted, the energy not served, and the number of elements lost (N − 1, N − 2,…). We use the latter characterization in our probability model because it better conforms to the planning and operating reliability criteria used in industry. For example, reliability standards performance criteria are often categorized based on the number of elements lost.
In Section 2 we describe three possible probability models: Poisson, negative binomial, and power law. Section 3 develops and describes a specific form of the negative binomial distribution that we call the cluster model. Section 4 uses the maximum likelihood estimation to estimate parameters for the cluster, Poisson, and power-law distributions in describing outage statistics from North American power grid histories over a 30-year period. Section 5 uses a chi-square test to compare the fitness of the three models. Section 6 concludes the paper.
2. THREE PROBABILITY MODELS FOR RARE EVENTS
We introduce three probability models in this section, each of which is used in Section 4 to fit outage statistics data.
2.1. Poisson Distribution
We develop the Poisson distribution in a traditional way here. Consider the event of an individual line tripping within a fixed time period by a binary random variable T, such that T ∈ {0.1}, with T = 1 representing line tripping and Pr(T = 1) = p. The probability of tripping of each line follows a Bernoulli distribution according to

Suppose that the total number of lines in a power system is N. Each line has the same probability p to be tripped within a fixed time period, and each trip event is independent of any other one. Define M as the total number of lines removed from the power system during the time period. The probability distribution of M is binomial, according to

where k = 0,1,2,3,…,N and p = Pr(T = 1). Usually, p is small and N is large, in which case, k ≥ 1 becomes a rare event and can be approximated by the Poisson distribution [8]; that is,

where λ = np, k = 0,1,2,3,…,∞. The Poisson distribution is sometimes called the distribution of rare events [8]. Both the binomial distribution and Poisson distribution assume that the element events (the failure of a individual) are independent; that is, the failure of one part of the system does not affect the failure probability of another component. This is a significant weakness of the Poisson distribution when using it to characterize rare-event probabilities for power systems.
2.2. Negative Binomial Distribution
Another family of discrete distributions is the negative binomial distribution models. We present this distribution because we are going to suggest a form of this distribution as our probability model for number of lost components. In contrast to the binomial distribution, where we count the number of successes after doing a predefined number of Bernoulli tests, the negative binomial distribution counts the total number of tests to get a predefined number of successes (M). Suppose T is the random variable that represents the number of failures before a predefined number of successes (M) are observed in a sequence of Bernoulli tests, then the distribution of T is

The distribution is called negative binomial (M,p). The range of M here can be extended to include real numbers, a feature we use in the model introduced in Section 3.
2.3. Power-Law Distribution [2,3,4,7]
A random variable X that follows a power law has a normalized distribution as follows:

where p is a constant and X can either be a continuous variable or a discrete variable. If x is a discrete variable, the denominator is replaced by [sum ] x−p. Expression (5) is a proper probability density function (p.d.f.) if the sample space is limited to a finite region, since, in this case, its integral over the entire probability space is 1.0. If the sample space is infinite, 0 < x < ∞, p must be greater than 1.0 to be a proper p.d.f. and p has to be greater than 2, so that the mean of X is bounded. If we draw the relationship of P(X = x) and x on a log-log plot, we find a straight line with slope −p/∫x−p dx; that is,

This feature is unique to power-law distribution among the many other p.d.f.s that model rare-event probability. For example, if we draw the relationship P(X = x) and x on a log-log plot, the Possion distribution is a concave curve, which means that the probability of large events decreases faster.
3. CLUSTER MODEL FOR HIGH-ORDER TRANSMISSION OUTAGES
Students who do not know each other while in a library tend to avoid one another by choosing regularly spaced positions; but if some students are acquaintances, they tend to sit together. People in an elevator behave similarly. Molecules in a room repel each other, filling the room uniformly; however, bacteria on a plate reproduce themselves and tend to form colonies or “clusters.” Likewise, insects distribute eggs in a fashion that avoids placing too many eggs in one place [10].
The main theme in this paper is that loss of elements in power systems exhibit clustering phenomena; that is, the loss of one element immediately raises the likelihood of losing another element, which has a similar effect, and so on. A fault and the ensuing relay trip of one component causes transient oscillation throughout the power system and may cause other protection devices to operate. The forced outage of one generator or line changes the network flow pattern, and some circuits, being more loaded, may trip either by proper or unintended protection operation. The more severe the first event, the more likely an additional event will follow. This tendency is captured statistically using the “cluster” probability distribution, derived from the negative binomial distribution. We will develop the cluster distribution here and, in the process, show that the Poisson distribution may be derived from it as well. This development is quite different from what is typically found in most texts; it was first presented in Thompson's monograph [10].
The negative binomial distribution can be derived for the case of n balls being placed into m cells consecutively so that the probability of transition from occupancy numbers (r1,r2,…,rm) with [sum ]ri = r to (r1,…,ri + 1,…,rm), which is the same as the probability that the (r + 1)st ball falls in the ith cell, is (α·ri + 1)/(α·r + m). When α > 0, the transition probability is a function of how the previous r balls that are already in the cells are located; the more balls in a cell, the more likely the next ball will fall into the cell. The element events (the action of placing a ball) becomes no longer independent; the succeeding event is dependent on what previously occurred. When α > 0 with n → ∞, m → ∞, and n/m = λ, the distribution of number of balls (K) in any cell follows a negative binomial distribution with parameters M = α−1 and p = λ/(λ + α−1), where M and p are defined in (3); that is,

where k = 0,1,2,….
We may see that when α = 0, there is no dependence of ball placement probability on the way previous balls were placed, and the transition probability is just p = 1/m. The distribution of the number of balls (K) in any of the cells is just like the case of the binomial distribution with parameters p and n. The limiting distribution of K with n → ∞, m → ∞, and n/m = λ is Poisson(λ). If we let α → 0, the Poisson distribution is derived as follows:

Here, the number (N) of circuits tripped in each event must be greater than one. We reparameterize (7) by Y = X + 1 so that the sample space of random variables is {1,2,3,…}. This is necessary because the sample space of contingencies contained in our dataset does not include the event k = 0 (loss of no elements). We also reparameterize λ by μ = λ + 1 so that E(Y) = μ still holds as E(X) = λ in (7). We use the notation Cluster(Y = y|μ,α) to represent the new reparameterized distribution, defined as

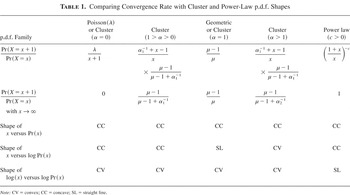
We call α the affinity factor. This value captures the tendency of the power system to have a cascading event, as we will show later in the paper. To compare the shapes of Cluster p.d.f.s having different α's with the power-law p.d.f., Table 1 summarizes convergence rates when the random variable (an index representing the size of contingencies) approaches infinity.
Comparing Convergence Rate with Cluster and Power-Law p.d.f. Shapes

From Table 1, we see that when x → ∞ (i.e., when events became large or “rare”), we have

which means that the relation between the different probability models, in terms of convergence rate for rare events, is

The convergence rate is actually an index representing the heaviness of the p.d.f.'s tail, or the likelihood of rare events. The higher the convergence rate, the less likely a rare event occurs. For the Poisson distribution, since it assumes the independence of events, it converges faster than any of the five distributions described in Table 1. The convergence rate of the cluster distribution depends on α, which is just a parameter showing the interdependency of events, or the tendency of clustering. The larger the α, the slower the convergence and the heavier the tail of the cluster distribution.
4. CLUSTER MODEL APPLIED TO OUTAGE STATISTICS
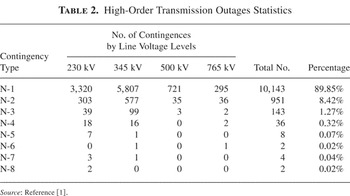
The data we analyzed include the total number of elements lost in each contingency in North America from 1965 to 1985 [1], as indicated in Table 2. The last two columns give a summary by voltage level. According to [1], the data reported in Table 2 adhere to the following:
- Each individual component tripping in a multicomponent outage event must occur within a 1-min interval; otherwise, it is considered a separate outage event.
- Whenever an event involves components of different voltage levels, it will be counted as one instance only with a specific voltage level.
High-Order Transmission Outages Statistics

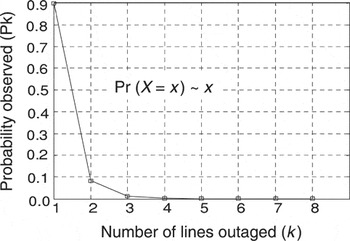
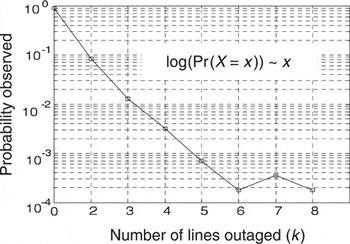
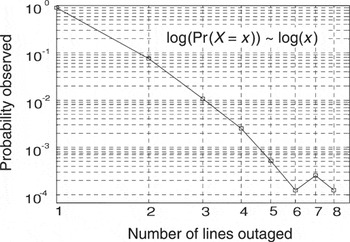
We draw the relationship of Pr(X = x) versus x in Figures 1, 2, and 3. The shapes (concave or convex) of Figures 1, 2, and 3 match the cluster model in the third column of Table 1, which suggests that a cluster model with 1 > α > 0 could be better than others.

Pr(k) versus k.

log{Pr(k)} versus k.

log{Pr(k)} versus log(k).
4.1. Maximum Likelihood Estimation
We fit the three probability models Poisson, cluster, and power law to the data in Table 2. We use the maximum likelihood estimation (MLE) to estimate the parameter(s) for each model. In MLE [5], if (X1,X2,X3,…,Xn) are one independent identical sample from the space X with probability distribution function f (x|θ1,θ2,…,θm), where the θi's are the model parameters to be estimated, the joint p.d.f. is

The ML approach defines a likelihood function

which is equal to the joint p.d.f. but switches the parameters and variables; that is, it takes the sample value (x1,x2,…,xn) as parameters and (θ1,θ2,…,θm) as variables. If we transform (12) by taking the logarithm of both sides, then we get the following log likelihood equation:

Define θ = (θ1,θ2,…,θm) and x = (x1,x2,…,xn). The

that maximizes L(θ|x) is called an MLE of the parameter θ. It should be noted that

must be a global maxima. Because it is easier to find the maxima of (13) than that of (12) by differentiation, we use the log likelihood function.
4.2. Estimating the Parameters of the Poisson Distribution
If we assume that our data follow a Poisson distribution, then only parameter λ needs be estimated. The Poisson distribution is a special case of the negative binomial in the form of (7), where α = 0 indicates that Poisson has no clustering. Suppose we observe Nk samples of K = k from the Poisson(λ) such as in (3) and the sample space of K is {0,1,2,3,…}. The likelihood function is

In order to find the value of λ(N1,N2,…) that maximizes log{L(λ|N1,N2,…,Nk,…)}, we need to solve

Substitution of (14) in (15) results in (16), the MLE of λ:

which is the sample average. Recalling that the sample space of the standard Poisson distribution is {0,1,2,3,…} and the range of the data we have is {1, 2, 3, 4, 5, 6, 7, 8}, which does not contain zero, the MLE of

is

The estimated distribution is (18), where k = 1,2,3,…:

4.3. Estimating the Parameters of the Cluster Model
For the cluster model, we will deduce the MLE of λ and α. We consider only α > 0, since if α = 0, the cluster distribution is Poisson. The cluster distribution is given as

for y = 1,2,3,…. Given Nk samples for each K, the likelihood function is

To find the candidate pair

that maximizes the function log L(α,μ|N1,N2,…,NK,…), we need to solve the following:

These two equations are far more complex than (15). However, we can still solve for

. Substituting (20) in (21), we get a closed-form solution for

, the same formula as that for Poisson:

However, we have difficulty in finding a closed-form solution for

. We will search for the maxima pair

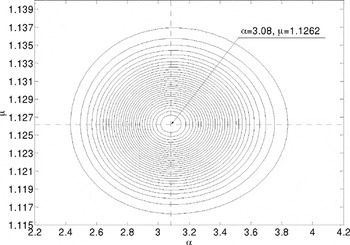
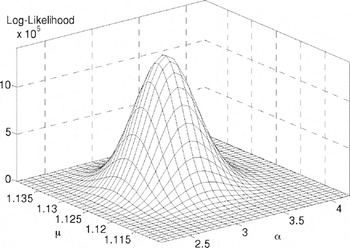
for log(L(α,μ|N1,N2,…,Nk,…)) directly using the contour graph function in Matlab. It is much easier to understand this case with the aid of graphs. Substituting the k's and the Nk's into the likelihood function of (20), we get the graphs of the likelihood function log(L(α,μ|N1,N2,…,Nk,…)), as Figures 4 and 5. The MLE of α and μ are approximately


Contour plot of maximum likelihood function (20).

Mesh plot of maximum likelihood function (20).
We can also get the estimate of μ directly, using (22):

This is very close to our estimate of μ from the contour plot in Figure 4, which is evidence of the correctness of our method.
4.4. Estimating the Parameters for the Power-Law Distribution
The likelihood function for the power-law distribution is

Like

in the cluster model, we cannot get a closed-form solution for

since the following cannot be solved analytically:

Because we have only one parameter to estimate, it is easier to find

than the

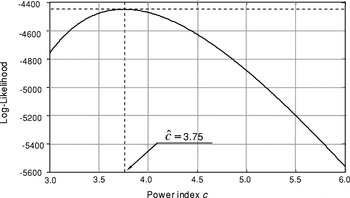
pair for the cluster model. In order to estimate the power-law parameter (as described in Section 1), we use the least square curve fitting to estimate the approximate range of the slope −p/∫x−p dx. It is around 4.0. We draw the likelihood function (26) with p ranging from 3 to 6, and then we obtain the plot in Figure 6. Using the bisection method to search the maximum, we find

. Then the estimated power-law p.d.f. for the data in the last two columns of Table 2 is


Plot of maximum likelihood function (26).
The three distributions are summarized below, where x ∈ {1,2,3,…} for all the three models.

for the cluster model;

for the Poisson model;

for the power-law model.
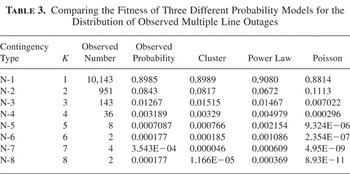
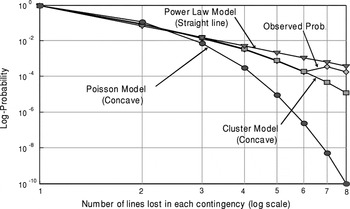
Evaluating the above three expressions for k = {1,2,3,4,5,6,7,8}, we obtain the results shown in Table 3. These results are plotted in Figure 7.
Comparing the Fitness of Three Different Probability Models for the Distribution of Observed Multiple Line Outages


The log-log plot of p.d.f.s in (28)–(30).
By inspecting Figure 7, one concludes that the cluster model (the curve with squares) is superior to the other two models, as it fits almost perfectly for k = 1,…,7. The cluster model and the power-law model agree for k = 8, for which there are almost no data. The power-law model overestimates the probability of large contingencies. The concave curve generated by the Poisson model deviates heavily from the observed data, underestimating the probability of large events (k > 3) by a factor of 10−5.
5. FITNESS TEST OF THREE DIFFERENT PROBABILITY MODELS
Figure 7 provides qualitative evidence that the cluster model fits the data better than either the Poisson model or the power-law model. In this section, we use the chi-square test to provide quantitative evidence. The chi-square test, based on the Pearson theorem [9], is widely used in statistics to test the fitness of a probability model to sample data. Suppose a certain random trial has k possible outcomes, the probability that each trial results in the ith outcome is pi, i = 1,2,3,…,k, where [sum ] pi = 1. If we perform n trials and the ith outcome results Ni times, then the multivariate distribution of Ni is

with

.
Pearson Theorem: Suppose the parameters of a polynomial distribution has the p.d.f. as in (31) and define

then when n → ∞, χ2 follows the chi-square distribution χ2(k − 1).
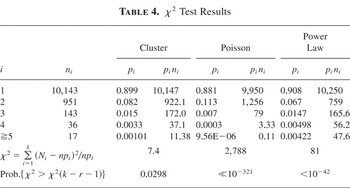
We can see from (32) that the statistic χ2 is an index showing how much the samples deviate from the polynomial distribution to be tested. The larger the statistics χ2, the larger the deviation. In order to apply the Pearson theorem, we need to convert the distribution we are going to test into a polynomial distribution. Since the sample space of the three distributions we are going to test is (1,2,3,…) and it is an infinite set, we separate the sample space into k exclusive sets denoted as Si = 1,2,3,…,k. Suppose X is a random variable and its p.d.f. is f (x) = Pr(X = x),x ∈ {1,2,3,…}. We draw a total of n samples of X from p.d.f. f (x) and count the number (denoted again as Ni) of samples that are members of the set Si. Denote pi = Pr(X ∈ Si). Then the random variables Ni, i = 1,2,…,k, follow the polynomial distribution of (31). The statistics χ2 defined in (32) follow the χ2(k − 1) distribution. If χ2 is too large, we have reason to doubt the fitness of our model with respect to the data. For this test, we decompose the sample space into five exclusive sets: S1 = {1}, S2 = {2}, S3 = {3}, S4 = {4}, and S5 = {5}. The reason we group this way is that for all Si and all test models (i.e., Poisson, cluster, and power law), P(X ∈ Si) × Ni (where Ni is the number of samples that fall in set Si) is greater than 5, which is suggested for the credibility of the fitness test.
The Pearson theorem assumes that all parameters for the distribution to be tested are known. If there is any parameter that is unknown so that pi's are estimates, we need to reduce the freedom number of the χ2 distribution by one for each estimated parameter. The rule is: If there are a total of r estimated parameters, the freedom number of the χ2 distribution is k − r − 1. For the Poisson model, the parameter λ is an estimate, so the chi-square distribution has freedom number 5 − 1 − 1 = 3. For the cluster model, α and μ are estimates, so the freedom number is 2. For the power-law model, the power index p is estimated, so the freedom number is 3. The test result is summarized in Table 4. The last row of Table 4 lists the probability of getting a sample deviation larger than observed, assuming that the sample comes from a certain probability model. The cluster model is far more fit than the other two.
χ2 Test Results

6. CONCLUSION
This paper proposes the cluster model for computing probabilities associated with high-order events. This model is very appealing because it provides the ability, through the affinity factor α, to capture the tendency of component outages in power systems to increase the likelihood of successive component outages, through, for example, cascading phenomenon, so that they cluster. We have shown that the cluster model is actually a quite general model, with the familiar Poisson (complete independence between events) being a specific instance of it, where α = 0. When α is very large, the power-law and the cluster models both exhibit similar behavior in convergence speed as the event becomes very large. In our application to real data, we observed that the Poisson model underestimates rare-event probabilities, the power-law model overestimates them, and the cluster model captures them very well. This observation was confirmed using a statistical test of model fitness. The results of this work will enhance decision-making at both the planning and operational levels. In particular, operational procedures for defending against large outages are of great interest to us, and the cluster model is a promising aid in directing computational resources, as they are used online to develop defense strategies as real-time conditions change. Work to this effect has been submitted for publication.
References
REFERENCES
Adler, R.,
Daniel, S.,
Heising, C.,
Lauby, M.,
Ludorf, R., &
White, T.
(1994).
An IEEE survey of US and Canadian overhead transmission outages at
230 kV and above.
IEEE Transactions on Power Delivery
9(1):
21–39.Google Scholar
Bak, P.
(1996).
How nature works.
New York:
Springer-Verlag.
Bak, P.,
Tang, C., &
Wiesenfeld, K.
(1987).
Self-organized criticality: An explanation of 1/f noise.
Physical Review Letters
59:
381–384.Google Scholar
Carreras, B.,
Newman, D.,
Dobson, I., &
Poole, A.
(2000).
Initial evidence for self-organized criticality in electric power
system blackouts.
Proceedings of the 33rd Annual Hawaii International Conference on
System Sciences, pp.
1411–1416.
Casella, G. &
Berger, R.
(2002).
Statistical inference.
New York:
Wadsworth.
Chen, Q. &
McCalley, J.
(2005).
Identifying high-risk N − k contingencies
for on-line security assessment.
IEEE Transactions on Power Systems
20(2):
823–834.Google Scholar
Dobson, I.,
Chen, J.,
Thorp, J.,
Carreras, B., &
Newman, D.
(2002).
Examining criticality of blackouts in power system models with
cascading events.
Proceedings of the 35th Annual Hawaii International Conference on
System Sciences, pp.
803–812.
Falk, M.,
Husler, J., &
Reiss, R.
(1994).
Laws of small numbers: Extremes and rare events.
Basel:
Birkhauser-Verlag, p.
4.
Pearson, K.
(1900).
On the criterion that a given system of deviations from the probable
in the case of a correlated system of variables is such that it can be
reasonably supposed to have arisen from random sampling.
Philosophy Magazine
50:
157–172.Google Scholar
Thompson, W.A., Jr.
(1988).
Point process models with applications to safety and
reliability.
London:
Chapman & Hall.
Comparing Convergence Rate with Cluster and Power-Law p.d.f. Shapes
High-Order Transmission Outages Statistics
Pr(k) versus k.
log{Pr(k)} versus k.
log{Pr(k)} versus log(k).
Contour plot of maximum likelihood function (20).
Mesh plot of maximum likelihood function (20).
Plot of maximum likelihood function (26).
Comparing the Fitness of Three Different Probability Models for the Distribution of Observed Multiple Line Outages
The log-log plot of p.d.f.s in (28)–(30).
χ2 Test Results
 You have
Access
- 6
- Cited by