I. INTRODUCTION
Since the semiconductor photocatalysis has held great promise as an effective and potential catalyst for degrading organic pollutants, the application of BiOX-based materials in environmental regeneration has attracted increasing attention.Reference Kongmark, Coulter, Cristol, Rubbens, Pirovano, Löfberg, Sankar, Beek, Richard and Vannier1,Reference He, Xie, Luo, Wen, Ma, Lin, Fang and Zhang2 Because of its low bandwidth (1.63–1.94 eV), layered structure, and good response to visible light, a germanium oxyhalide semiconductor with unique electrical and optical characteristics, BiOI, had been mightily investigated in the field of photocatalysis. And it was the best responder to visible light in the four halogenated mixed oxides. However, due to the sluggish charge transfer rate of single BiOI and efficient vector recombination, its photocatalytic activity was greatly limited.Reference Wang, Fang, Tang, Zhang, Huang, Liu and Wu3–Reference Wu, Li, Liu and Zhang5 To overcome these shortcomings, people used BiOI for further coupling with TiO2, BiPO4, and CH3COO (BiO) to form a composite.Reference Zhang, Zhang, Xie and Wang6–Reference Liu, Chen, Xu, Zhang and Shen8 However, the photocatalytic activity of BiOI has been greatly limited by its slow charge transfer rate and high carrier reorganization efficiency. To overcome these shortcomings, people used BiOI for further coupling with TiO2, BiPO4, CH3COO (BiO), etc. to form a composite material.
Bi2MoO6 is a material with a layered structure with excellent response to visible light.Reference Zhang, Shao, Zhang, Su, Zhang, Liang, Sun and Liu9,Reference Ichiro, Yutaka, Teppei and Takahiro10 It can effectively degrade a large variety of organic dyes under visible light.Reference Zhang, Shao, Mu, Zhang, Guo, Zhang and Liu11,Reference Ismail, Ng, Ahmadi, Razak and Lockman12 Bi2MoO6 is nontoxic and bright in color, so it can be used in producing environmentally friendly coatings for exterior air purification in furniture and glass.Reference Han, Yang, Wang, Shen, Wang, Zhu and Jiang13,Reference He, Xie, Luo, Wen, Ma, Lin, Fang and Zhang14 Bi2MoO6 is also commonly used as a modified material for the preparation of high-efficiency photocatalysts in many composite materials, such as Bi2MoO6/TiO2,Reference Li, Liu, Sun and Pan15 Bi2MoO6/Ag,Reference Meng and Zhang16 BiOBr/Bi2MoO6,Reference Wang, Yang, Zhang, Ding, Yang, Dai and Chen17 and so on.
This work means to exploit Bi2MoO6 modification ability and BiOI dramatic visible light absorption ability, thereby obtaining an efficient visible light photocatalyst with powerful mineralization capabilities.Reference Sharma, Taiwade and Vashishtha18,Reference Song, Li, Van, Liu, Qi, Huang, Chu and Duan19 The Bi2MoO6/BiOI composite photocatalyst was synthesized by hydrothermal synthesis. The effects of different Bi/Mo molar ratios on the composition, morphology and photocatalytic properties of Bi2MoO6/BiOI composite photocatalyst was investigated systematically. The composites’ photocatalytic properties were appraised by the degradation of Rhodamine B. The experimental results show that the phase composition of the composite materials is different when Bi:Mo is different, and the photocatalytic properties are also different.
II. EXPERIMENTAL
A. Synthesis of materials
KI, MoS2, Bi(NO3)3·5H2O, anhydrous ethanol, and Rhodamine B, and all other chemicals used in this experiment were analytic grade reagents. BiOI preparation: BiOI was synthesized through a hydrothermal process. 0.4851 g Bi(NO3)3·5H2O as well as 0.166 g KI (placed in a 50 mL Teflon liner) were dissolved in 17 mL distilled water, respectively, and magnetically stirred for 20 min. Then Bi(NO3)3 solution was added into KI solution slowly, the color of the reaction solution gradually changed from black to brick-red, and the solution was stirred for 30 min. The Teflon liner was sealed in a stainless steel autoclave and maintained at 150 °C for 24 h and cooled to room temperature naturally. All the samples were obtained through centrifuging, washing with deionized water three times, absolute ethanol twice, and drying at 60 °C for 24 h to obtain a brick-red BiOI powder.
Synthesis of composite materials: A certain amount of KI (0.0104 g, 0.0259 g, 0.0519 g, 0.2074 g), which was placed in a 50 mL Teflon liner, were dissolved in 17 mL distilled water. 0.05 g MoS2 was added to KI solution and stirred magnetically for 20 min. A certain amount of Bi(NO3)3·5H2O (0.0303 g, 0.0259 g, 0.0519 g, 0.2074 g) were dissolved in 17 mL distilled water (Bi:I = 1:1). The color of the solution was changed from black to brick-red with the Bi-suspension addition into the mixture of MoS2 and KI slowly and magnetically stirred for 30 min. The Teflon liner was sealed in a stainless steel autoclave and maintained at 150 °C for 24 h. The autoclave was cooled to room temperature naturally. The composite materials were obtained by centrifuging, washing with deionized water and absolute ethanol several times, and drying at 60 °C for 24 h. In this way, composite materials with a molar ratio of Bi:Mo = 1:5, 1:2, 1:1, and 4:1 were prepared.
B. Characterization
The morphologies of the samples were inspected with a scanning electron microscope (SEM) image by a JSM-6390LA SEM (JEOL, Tokyo, Japan) and manipulated at a quickening generator voltage of 15 kV. The X-ray diffraction (XRD) was performed on the X-raydiffractometer (PANalytical, Almelo, the Netherlands) at 40 kV and 40 mA with the scanning slit of 1/16–1/8. The infrared spectrum (IR) of the samples (potassium bromide tablet) was measured by using the Nicolet S10 spectrometer developed by Thermo Fisher Scientific (Waltham, Massachusetts). The samples’ degree of reflectance to light was measured by using an Evolution 220 UV-Vis spectrophotometer (Shimadzu, Kyoto, Japan).
C. Photocatalytic performance test
The photocatalytic activities were evaluated by the degradation the colored model compound of the organic pollutant (RhB) under visible light irradiation by using the XPA series of photoreaction instruments (Xujiang Electromechanical Plant, Nanjing, China). Specifically, the light source consisted of a 350-W xenon lamp, the concentration of RhB was 2 × 10⁻⁵ mol/L, and tap water was passed through the glass cover between the light source and the reaction liquid to cool the reaction solution. 10 mg prepared sample and 10 mL of RhB solution were added to the quartz tube successively. The quartz tube was placed in a photoreactor and stirred for 30 min under the condition of darkness. The lamp was turned on until the adsorption–desorption was attached to the balance. The longer the light time, the lighter the reaction liquid, until one of the lights becomes lightest and no longer fades. After the reaction fluid was centrifuged, the absorbance of the supernatant was measured by using a UV-2550 ultraviolet spectrophotometer developed by Shimadzu, as well as the degradation ability of the supernatant was judged by the value of the supernatant absorbance.
III. RESULTS AND DISCUSSION
A. XRD analysis
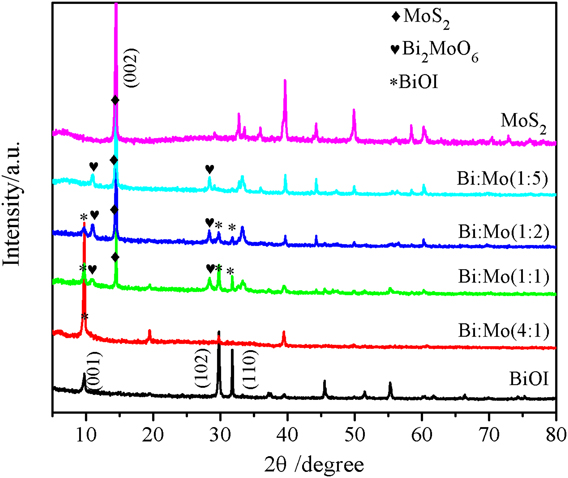
XRD patterns in Fig. 1 show the synthesized MoS2, BiOI, and composites with different molar rates of Bi:Mo. The pure MoS2 and BiOI diffraction peaks correspond to the standard hexagonal MoS2 (JCPDS No. 65-7025) and BiOI (JCPDS No. 10-0445),Reference Cao, Xu, Luo, Lin and Chen20 respectively. The intensity of diffraction peaks of the (002) crystal surface in the MoS2 gradually decreased with increasing the amount of bismuth. Bi2MoO6/BiOI (Bi:Mo = 1:5) exhibited the diffraction peaks of (020) and (131) facets at 2θ = 10.8° and 28.3°, which may be referenced to the tetragonal Bi2MoO6 phase (PDF 21-0102). The peaks for Bi2MoO6, BiOI, and MoS2 were detected at Bi:Mo = 1:1, and the diffraction peak of BiOI increased. When Bi:Mo was increased to 4:1, the peaks of BiOI were the only one which could be found in XRD. Although peaks belong to MoS2 or even Bi2S3 do not show in the XRD pattern of Bi:Mo = 4:1, it does not mean that they are absent in the 4:1 products. They could be amorphous. It needs to be further proved by other testing methods.Reference Li, Li, Chen, Jia, Dong, Hu, Shang and Zhang21–Reference Li, Yu, Low, Fang, Xiao and Chen23
XRD pattern of MoS2, BiOI, and composites with different molar ratios of Bi:Mo.

B. FT-IR analysis
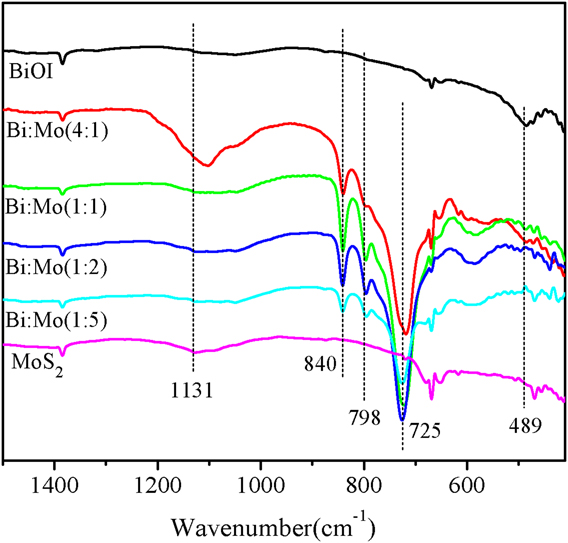
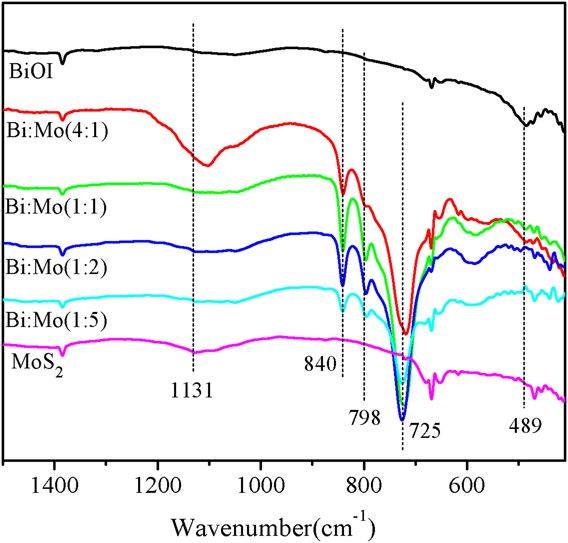
The IR spectrum in Fig. 2 shows the sample in the 1500–400 cm−1 region. The characteristic Bi–O bond absorption peak appeared at 489 cm−1 when Bi:Mo reached 1:1. The four composites have obvious characteristic absorption peaks at 725, 798, and 840 cm−1. The characteristic absorption peak in this range corresponded to the stretching vibration Mo–O bond peak in Bi2MoO6. The Mo-O bond characteristic absorption peak emerged in composite material (Bi:Mo = 4:1). It is proved that Bi2MoO6 is included in the composite, which is a composite of Bi2MoO6 and BiOI. The characteristic absorption peak of the Mo–S bond was in 1131 cm−1, and the absorption peak disappeared when Bi:Mo was increased to 4:1. The following conclusions could be drawn by combining XRD with IR. When Bi:Mo = 1:5, the composites were Bi2MoO6/MoS2. When Bi:Mo = 1:2 and 1:1, the composites were Bi2MoO6/BiOI/MoS2. When Bi:Mo = 4:1, the composites were Bi2MoO6/BiOI.
FT-IR spectrum of as-prepared samples.
C. SEM analysis
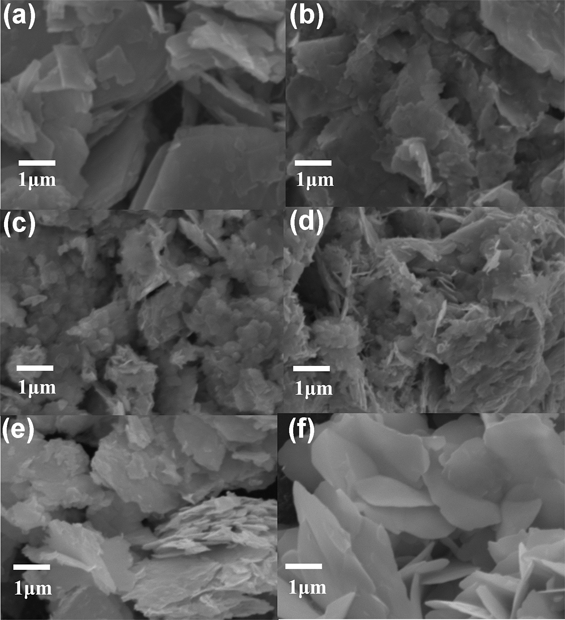
As shown in the SEM images of pure MoS2 [Fig. 3(a)], MoS2 is a blocky surface with a layered structure. Figures 3(b)–3(e) are the morphological images of the composites with 1:5, 1:2, 1:1, and 4:1 of Bi:Mo, respectively. The surface of the block structure was no longer smooth, and the surface began to appear as fragments. With the amount of Bi(NO3)3·5H2O and KI increased, the number of fragments had also increased and block structures had become smaller. The topography of the material was changed to an irregular patch of small particles and a thin layer appears on the surface when Bi:Mo reaches 1:1. When the Bi:Mo reached 4:1, the distance of layer-to-layer became more noticeable, and the composites are irregularly stacked like loose slabs. Figure 3(f) is the SEM image of BiOI. The pure BiOI is a smooth sheet with a thickness of about 80 nm.
SEM images of (a) MoS2; (b) Bi:Mo(1:5); (c) Bi:Mo(1:2); (d) Bi:Mo(1:1); (e) Bi:Mo(4:1); (f) BiOI.

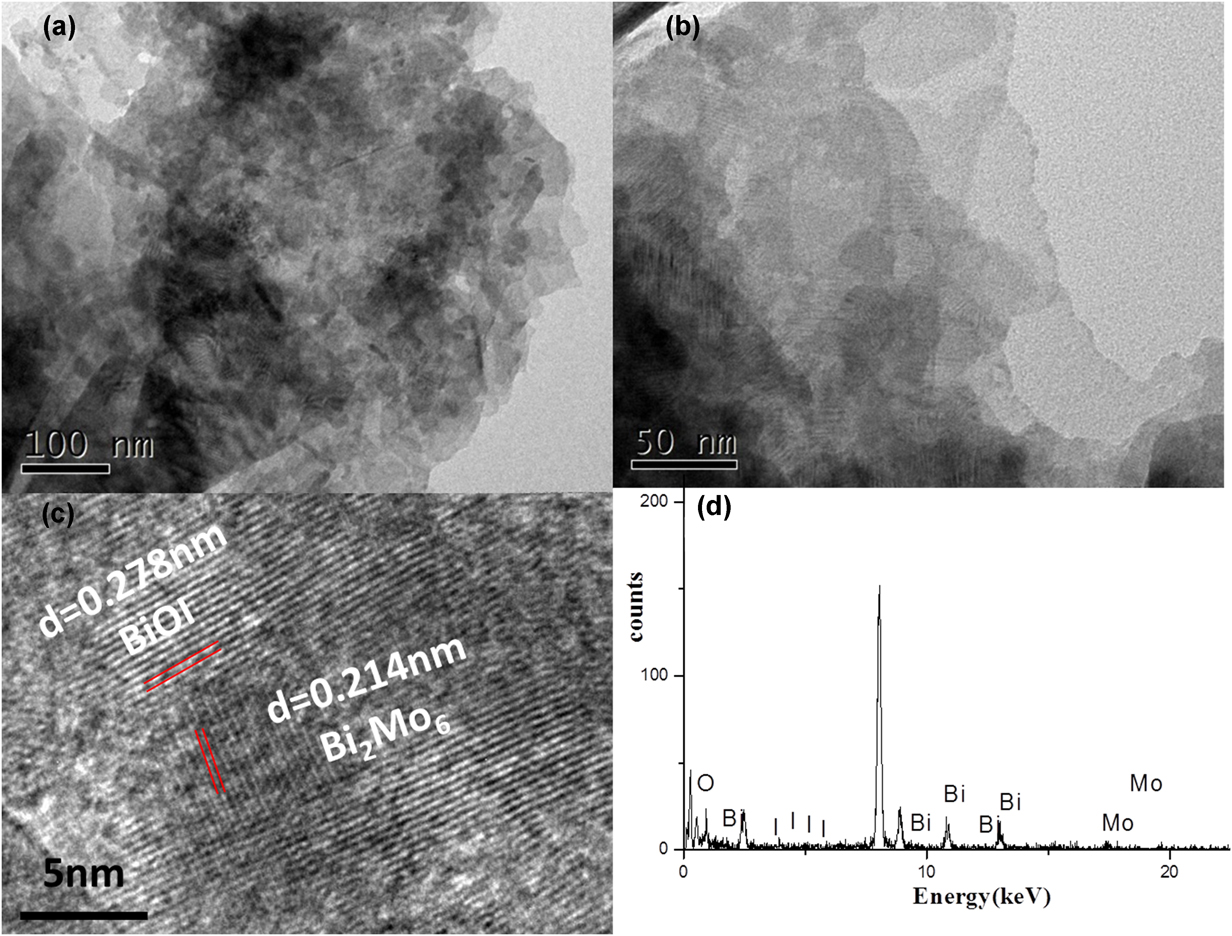
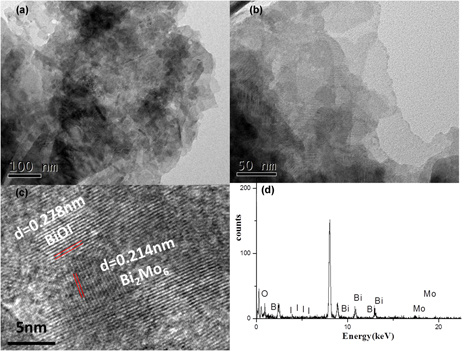
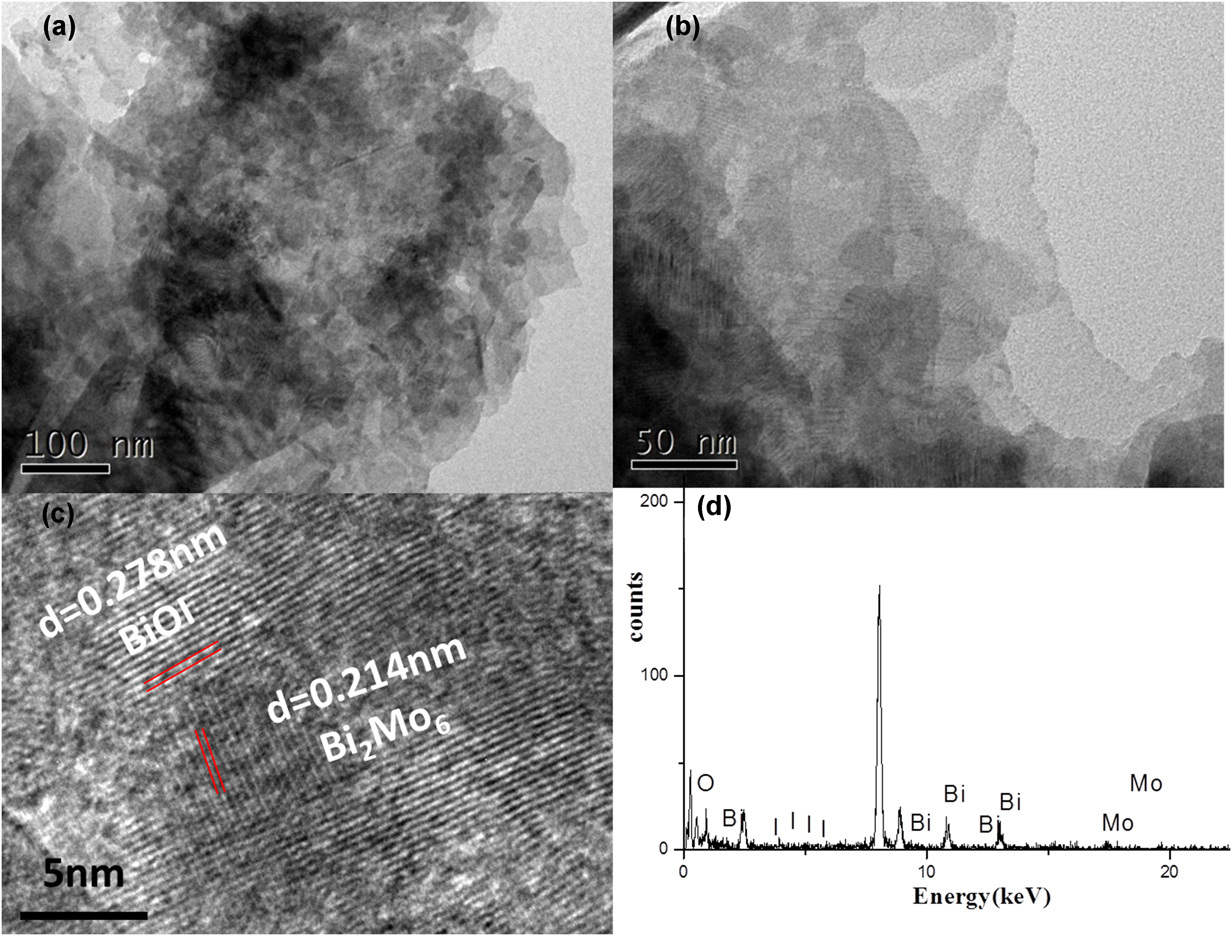
The more subtle structure of Bi2Mo6/BiOI (Bi:Mo = 4:1) composite materials is measured by TEM and HRTEM, as shown in Figs. 4(a) and 4(b), which are transmission electron microscopy images of Bi2Mo6/BiOI (Bi:Mo = 4:1). It can be seen from the figure that the film is not smooth and there are small particles on the surface of the film. Figure 4(c) is the HRTEM diagram of Bi2Mo6/BiOI (Bi:Mo = 4:1), in which two different lattice spacings can be seen. The energy spectrum [Fig. 4(d)] shows that the Bi2Mo6/BiOI (Bi:Mo = 4:1) composite material contains Bi, O, Mo, and I elements. When Bi:Mo is 4:1, the composite material is Bi2MoO6/BiOI.
(a) TEM images of Bi:Mo(4:1), (b) TEM, (c) HRTEM, and (d) EDS spectrum of Bi:Mo(4:1).
D. UV-vis DRS analysis
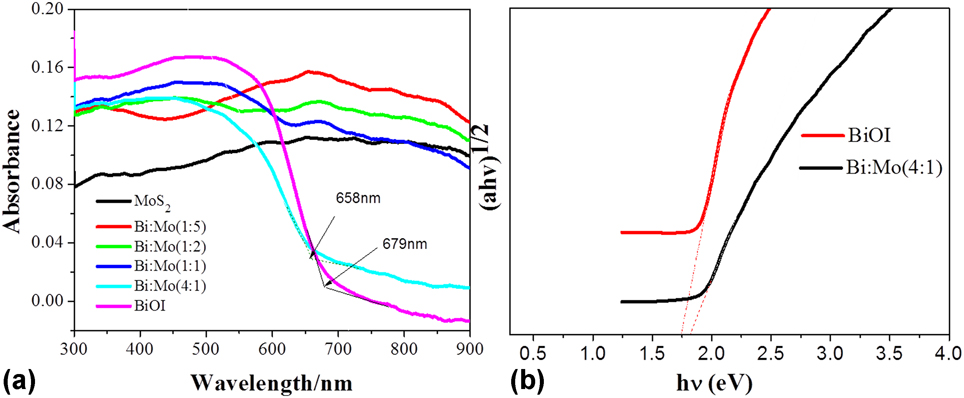
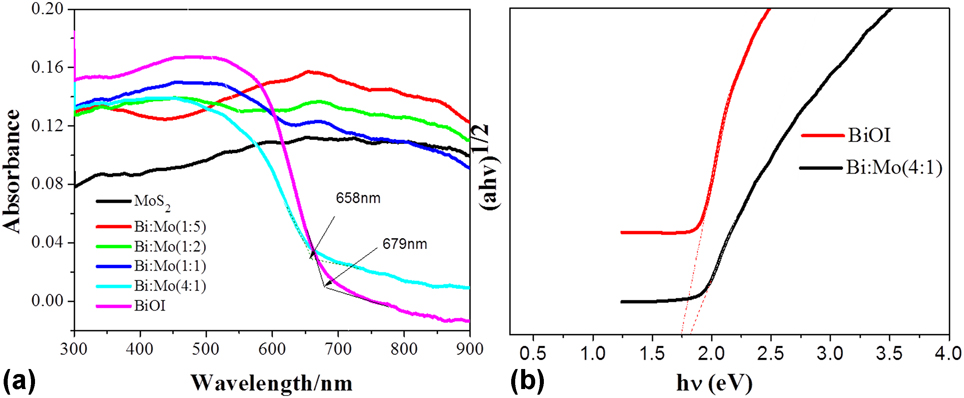
The materials’ absorption spectrum may be shown in UV-vis DRS. Figure 5(a) shows the UV-vis DRS of the samples, and MoS2 had a strong response to light in the 300–900 nm range. The absorption edge of BiOI is present at 679 nm and the band gap energy is about 1.82 eV [Fig. 5(b)], while Bi:Mo(4:1) is 658 nm. Moreover, as the content of Bi(NO3)3·5H2O and KI increased, two distinct absorption peaks appeared at 340 and 660 nm. With the ratio of Bi:Mo increased from 1:5 to 1:1, the absorption peak intensity gradually decreased at 660 nm, while the intensity of the absorption peak increased at the short wavelength. Besides, the absorbance of these composites was stronger than MoS2. The absorption peak at 660 nm had disappeared, and strong absorption peaks began to appear at 650 nm when Bi:Mo = 4:1. As the ratio of Bi:Mo increased from 1:5 to 4:1, the absorption peak at short wavelengths shifted from 340 to 650 nm.
(a) UV visible diffuse reflectance spectra of the samples and (b) band gap energies of pure BiOI and Bi:Mo(4:1).
E. PL analysis
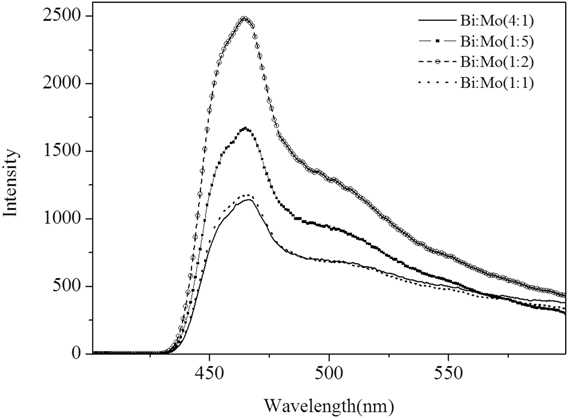
The photocatalytic activity of the catalyst is related to the separation efficiency of photogenerated electrons and holes. Fluorescence is the energy released by the excited electrons returning to the valence band and the hole, so the fluorescence spectrum can reflect the coincidence of the rate of photogenerated electrons and holes.Reference Yu, Cao, Li, Wei, Yu, Jin, Fan and Wang24 As shown in Fig. 6, the four materials have similar emission peaks at 465 nm, and the emission peak of the composite Bi:Mo(4:1) was lowest, indicating that the composite ratio of photogenerated electrons and holes of the composite is low which promotes the separation of photogenerated electrons from holes.
PL spectra of Bi:Mo(1:5), Bi:Mo(1:2), Bi:Mo(1:1), and Bi:Mo(4:1).

F. BET analysis
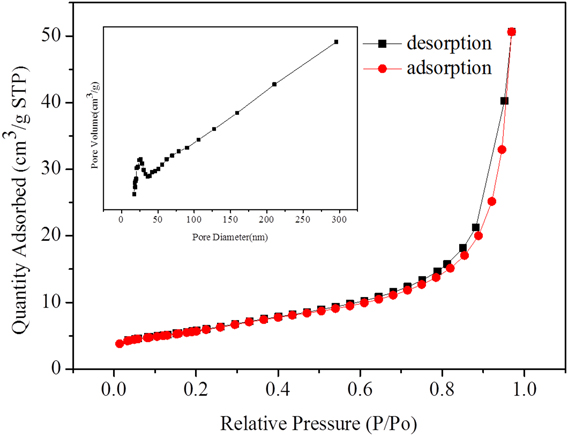
In Figure 7, the adsorption-desorption curve of the composite Bi:Mo(4:1) conforms to the type III isotherm in the IUPAC classification, and the interaction between the adsorbent and the desorbent is weak. As the pressure increased, the process increased. It may be a crack hole or a stacked hole, and the lamellar particles are piled up to form a slit hole, which are all in the sheet material.
Adsorption–desorption curve and pore size distribution of the composite Bi:Mo(4:1).
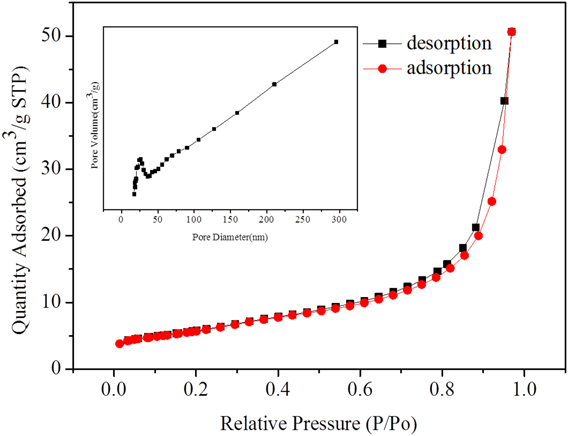
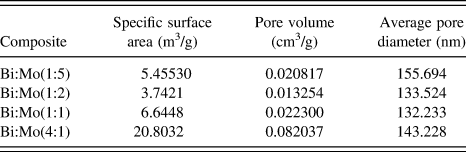
The composite Bi:Mo(4:1) has a specific surface area of 20.8032 m3/g, and the others have a specific surface area of about 5.2 m3/g (Table 1). The specific surface area is a very important parameter for the catalyst during the catalysis process. The larger the specific surface area, the higher the probability of the contact between the contaminant and the catalyst. However, in terms of the photocatalytic process, the specific surface area is not the only parameter to evaluate its activity, photocatalytic effect and effective active site, pore size distribution, and photogenerated electron. It is inextricably linked with hole separation and surface morphology. This photocatalytic experiment can be proved.
Specific surface area, pore volume, and average pore diameter of composites’ different molar ratios (Bi:Mo).

G. Photocatalytic performance test
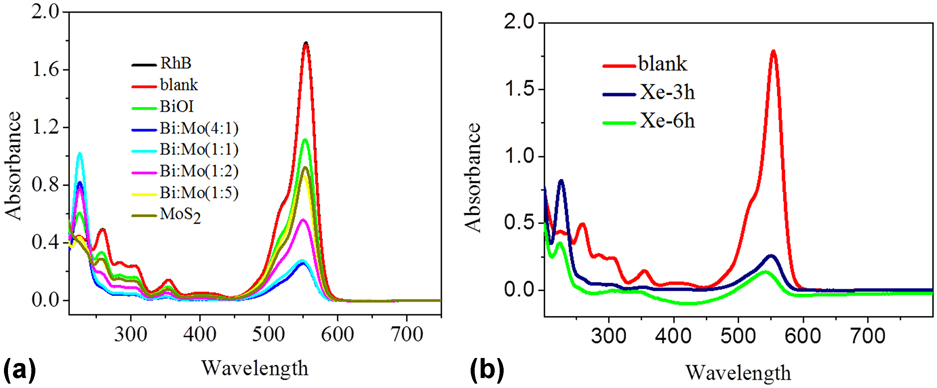
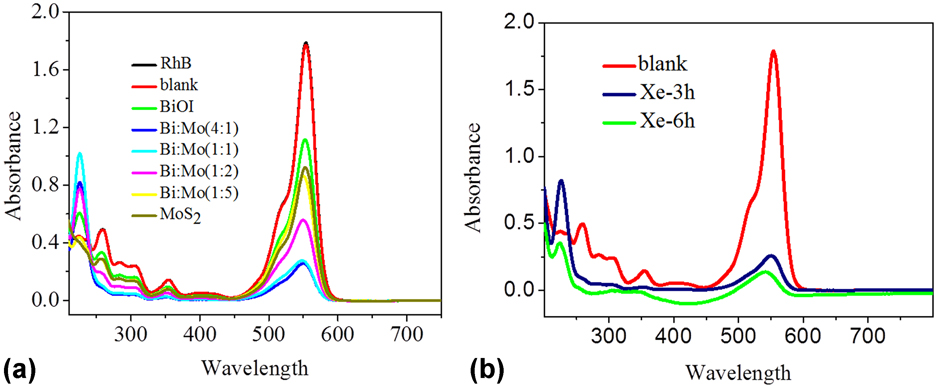
The absorbance for degradation of RhB by MoS2, BiOI, is indicated in Fig. 8, as well as different Bi:Mo molar ratio composites at the light of 350 W for 3 h. RhB was irradiated with a xenon lamp for 3 h without a catalyst in the blank experiment. BiOI had the ability to degrade RhB but it was not ideal. The degradability of MoS2 was slightly better than BiOI. The photodegradation performance of the composites was improved by adding Bi(NO3)3·5H2O and KI in MoS2. Compared with MoS2 and BiOI, the absorbance of the characteristic absorption peak of RhB at 553 nm was lower. It decreased and exhibited a blue-shift, which is the delocalization of RhB. The photodegradation ability of the composites increased with the addition of the amount of Bi. The Bi2MoO6/BiOI composite had the best effect on the degradation of RhB and the highest photocatalytic activity in the four composites when Bi:Mo = 4:1. The different photocatalytic performances of the four composites which may result from the different phases and the different modes of bonding between different phases, resulting in different separation efficiencies of photogenerated electrons and holes.
(a) Absorbance of RhB with the catalysts of MoS2, BiOI, and composites’ different molar ratios (Bi:Mo) and (b) long-time photostability of composite Bi:Mo(4:1).
H. Photocatalytic mechanism
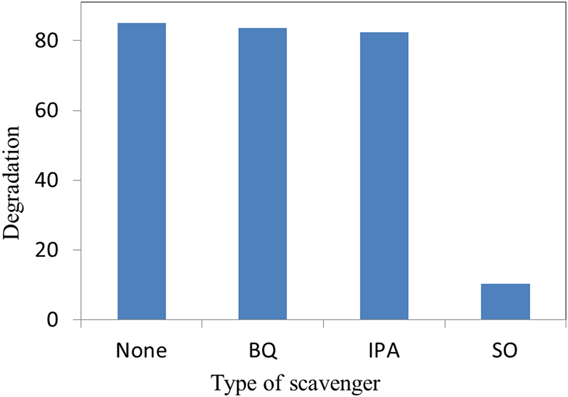
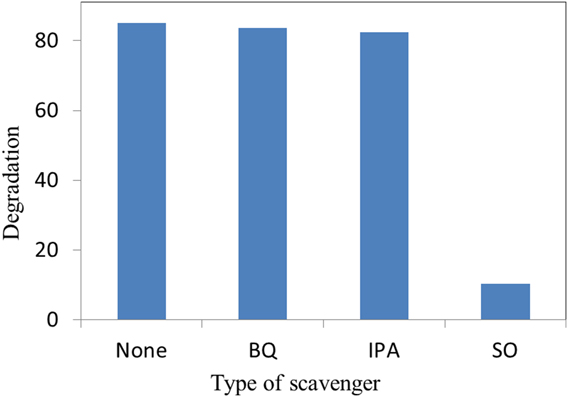
A major group of photo-living species including h+, •OH, and •O2− play a major role in photocatalytic degradation. To evaluate the role of three active species in the degradation of RhB by the Bi:Mo(4:1) composite, we investigated by adding active species capture agents to the reaction system. Isopropanol (IPA), sodium oxalate (SO), and p-Benzoquinone (BQ) were used to capture •OH, h+, and •O2−, respectively, in a concentration of 2 mmol/L in the reaction system. As shown in Fig. 9, the degradation of RhB by the Bi:Mo(4:1) composite was 81% without the addition of a capture agent, and the reaction kinetic constant (K) was 0.218 min−1. The addition of BQ and IPA had little effect on the degradation, while the addition of SO significantly reduced the degradation rate of RhB by the composite, indicating that the main active species was h+.
Degradation rate of RhB over the Bi2MoO6/BiOI(Bi:Mo = 4:1) in presence of various scavengers.
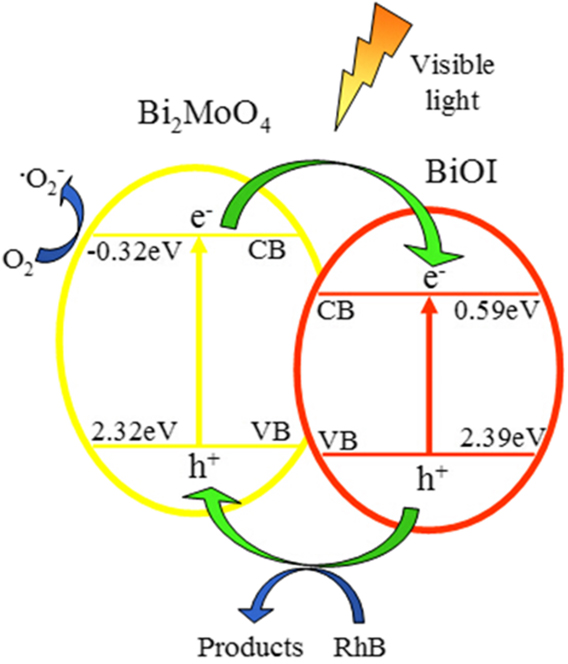
The mechanism for the degradation of RhB by the Bi2MoO6/BiOI (Bi:Mo = 4:1) photocatalyst is shown in Fig. 10. The band gap widths of Bi2MoO6 and BiOI were 2.64 and 1.8 eV, which can be motivated under visible light. The conduction band and valence band of Bi2MoO6 were −0.32 and 2.32 eV, as well as those of BiOI were 0.59 and 2.39 eV. Both Bi2MoO6 and BiOI absorbed energy in the valence band of electrons under visible light.Reference Fan, Wei, Xu, Liu, Cao, Ma and Gao25–Reference Yan, Xu, Chai, Wang, Wang and Ren27
Possible mechanism for the degradation of RhB by the Bi2MoO6/BiOI photocatalyst.

The quantity jumped to the conduction band and left same molar electron holes in the valence band. The electrons on the Bi2MoO6 conduction band can be transferred to BiOI because the position of the Bi2MoO6 conduction band was higher than that of BiOI. The holes on the BiOI valence band can flow into the Bi2MoO6 valence band because the position of the BiOI valence band was more positive than that of Bi2MoO6. O2 can form •O2− active species by getting electrons on the Bi2MoO6 conduction band, owing to the energy of the Bi2MoO6 conduction band was −0.32 eV, which was more negative than the reduction potential of O2/•O2−. The valence band energy of two materials was smaller than the oxidation potential of H2O/•OH (2.72 eV), and H2O could not be oxidized to •OH.Reference Li, Shen, Ma, Chen and Xie28,Reference Li, Xia, Xu, Murowchick and Chen29 Therefore, holes participate in the reaction and oxidize RhB to nontoxic and nonpolluting products directly. The specific photocatalytic process can be represented by the following reaction equation:
 $${{{\rm{B}}{{\rm{i}}_{\rm{2}}}{\rm{Mo}}{{\rm{O}}_{\rm{6}}}} / {{\rm{BiOI}} + h\nu }} \to {\rm{B}}{{\rm{i}}_{\rm{2}}}{\rm{Mo}}{{\rm{O}}_{\rm{6}}}\left( {{{\rm{e}}^ - }} \right) + {\rm{BiOI}}\left( {{{\rm{e}}^ - }} \right) + {\rm{B}}{{\rm{i}}_{\rm{2}}}{\rm{Mo}}{{\rm{O}}_{\rm{6}}}\left( {{{\rm{h}}^{\rm{ + }}}} \right)\quad ,$$
 $${\rm{B}}{{\rm{i}}_2}{\rm{Mo}}{{\rm{O}}_6}\left( {{{\rm{e}}^ - }} \right) + {{\rm{O}}_2} \to {\;^ \bullet }{\rm{O}}_2^ - \quad ,$$
 $${}^ \bullet {\rm{O}}_2^ - + {\rm{RhB}} \to {\rm{products}}\quad ,$$
 $${\rm{B}}{{\rm{i}}_2}{\rm{Mo}}{{\rm{O}}_6}\left( {{{\rm{h}}^ + }} \right) + {\rm{RhB}} \to {\rm{products}}\quad .$$
IV. CONCLUSIONS
In summary, different Bi:Mo molar ratio composites were synthesized via the reaction of MoS2, Bi(NO3)3·5H2O, and KI. The phase composition and chemical bonds of the composites were characterized via XRD and FT-IR, and the morphologies of the samples were characterized via SEM. With the increase of lanthanum source, the lamellar structure of the sample surface became more and more obvious. It was determined that the four composites were Bi2MoO6/MoS2 (Bi:Mo = 1:5); Bi2MoO6/BiOI/MoS2 (Bi:Mo = 1:2 and 1:1), and Bi2MoO6/BiOI (Bi:Mo = 4:1). Compared with MoS2, the composites’ photocatalytic performance was improved distinctly by adding KI and Bi(NO3)3·5H2O because the formation of heterojunction improved the separation efficiency of electrons and holes. With Bi increasing, the degradation effect of composites on RhB had been gradually improved. The photocatalytic effect of the composites was the best at Bi:Mo = 4:1, owing to the different phases of the materials prepared when the Bi/Mo ratio was different, and the electrons and the separation efficiency of holes were different results from the different combinations of the phases.
ACKNOWLEDGMENTS
This work was supported by the National Natural Science Foundation of China (21401062), the Natural Science Fund of Jiangsu Province (BK20161294), Scientific and Technological Program of Lianyungang (JC1603), the QingLan Project of Jiangsu Province, the Natural Science Fundation of Jiangsu Province Department of Education (15KJD150007, 17KJA430003), the A Project Funded by the Priority Academic Program Development of Jiangsu Higher Education Institutions, and the Public Science and graduate student research and innovation project of the Huaihai Institute of Technology (KYCX18-2604).