Pregnancy toxaemia is a significant metabolic disease of pregnant ewes, caused by reduced energy availability and abnormal metabolism of carbohydrates and fats during the final stages of pregnancy (Mavrogianni & Brozos, Reference Mavrogianni and Brozos2008; Brozos et al. Reference Brozos, Mavrogianni and Fthenakis2011). The risk for its development increases over the last month of pregnancy, with clinical signs becoming evident, usually, during the last fortnight before the expected lambing (Rook, Reference Rook2000). Lambs of ewes which survive may not thrive and are susceptible to infection, as their dams produce reduced quantity of colostrum (Andrews, Reference Andrews1997) and have reduced milk yield during the subsequent lactation period (Fthenakis et al. Reference Fthenakis, Arsenos, Brozos, Fragkou, Giadinis, Giannenas, Mavrogianni, Papadopoulos and Valasi2012).
Objective of the present study was to record, by means of ultrasonographic examination, changes occurring during lactogenesis in the udder of healthy ewes and of ewes with pregnancy toxaemia.
Materials and methods
Study design
The work was carried out in 28 3- to 5-year old housed Chios-cross ewes. Rams of known fertility were penned in a box adjoining to the one with the ewes for a month, then they were introduced into the ewes during the reproductive season. Ewes were monitored throughout their pregnancy. Repeated ultrasonographic examinations were carried out to confirm pregnancy.
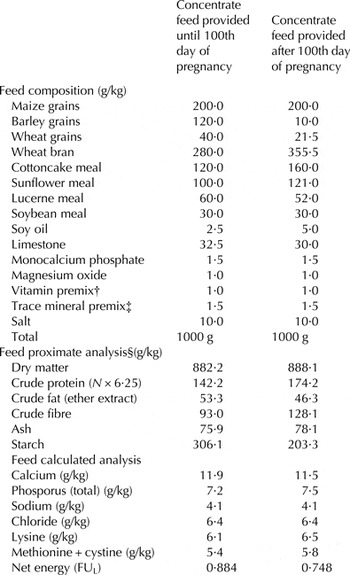
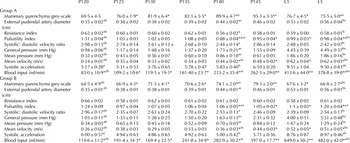
Until the 60th day of pregnancy, ration provided per ewe was 0·65 kg of a concentrate feed (Table 1) plus 1·25 kg of alfalfa hay, twice daily. From the 60th to the 100th day of pregnancy, ration per ewe was 0·30 kg of the same concentrate plus 1·00 kg of alfalfa hay, twice daily. From the 100th day of pregnancy, ration provided per ewe was 0·30 kg of concentrate feed (Table 1) plus 0·25 kg of alfalfa hay, twice daily. Blood samples were sequentially collected from each ewe for measurement of β-hydroxybutyrate and glucose concentrations, by using an automated reader (Precision Xceed Meter; Abbott Laboratories, Abbott Park, IL, USA), validated for measurement of β-hydroxybutyrate or glucose concentration in sheep blood (Panousis et al. Reference Panousis, Brozos, Karagiannis, Giadinis, Lafi and Kritsepi-Konstantinou2012; Pichler et al. Reference Pichler, Damberger, Schwendenwein, Gasteiner, Drillich and Iwersen2014). Different strips were used for measurements of β-hydroxybutyrate and glucose concentrations. Of the 28 animals, in 16 increased β-hydroxybutyrate (⩾1·2 mmol/l) concentrations were recorded in blood samples (group A), whilst in the other 12 β-hydroxybutyrate concentrations in blood samples remained consistently <1·0 mmol/l (group B). The findings are summarised in Table 2.
Details of the concentrate feed (in mash form) provided to ewes during the study

† Supplied per kg of concentrate feed: retinol 10 000 IU, cholecalciferol 2·500 IU, tocopherol 30 IU
‡ Supplied per kg of concentrate feed: zinc 100 mg, manganese 100 mg, iron 80 mg, cobalt 0·2 mg, iodine 2 mg, selenium 0·2 mg
§ According to Association of Official Analytical Chemists (1995)
Results of blood biochemical examination in ewes, with (group A) or without (B) ‘subclinical pregnancy toxaemia’ (mean ± sem)

P120, P125, etc: day of pregnancy
*P < 0·05, **P < 0·01 between the two groups at respective day for the respective parameter
a for numbers marked with same superscript within a parameter (same row) P < 0·05
On the 120th day of pregnancy (P120) and every 5 d thereafter until lambing (P125, P130, P135, P140, P145), as well as on the 3rd and the 5th day after lambing (L3, L5), ultrasonographic examinations (B-mode and Doppler) were performed in the udder of ewes in the study. Clinical examinations were performed on each occasion when ultrasonographic examination of the udder was carried out. After lambing, measurements of produced milk were performed and milk samples were collected for bacteriological and cytological examination.
Samplings and examinations performed
Udder examinations were performed before the start of the dry-period of the ewes, during the study, as well as after the subsequent lambing of the animals. Initially, detailed clinical examination of the mammary glands and teats, which were observed, palpated and compared between them, was performed. Milk samples were collected after disinfection of the skin of the teat and disposal of the first stripping of milk. Samples were collected from both mammary glands of each ewe and cultured in blood agar plates for incubation at 37 °C for up to 72 h. Cytological examination included California Mastitis Test and Giemsa stain of milk samples (Fthenakis, Reference Fthenakis1994, Reference Fthenakis1995; Saratsis et al. Reference Saratsis, Leontides, Tzora, Alexopoulos and Fthenakis1998; Mavrogianni et al. Reference Mavrogianni, Fthenakis, Brooks, Papaioannou, Cripps, Taitzoglou, Brellou and Saratsis2005, Reference Mavrogianni, Cripps, Papaioannou, Taitzoglou and Fthenakis2006).
Milk produced by ewes was estimated by measurements performed on L3 and L5. Ewes were injected intramuscularly with 10 i.u. oxytocin and milked out. Lambs were taken away from the ewes for 4 h, when ewes were injected again with 10 i.u. oxytocin and once more milked out. The milk was collected into a plastic container. To avoid misreading by foam formation and for accuracy of results, the milk was slowly poured into a volumetric glass container graduated to 2 ml and allowed still for 5 min before reading (Fthenakis & Jones, Reference Fthenakis and Jones1990; Fthenakis et al. Reference Fthenakis, Papadopoulos and Himonas2005).
Ultrasonographic examination
The ultrasonographic examination was always performed in the morning of each examination day; during lactation (L3, L5), it was performed before emptying the udder. The examination was performed with the animal on the standing position and restrained inside a crate, using the support of an assistant. For examination, hair on the udder had been fully clipped.
Ultrasonographic examination of the udder was performed with an ultrasound scanner (MyLab® 30; ESAOTE SpA, Genova, Italy) fitted with a linear transducer with 7·5–12·0 MHz imaging frequency. Coupling gel was applied. The probe was placed on the caudal surface of the udder and moved around it.
Initially, the left side of the udder was imaged. The transducer was placed in a position perpendicular to the long axis and dorsal sections of the mammary parenchyma were taken, starting from the upper part downwards. In each mammary gland, three images were saved for further processing; first image was taken before the branching of the external pudental artery (arteria pudenda externa), second when distance between branches of the external pudental artery was ~1 cm and third image was taken immediately before the gland cistern (sinus lactiferous) became visible; 60 mm scanning depth and 10 MHz frequency were used for this procedure.
Then, Doppler measurements were taken at the same blood vessel; 60 mm scanning depth and 6·6 MHz frequency were used for this procedure. At the start, a cross-section of the vessel was taken before its branching, with the objective to measure the diameter of the vessel. Then, the colour Doppler gate was positioned parallel to the wall of the vessel examined; when optimal colour flow was achieved, a spectral mode waveform was taken. A skilled assistant was helping when measuring the blood flow velocity, in order to make adjustments necessary for optimal quality of colour-flow images. Animals were stressed as little as possible during the examination, with the objective to have them examined remaining still for the period of time necessary to correctly apply the sample gate and to take the spectral display after localising the vessel to be studied. Initially, the vessel to be examined with the colour-flow imaging, was localised. Then, adjustments necessary for optimal colour-flow image quality were made. Spectral mode was switched on and the sample gate was positioned inside the vessel and at its centre, whilst taking care not to include the vessel wall and to avoid artefacts; this was followed by setting the appropriate ‘Doppler angle’ (i.e., the angle at which the ultrasound beams intersect the path of flowing blood, also termed ‘angle of insonation’ [Ginther, Reference Ginther2007; Petridis et al. Reference Petridis, Gouletsou, Barbagianni, Amiridis, Brozos, Valasi and Fthenakis2014]). In this case, a ‘Doppler angle’ of 50° to 60° was used in the examination.
All the imaging procedures described above were subsequently repeated for the right mammary gland. In all cases, images (B-mode or Doppler) were frozen and saved on the equipment hard-disk for performing subsequently appropriate measurements and data analysis.
Data management and analysis
Results taken into account
During the ultrasonographic examination three sets of images were recorded: (a) images of mammary parenchyma, (b) images of cross-sections of external pudendal artery and (c) spectral waveforms of external pudendal artery. All images were initially evaluated visually for presence of abnormal structures therein. Then, data management was performed on images that had been saved at the time of examination. Data for left and right mammary gland of the same animal were initially considered separately.
Stored images of mammary parenchyma were processed by means of ImageJ software (National Institutes of Health, Rockville Pike, MD, USA), which can edit, process and analyse grey-scale images, by calculating area and pixel value statistics to produce intensity values (National Institutes of Health, 2013). In an image processing context, grey-scale analysis refers to the image's overall pixel grey intensity values (Ojala et al. Reference Ojala, Pietikaeinen and Maeenpaea2002). For analysis of grey-scale, intensity values of each of the three images stored from each mammary gland on each occasion were considered together. Areas with vessels or ductal formations were not taken into account for the grey-scale analysis. Results were expressed on a 0 (black) to 255 (white) scale.
Stored images of cross-sections of external pudendal artery were processed by means of MyLab software (ESAOTE SpA, Genova, Italy), which, after pointing out the internal boundaries of the vessel, calculated the internal diameter of the vessel. Results were expressed as cm.
Finally, spectral waveforms of the external pudendal artery were processed by means of MyLab software (ESAOTE SpA, Genova, Italy). On each occasion, waveforms from three consecutive cardiac cycles of the animal under examination were considered for calculations. The software, based on the outline of the waveform, calculated directly the following haemodynamic parameters in that vessel (Maulik, Reference Maulik and Maulik2005; Ginther, Reference Ginther2007; Wood et al. Reference Wood, Romine, Lee, Richman, O'Boyle, Paz, Chu and Pretorius2010):
• Resistance index: [(PSV-EDV)/PSV] (PSV: peak systolic velocity, EDV: end diastolic velocity) indicating the effect of the vessel resisting blood flow.
• Pulsatility index: [(PSV-EDV)/TAMV] (TAMV: time-averaged maximum velocity) measuring the systolic-diastolic differential of the velocity pulse.
• Systolic:diastolic velocity ratio: [ASF/ADF] (ASF: average diastolic flow, ADF: average systolic flow) delineating systolic and diastolic phases of a flow waveform.
• General pressure: [P syst − P diast] ([P syst: systolic pressure, P diast: diastolic pressure) measuring the change in pressure from the diastolic level to the systolic level.
• Mean pressure: [⅓ × P syst + ⅔ × P diast] measuring the average blood pressure over time by proprietary pulse dynamics pattern-recognition algorithms.
• Mean velocity: indicating blood speed across the vascular lumen at a given instance (m/s).
• Systolic acceleration: indicating blood acceleration across the vascular lumen (m/s2).
• Blood input: indicating the volume of blood entering the mammary gland per unit of time (ml/min).
Statistical computations
All data were entered into Excel spreadsheets (Microsoft Corporation; Redmond, WA, USA). Initially, descriptive statistics for all parameters were performed.
For ultrasonographic measurements, at first, repeated measures mixed effect linear regression models were used to determine whether outcomes in the two mammary glands of each animal changed over the course of the study period. Models were adjusted for repeated measures within animals. Variables (fixed effects) included mammary gland (i.e., left or right) and time-point of the study (i.e., P120, P125, P130, etc.). In all cases, no significant differences were evident between the left and the right glands of the experimental animals within each group (for all parameters, P > 0·63).
In view of that, the results of all measurements for left and right glands obtained from each animal at each time-point were averaged for between group comparisons. Then, repeated measures mixed effect linear regression models were used to determine whether outcomes in the two groups of the study changed over the course of the study period. Effect of experimental subjects (animals) was included as random effect in the model. Models were adjusted for repeated measures within animals. Independent variables (fixed effects) included experimental group (A or B), time of the study (i.e., P120, P125, P130, etc.) and a time of the study by experimental group interaction.
In total four separate analyses were performed. Analysis of data obtained during the last month of pregnancy (6 time-points: P120, P125, P130, P135, P140, P145) was initially performed, followed by analysis of data obtained during the last fortnight of pregnancy (3 time-points: P135, P140, P145) and analysis of data obtained during the first week of lactation (2 time-points: L3, L5). Finally, an analysis that took into account all data (8 time-points) was carried out. Subsequently, a different set of analyses was performed, where, for each parameter, results obtained on three time-points (P120, P140, L5) were compared between them.
The same model was employed for evaluation of differences in blood β-hydroxybutyrate or glucose concentrations during pregnancy (P120–P145).
Measurements of milk collected on each sampling occasion were compared between the two groups by using Student's t-test.
For evaluation of potential correlations between milk quantities obtained from ewes and grey-scale intensity/blood input values, results of milk quantities collected on each of L3 or L5 were correlated with the grey-scale/blood input values obtained from each ewe on the respective occasion, i.e., 32 pairs of values for group A results and 24 pairs of values for group B results. Then, averaged results of milk quantities obtained on L3 and L5 were correlated with the grey-scale/blood input values obtained from each ewe on each of P130 to P145, i.e., 28 pairs in total tested on four separate occasions.
All analyses were performed by a commercial statistical program (SPSS, v. 15 for Windows; SPSS Inc., Chicago, IL, USA). Significance level was set at P = 0·05.
Results
No mammary abnormalities were clinically evident in any of the experimental ewes at any of the examination (before or after lambing). Moreover, no bacteria were isolated from any milk samples from the experimental ewes collected at the start of the study or after the subsequent lambing. California Mastitis Test scores in milk samples were negative and observation of Giemsa-stained milk films revealed only scarce presence of macrophages therein (on average, one cell per 10 fields with the 10× objective lens).
Mean collected quantity of milk from group A ewes on L3 was 78·1 ± 4·2 ml and on L5 was 86·4 ± 3·8 ml; respective quantities for group B ewes were 89·5 ± 3·1 ml and 117·6 ± 4·8 ml (P = 0·019 and P < 0·001, respectively).
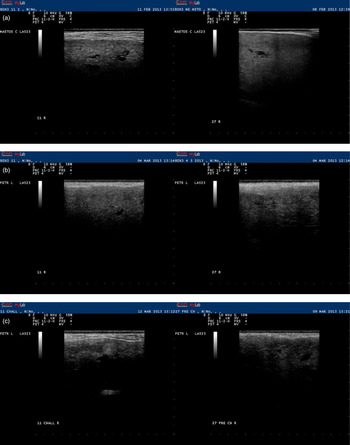
Anatomic structures in the mammary gland had a reduced to medium echogenicity. Blood vessels and lactiferous ducts could be readily imaged in all the animals during the study. No abnormal structures were evident. As the observations progressed to nearing parturition, the mammary parenchyma was seen more heterogeneous, with simultaneous appearance of a lobular image (consisting of the alveolar areas with reduced echogenicity) and the ductal part of the gland and the blood vessels therein (imaged as anechoic antra).
Throughout the last month of pregnancy, mean (±sem) grey-scale intensity values in group A were 69·5 ± 4·5 on P120, 81·9 ± 6·4 on P130, 95·3 ± 3·3 on P145; respective values in group B were 64·5 ± 4·9, 71·3 ± 4·1 and 79·3 ± 2·0 (for differences between groups, P = 0·007). There was also clear evidence that, throughout the last month of pregnancy, the progressive increase in grey-scale intensity values was significant (P < 0·001) in both groups, A or B. Subsequently to lambing, on L3, grey-scale intensity values decreased sharply compared to those on P145: by 20% or 15% for group A or B, respectively, which was a significant decrease (P = 0·003 for group A, P = 0·005 for group B). During the first week of lactation, changes over time were not significant (P > 0·6), although differences between the two groups remained significant (P = 0·046) (Fig. 1).
Serial ultrasonographic appearance of mammary parenchyma of ewes with (group A, left figure in each pair of images) or without (group B, right figure in each pair of images) ‘subclinical pregnancy toxaemia’: (a) on the 120th/125th day of pregnancy (P120/P125), (b) on the 145th day of pregnancy (P145), (c) on the 5th day of the subsequent lactation period (L5). Images taken at a level after the branching of the external pudendal artery (when distance between the two branches was ~0·5 cm) on a MyLab® 30 ultrasonography system with linear transducer 10·0 MHz and scanning depth 60 mm.

There was a significant reverse correlation between grey-scale intensity values in L3/L5 and milk quantities collected from these animals on the same days (for group A: r = −0·409, P = 0·010; for group B: r = −0·4378, P = 0·016); further, there was also a significant reverse correlation between grey-scale intensity values on P145 and milk quantities collected from these animals after lambing (r = 0·443, P = 0·015). There was also a significant correlation between blood input values in L3/L5 and milk quantities collected from these animals on the same days (for group A: r = 0·2709, P = 0·067; for group B: r = 0·4083, P = 0·024); further, there was also a significant correlation between blood input values on P130/P135/P140/P145 and milk quantities collected from these animals after lambing (r = >0·41, P < 0·035).
Throughout the last month of pregnancy and during the first week of lactation, the progressive increase of the diameter of the external pudendal artery was significant in both groups, A or B (P < 0·001). However, the diameter of the vessel did not differ significantly between the two groups (P = 0·374 in pregnancy and P = 0·591 in lactation).
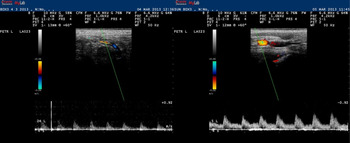
The spectral display in Doppler mode was observed as a broad band structure (Fig. 2). Throughout the last month of pregnancy, the progressive changes in the blood flow parameters studied were significant (P < 0·02) in both groups, A or B, bar changes in resistance index or in blood systolic acceleration (P > 0·4). During the first week of lactation, changes in all the blood flow parameters studied were not significant in both groups (P > 0·12), bar changes in blood input in group B ewes, which decreased significantly from L3 to L5 (P = 0·009).
Serial spectral waveforms of the external pudendal artery at the mammary gland of ewes with (group A, left figure) or without (group B, right figure) ‘subclinical pregnancy toxaemia’ on the 145th day of pregnancy (P145). Images taken and processed on a MyLab® 30 ultrasonography system with linear transducer 6·6 MHz and scanning depth 60 mm.

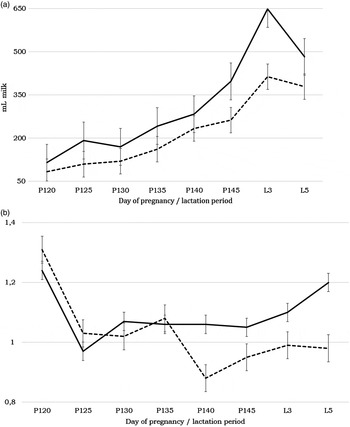
Blood input was significantly greater in ewes of group B (169 ml/min on P130, 397 ml/min on P145, 649 ml/min on L3) than in ewes of group A (119, 262, 413 ml/min on respective days) during the last month of pregnancy and the first week of lactation (P < 0·05) (Fig. 3). Differences between group A and group B in all other blood flow parameters studied were not significant throughout the last month of pregnancy (P > 0·25). However, when data obtained only during the last fortnight of pregnancy or during the first week of lactation were considered, differences in pulsatility index (Fig. 3) and in mean blood velocity showed evidence of significance between the two groups (P = 0·007 and P = 0·036, respectively). Differences in results for these two parameters were also significant during the first week of lactation (P < 0·04), whilst for other parameters, they were not (P > 0·06) (Fig. 2).
Time-series graphs of the Doppler ultrasonography results of the external pudendal artery at the mammary gland of ewes with (group A, dotted line) or without (group B, straight line) ‘subclinical pregnancy toxaemia’ during the last stage of pregnancy and initial stage of lactation (a) blood input (ml/min), (b) pulsatility index.

Detailed results of ultrasonographic examinations are in Table 3.
Quantitative results of ultrasonographic (B-mode or Doppler) examination of udder in ewes, with (group A) or without (B) ‘subclinical pregnancy toxaemia’ (mean ± sem); results of both mammary glands of ewes are considered together, as no statistical difference (P > 0·63) was evident between left and right mammary glands

P120, P125, etc: day of pregnancy, L3, L5: day after lambing
*P < 0·05, **P < 0·01 between the two groups at respective day for the respective parameter
a–c for numbers marked with same superscript within a parameter (same row) P < 0·05
Discussion
The present study describes, to the best of our knowledge for the first time, the B-mode and Doppler ultrasonographic patterns of the mammary gland of ewes during lactogenesis. The study presents relevant findings in healthy ewes, as well as in ewes with pregnancy toxaemia. Changes in ultrasonographic appearance of the mammary parenchyma can reflect histological changes, which occur at the end of pregnancy, as the mammary gland prepares for the impending lactation.
Three fields were adequate to receive a representative ultrasonographic image of the mammary parenchyma studied. During the examination, we used as reference points anatomical structures of the mammary gland (as these did not change during the study) rather than dimensions (which changed as mammary development progressed). Ultrasonographic examination by means of the Doppler technique was useful for measurement of the blood flow in the ovine mammary gland (Christensen et al. Reference Christensen, Nielsen, Bauer and Hilden1989; Piccione et al. Reference Piccione, Arcigli, Assenza, Percipalle and Caola2004; Petridis et al. Reference Petridis, Gouletsou, Barbagianni, Amiridis, Brozos, Valasi and Fthenakis2014).
The changes in intensity values of grey-scale appearance of ultrasonographic images of mammary parenchyma during the last month of pregnancy indicate a progressively increasing echogenicity. This could be attributed to increasing numbers of mammary epithelial cells, compatible with the lactogenesis process taking place at that time. Remodelling of the extracellular matrix of the mammary gland takes place at that time, which results in increase of alveolar tissue and reduction of stromal tissue in the mammary parenchyma (Akers et al. Reference Akers, Capuco and Keys2006). These changes could be reflected in the intensity values of grey-scale imaging of the mammary tissue.
Immediately after lambing (L3, L5), we observed a sharp reduction of echogenicity in the mammary parenchyma of ewes in both groups. This, obviously, was the result of milk (a hypoechogenic material) present in large volumes into the mammary alveoli, ductal system and cistern, as lactation started.
Presence of increased quantity of lacteal secretion in the mammary gland of healthy ewes could also be the reason for the reduced echogenicity of these mammary glands, compared to that in the mammary glands of ewes with pregnancy toxaemia. This difference was significant and was continued after lambing, when also presence of increased quantity of milk in the mammary gland of healthy ewes (compared to that in ewes which had pregnancy toxaemia) was corroborated by the documented greater milk quantity collected from healthy ewes. These findings are consistent with the documented smaller milk quantity of ewes with pregnancy toxaemia at their subsequent lactation period (Andrews, Reference Andrews1997; Meyer et al. Reference Meyer, Reed, Neville, Thorson, Maddock-Carlin, Taylor, Reynolds, Redmer, Luther, Hammer, Vonnahme and Caton2011), as efficient lactogenesis is dependent on appropriate nutrition during the last month of pregnancy (Castro et al. Reference Castro, Capote, Bruckmaier and Arguello2011). Moreover, blood glucose concentrations have been associated with increased milk production (McNeill et al. Reference McNeill, Murphy and Lindsay1998) and similar findings were evident in the present study, as group A ewes had significantly smaller blood glucose concentrations.
Along with the mammary parenchyma, the blood vessels of the gland also develop during the final month of pregnancy. Increase of the diameter of the external pudendal artery further contributes to the greater amount of blood transferred to the mammary gland. Development of blood vessels in the udder is controlled by hormones, which stimulate growth of the mammary parenchyma, e.g. oestrogens and progesterone (Tucker, Reference Tucker1981). This is further supported by the progressively decreasing blood concentrations of vasoconstrictor hormones during late pregnancy (Greiss, Reference Greiss1972; Rosenfeld et al. Reference Rosenfeld, Barton and Meschia1976; Natrajan et al. Reference Natrajan, McGarrigle, Lawrence and Lachelin1982).
Doppler ultrasonographic indices and parameters also pointed to the progressively increasing blood perfusion in the udder as lactogenesis advanced. During the last stage of pregnancy, blood is required for the synthesis of milk, as it carries precursors of milk constituents to the mammary gland and, hence, blood flow progressively increases as lactogenesis advances. Increasing blood volumes provide stronger signals for Doppler spectrum analysis, because of the greater number of moving erythrocytes (Widder & Goertler, Reference Widder, Goertler, Widder and Goertler2004).
The results have also indicated that blood input into the udder of ewes with pregnancy toxaemia was significantly smaller than into the udder of normal ewes. Increased blood input into the mammary gland has been found to lead to increased milk yield (Linzell, Reference Linzell1960, Reference Linzell, Larson and Smith1974; Kronfeld et al. Reference Kronfeld, Raggi and Ramberg1968; Davis & Collier, Reference Davis and Collier1985). Various factors may lead to increased blood input, for example Lough et al. (Reference Lough, Beede and Wilcox1990) have identified increased energy availability with feed as a factor for increased mammary blood input.
Smaller blood input (Doppler findings) in ewes which received reduced amount of energy during pregnancy, has resulted to smaller amount of epithelial cells in their mammary glands (B-mode findings). Further, smaller blood input can lead to reduced oxygen availability at alveolar level, with reduced oxygen transfer at mammary alveoli, as has been reported in lactating cows (Neary & Garry, Reference Neary and Garry2014), which would have further contributed to the reduced milk production by these ewes.
Blood input (ml/min) appears to be the most accurate haemodynamic index to identify differences between the two groups of animals. Low mean velocity of blood in large vessels has been correlated with increased blood input into the mammary gland of women (Madjar & Mendelson, Reference Madjar and Mendelson2008), something that we also observed in ewes with no toxaemia at the end of pregnancy; it has been suggested that the finding indicates mammary glands with no potential abnormalities (Madjar & Mendelson, Reference Madjar and Mendelson2008). Pulsatility index also became of significance at the end of pregnancy, when differences in blood flow into the udder further increased, indicating the increased cardiac output to the udder of healthy ewes; low pulsatility index suggests compensatory distal vasodilatation following reduced volume of blood perfusion (Rajajee et al. Reference Rajajee, Fletcher, Pandey, Gemmete, Chaudhary, Jacobs and Thompson2012), as in the ewes with pregnancy toxaemia. In fact, after lambing, approximately 15% of total cardiac output is directed to the udder (Linzell, Reference Linzell, Larson and Smith1974; Olsson et al. Reference Olsson, Hydbring and Cvek1998; Svennersten-Sjaunja & Olsson, Reference Svennersten-Sjaunja and Olsson2005). Increased blood demand in the udder during lactation (Braun & Forster, Reference Braun and Forster2012) puts a tremendous burden on and affects the entire circulatory system of the animal (Gürtler & Schweigert, Reference Gürtler, Schweigert, Engelhardt and Breves2005). As start of lactation is imminent, in ewes with pregnancy toxaemia, which will have a smaller milk production, cardiac output (as shown in pulsatility rates just before lambing) is smaller than in healthy ewes.
Other haemodynamic indices take into account vascular effects, which are influenced by locally produced vasoregulators (Prosser et al. Reference Prosser, Davis, Farr and Lacasse1996). As there were differences in the amount of mammary tissue between ewes of group A and B, possibly there was also a different rate of production of these, which would have resulted in the lack of significant differences in those indices between the two groups. In fact, some local (i.e., mammary) regulation of blood input into the udder has been reported by Cieslar et al. (Reference Cieslar, Madsen, Purdie, Trout, Osborne and Cant2014).
Ewes with pregnancy toxaemia have been found to be at increased risk for development of mastitis in the immediately post-partum period (Mavrogianni et al. Reference Mavrogianni, Papadopoulos, Spanos, Mitsoura, Ptochos, Gougoulis, Barbagianni, Kyriazakis and Fthenakis2014; Barbagianni et al. Reference Barbagianni, Mavrogianni, Katsafadou, Spanos, Tsioli, Galatos, Nakou, Valasi, Gouletsou and Fthenakis2015). The decreased blood input into the udder would have also resulted to mammary infiltration with reduced number of leucocytes. Additionally, during the post-partum period, phagocytic efficiency of leucocytes decreases (Coop & Kyriazakis, Reference Coop and Kyriazakis1999; Shafer-Weaver et al. Reference Shafer-Weaver, Corl and Sordillo1999). These factors contribute to the increased susceptibility of ewes with pregnancy toxaemia to post-partum mastitis.
Present results and available literature have indicated the association of blood input to the udder with milk production of animals. Possibly therefore, measurements of blood input during final stage of pregnancy may be used to predict milk yield of ewes during the forthcoming lactation period.
Concluding remarks
The above findings may be used to describe normal ultrasonographic appearance of the udder of ewes during lactogenesis. This way, reference standards would be available for interpreting abnormal features subsequently. Results of B-mode ultrasonographic examination indicated differences between healthy ewes and ewes with pregnancy toxaemia in remodelling of mammary parenchyma. Results of Doppler ultrasonographic examination indicated that blood input into the mammary gland progressively increased at the last stage of pregnancy. Further, there was clear evidence of smaller blood input into the udder of ewes with pregnancy toxaemia, which was significantly correlated with the reduced amount of milk obtained from these ewes. Perhaps, ultrasonographic udder examination at late gestation may have a predictive value for the milk production during the subsequent lactation period.