Introduction
Despite the soil-building benefits of no-till, most vegetable production systems have been slower to adapt no-till systems than agronomic crops for a variety of reasons; however, production of no-till vegetable crops increased during the 1990s (Morse, Reference Morse1999). Mechanical weed control (cultivation) commonly practiced in many vegetable crops is not well adapted to conservation tillage systems, where one-third or more of the soil surface remains covered with crop residues (Peigne et al., Reference Peigne, Ball, Roger-Estrade and David2007). Many vegetable crops are small-seeded and difficult to plant and establish in high residue no-till fields. An alternative system, strip till, prepares a more residue-free seed bed in strips between untilled areas (Hoyt et al., Reference Hoyt, Monk and Monaco1994; Luna et al., Reference Luna, Mitchell and Shrestha2012). However, such systems forfeit the weed suppressive advantages of crop residues in the seed row. Organic vegetable growers have been even slower to develop no-till systems primarily due to limited herbicide options for terminating cover crops and managing weeds, as well as the lack of cultivation tools that operate effectively in the presence of heavy surface residues (Carr et al., Reference Carr, Gramig and Liebig2013).
Growing cover crops that produce large quantities of residue and leaving residues on the soil surface can be an effective way to reduce soil erosion, improve water infiltration, sequester nutrients, reduce runoff of pesticides and suppress annual weeds (Morse, Reference Morse1999; Rice et al., Reference Rice, McConnell, Heighton, Sadeghi, Isensee, Teasdale, Abdul-Baki, Harman-Fetcho and Hapeman2001; Teasdale et al., Reference Teasdale, Brandsaeter, Calegari, Skora Neto, Upadhyaya and Blackshaw2007; Carr et al., Reference Carr, Gramig and Liebig2013). Mowing or using burndown herbicide are common methods of controlling cover crops for no-till planting. Mowing or flail chopping often has to be repeated and can leave uneven residues on the soil surface, including small pieces of residue that decompose quickly (Creamer and Dabney, Reference Creamer and Dabney2002). Roller–crimpers were developed to mechanically flatten and kill cover crops, leaving a weed suppressive mulch on the soil surface (Creamer and Dabney, Reference Creamer and Dabney2002; Ashford and Reeves, Reference Ashford and Reeves2003; Mischler et al., Reference Mischler, Curran, Duiker and Hyde2010a; Carr et al., Reference Carr, Gramig and Liebig2013). Unlike mowing or flail chopping, terminating tall grass cover crops by rolling and crimping leaves residues aligned uniformly, which facilitates planting of the main crop. Cereal rye (Secale cereal L.) and hairy vetch (Vicia villosa Roth) have been successfully terminated by the roller–crimper and provide some weed suppression (Ashford and Reeves, Reference Ashford and Reeves2003; Mirsky et al., Reference Mirsky, Curran, Mortensen, Ryan and Shumway2009; Davis, Reference Davis2010; Mischler et al. Reference Mischler, Curran, Duiker and Hyde2010a, Reference Mischler, Duiker, Curran and Wilsonb).
For effective annual weed suppression with cover crop residues, a dense stand with high biomass is important. However, when cover crop residues are left as surface mulch, cultivating escaped weeds can be difficult. Thus, managing weeds in a no-till system following a poor cover crop stand or with escape weeds may be more difficult than in systems without mulch.
Large-seeded vegetable crops, such as beans, cucurbits, sweet corn or transplanted vegetable crops emerge and establish through heavy plant residues better than small-seeded vegetables, making them better candidates for no-till systems (Hoyt et al., Reference Hoyt, Monk and Monaco1994; Abdul-Baki et al., Reference Abdul-Baki, Teasdale, Korcak, Chitwood and Huettel1996; Mulvaney et al., Reference Mulvaney, Price and Wood2011; Delate et al., Reference Delate, Cwach and Chase2012; Kornecki et al., Reference Kornecki, Arriaga and Price2012). However, yields of transplanted tomato, zucchini and bell pepper planted into roller-crimped rye or hairy vetch were reduced 41–92% compared with a no cover crop (i.e. fallow) treatment (Leavitt et al., Reference Leavitt, Sheaffer and Wyse2011). Poor yields were attributed in part to insufficient soil nitrogen (N) and cold soil temperatures. Tomato and eggplant transplanted into organic no-till systems resulted in crop failures (Luna et al., Reference Luna, Mitchell and Shrestha2012). Whereas many vegetable crops (collards, onions and zucchini) have been transplanted into no-till systems with high residues with success (Vollmer et al., Reference Vollmer, Creamer, Reberg-Horton and Hoyt2010; Mulvaney et al., Reference Mulvaney, Price and Wood2011; Canali et al., Reference Canali, Campanelli, Ciaccia, Leteo, Testani and Montemurro2013), obtaining good seed-to-soil contact when direct-seeding vegetables can be a challenge (Morse, Reference Morse1999; Davis, Reference Davis2010).
Snap bean (Phaseolus vulgaris L.) is an important vegetable crop grown for fresh market and processing. The majority of snap bean production in the USA is for processing (66 360 ha) (NASS, 2015). Our study areas in Illinois and Washington represent two primary production areas of processed snap beans in the Midwest and Pacific Northwest (PNW) regions. Midwestern soils typically contain higher organic matter (O.M.) and clay, whereas mineral soils low in O.M. are more frequent in the PNW vegetable-growing region. No-till planting into cover crops in the PNW region is often practiced to maintain or increase soil O.M., reduce soil erosion and improve water infiltration, whereas Midwest producers tend to be more focused on reducing pesticide runoff, reclaiming nutrients and controlling weeds.
No-till planting of snap bean into hairy vetch residues controlled by flail chopping was successful, but required a post-emergence application of sethoxydim for control of grassy weeds (Abdul-Baki and Teasdale, Reference Abdul-Baki and Teasdale1997). Yields of no-till snap bean were similar to or greater than yields of conventionally tilled fields in studies by Skarphol et al. (Reference Skarphol, Corey and Meisinger1987). However, others have reported yield losses for snap bean no-till planted into cover crop residues, citing problems with inadequate crop stands, poor weed control, N immobilization or release of allelochemicals from decomposing residues (Knavel and Heron, Reference Knavel and Heron1986; Mwaja et al., Reference Mwaja, Masiunas and Eastman1996; Rutledge, Reference Rutledge1999).
The objectives of this study were to: (1) quantify the effectiveness of control methods for rye and vetch cover crops when utilizing a roller–crimper and (2) evaluate the response of snap bean and weeds to these cover crops and cover crop control methods in two primary snap bean production regions of the USA.
Materials and methods
Site conditions and management
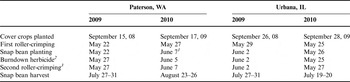
Field studies were conducted in 2009 and 2010 near Paterson, WA and Urbana, IL. Cover crops were seeded with a grain drill in 18-cm rows September 15, 2008 and September 17, 2009 at Paterson and September 26, 2008 and September 28, 2009 at Urbana (Table 1). Common vetch (Vicia sativa L.) (Paterson) or hairy vetch (Urbana) were seeded at 76 kg ha−1, rye at 100 kg ha−1 (var. ‘Aroostook’ at Paterson and var. ‘HiRye 500’ at Urbana) and a rye + vetch mixture at 56 kg ha−1 of each. A fallow treatment was included as a control. Soil at the Paterson site was a Quincy sand (mixed, mesic Xeric Torripsamments) with pH 7.0 and 0.4% O.M.. Soil at Urbana was a Flanagan silt loam (Fine, smectitic, mesic Aquic Argiudolls) with pH 6.1 and 4.0% O.M. Trials were irrigated as needed with a center pivot irrigation system at Paterson and grown under natural rainfall and supplemental sprinkler irrigation at Urbana. Experiments were arranged in a split plot randomized block design with four replications. Main plots were cover crops and split plots were cover crop control methods. Main plots were 12.2 m × 12.2 m and split plots were 3 m × 12.2 m.
Summary of field operations at Paterson, WA and Urbana, IL for snap bean cover crop trials in 2009 and 2010.

1 Replanted due to cool soil temperatures and poor emergence.
2 Selected treatments only.
3 Only one selected treatment roller-crimped twice.
Four cover crop control methods were tested at each site and the timing of various field operations are listed in Table 1. To terminate cover crops, plots were roller-crimped once or twice, with the second roller crimping 5–10 days (Paterson) or 2–4 days (Urbana) after the first roller-crimping. A tractor-mounted, 3-m-wide roller–crimper, previously described by Davis (Reference Davis2010), was used. Briefly, the roller–crimper consisted of a 3-m-long by 0.45-m-diameter steel cylinder with 7-cm fins protruding at 90° from the cylinder in a chevron pattern; the roller weighed approximately 5000 kg when filled with water. Cover crops were roller-crimped when rye reached 95% anthesis. Rye reached this growth stage at Paterson when common vetch had fully flowered and contained small flat pods, whereas hairy vetch was <50% flowered at Urbana. Because of the difficulty planting into heavy rye residues at Urbana in 2009, glyphosate was applied at 1.1 kg ae ha−1 in an 18 cm band over the soon to be planted four snap bean rows April 14, 2010 at Urbana by using a bicycle sprayer with four drop nozzles spaced 76 cm apart in rye and rye + vetch plots. Rye height averaged 24 cm at the time of the glyphosate application. A third cover crop control treatment consisted of roller crimping once and broadcast application of glyphosate (rye and rye + vetch) or carfentrazone (vetch). A fourth cover crop control treatment was the same as the third treatment, but included a soil residual herbicide (s-metolachlor) tank mixed with the burndown herbicide, followed by handweeding escaped weeds. The fourth treatment served as a weed-free control. Fallow plots also were roller-crimped.
Snap bean var. ‘Sahara’ was planted 3–4 cm deep with a four row no-till planter in rows spaced 76 cm on May 22, 2009 and May 27, 2010 at Paterson and June 2, 2009 and May 26, 2010 at Urbana. A Kinzie no-till planter with fluted coulters, double-disc openers and rubber press wheels was used to plant snap bean at a rate of 144 300 seed ha−1 at Paterson. A Monosem no-till planter with fluted coulters, double-disc openers and rubber press wheels was used at Urbana at a rate of 303 700 seed ha−1. Differences in the planting rates at the two locations were due to differences in the ability to adjust seeding density on each planter. Due to poor emergence and cool weather conditions, snap bean was replanted at Paterson on June 7, 2010.
Data collection
Aboveground biomass of cover crops was collected May 20, 2009 and May 25, 2010 at Paterson by sampling a 1 m2 quadrat in each main plot and May 20, 2009 and May 19, 2010 at Urbana by sampling a 0.25 m2 quadrat in each split plot. Samples were dried at 60°C for 5 days and reweighed to determine oven-dry biomass. At approximately 2 and 4 weeks after herbicide application, cover crop mortality was visually estimated June 8 and 23, 2009 and June 23 and July 8, 2010 at Paterson on a scale of 0 = no response to 100 = all plants dead. Cover crop mortality was visually estimated June 12 and 29, 2009 and June 9 and 28, 2010 at Urbana.
Snap bean population was determined June 8, 2009 and July 8, 2010 at Paterson and June 12, 2009 and June 4, 2010 at Urbana by counting the number of seedlings from the middle two rows of each four row plot by 6 m. Snap bean percent bloom was visually estimated July 8, 2009 and July 27, 2010 at Paterson and July 10, 2009 and June 30, 2010 at Urbana.
Weed population density was recorded June 12, 2009 and June 16, 2010 at Paterson and June 12, 2009 and June 15, 2010 at Urbana by counting all weeds by species from a 1 m2 quadrat placed over the middle two rows in each split plot. Within 1 week of snap bean harvest, final biomass of weeds and escaped cover crop were determined July 24, 2009 and August 20, 2010 at Paterson and July 31, 2009 and July 15, 2010 at Urbana. Biomass of weed species and escaped cover crops was determined by clipping all escaped plants from a randomly placed 1 m2 quadrat in each subplot, separated by species, dried at 65°C and weighed.
Snap bean yield was estimated July 24, 2009 and August 23, 2010 at Paterson and July 27, 2009 and July 19, 2010 at Urbana by hand harvesting all pods from 1.5 m lengths (Paterson) or 1 m lengths (Urbana) of the two middle rows of each subplot and weighing.
Data analysis
Analysis of variance (ANOVA) was performed using PROC GLIMMX procedure in SAS (Statistical Analysis Systems®, 2014, version 9.4, SAS Institute Inc., SAS Campus Drive, Cary, NC 27513, USA) to test for significance (P < 0.05) of years, treatments and their interactions for the response variables recorded. Variations in cover crop species, weed species, planters, weather, soil type and irrigation led to many interactions among locations, years and other measured variables; therefore, each site was analyzed and presented separately considering blocks and years as random factors. Data were pooled across site-years when no significant year-by-treatment interaction was detected. Mean separation was conducted using Tukey–Kramer LSMEANS (P = 0.05). When interactions were significant, LSMEANS tests were performed separately pooling years.
Results and discussion
Cover crop biomass
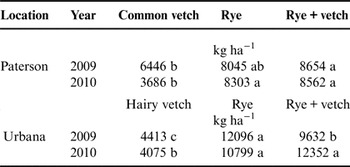
Rye produced 8045 and 8303 kg ha−1 at Paterson, WA in 2009 and 2010, respectively. Common vetch produced 20 and 56% less biomass than rye in 2009 and 2010, respectively (Table 2). Biomass of mixtures of common vetch and rye was similar to rye monoculture in both years. Rye produced 12 096 and 10 752 kg ha−1 at Urbana in 2009 and 2010, respectively. Hairy vetch produced 62–64% less biomass than rye in both years (Table 2). Rye + hairy vetch produced 20% less biomass than rye monoculture in 2009, but in 2010, rye + hairy vetch and rye monoculture produced similar amount of biomass. Using a 50:50 seed mix (by weight), a barley (Hordeum vulgare L.)-hairy vetch mixture produced similar biomass as a barley monoculture in studies by Wayman et al. (Reference Wayman, Cogger, Benedict, Burke, Collins and Bary2014) in Washington State. When testing different proportions of rye and hairy vetch (0–100%), Hayden et al. (Reference Hayden, Ngouajio and Brainard2014) reported total shoot biomass produced in mixes was usually greater than monocultures. Sainju et al. (Reference Sainju, Whitehead and Singh2005) reported greater biomass production from rye + hairy vetch mixtures when seeded at a ratio of 68:32 (by weight), than from monocultures of either species in Georgia.
Dry above ground biomass of fall-planted cover crops at Paterson, WA and Urbana, IL in 2009 and 2010.

Means within a row followed by the same letter are not significantly different according to Tukey–Kramer least significant different test (P = 0.05).
Effects of roller-crimping cover crops
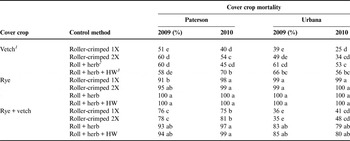
Cover crop mortality was impacted by cover crop species and there was significant cover crop by year and cover crop-by-control method interactions on mortality. At both sites and years, mortality of rye was greater than common vetch or hairy vetch by roller crimping once or twice (Table 3). Leavitt et al. (Reference Leavitt, Sheaffer and Wyse2011) also reported incomplete control of hairy vetch by roller-crimping. Mischler et al. (Reference Mischler, Duiker, Curran and Wilson2010b) reported hairy vetch mortality with a roller–crimper improved after early pod set. Hairy vetch was <50% flowered at Urbana when roller-crimped in these studies, which contributed to poor control. Ideally hairy vetch would have been more developed; however, the advanced growth stage of rye at Urbana complicated waiting longer to roller-crimp. Nonetheless, at the Paterson site, common vetch was in the early pod stage both years and was not controlled well by roller-crimping. Escaped vetch plants also produced seeds, which volunteered in subsequent crops. Wayman et al. (Reference Wayman, Cogger, Benedict, Burke, Collins and Bary2014) reported poor control of vetch species with roller crimping in Washington.
Effect of cover crop control method on cover crop mortality at Paterson, WA and Urbana, IL in 2009 and 2010.

1 Common vetch was planted at Paterson, WA and hairy vetch was planted at Urbana, IL.
2 In monoculture vetch plots, the burndown herbicide was carfentrazone, whereas the herbicide used in rye or rye + vetch was glyphosate.
3 HW = handweeded and also included s-metolachlor tank mixed with the burndown herbicide.
Means within a column followed by a different letter are significantly different according to Tukey–Kramer least significant different test (P = 0.05).
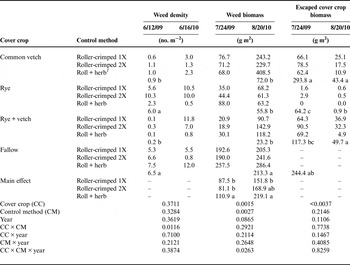
The primary weeds at Paterson were horseweed [Conyza canadensis (L.) Cronq.], large crabgrass [Digitaria sanguinalis (L.) Scop.], hairy nightshade (Solanum physalifolium Rusby) and common lambsquarters (Chenopodium album L.). Early season weed density at Paterson was relatively low in all plots (<6.5 m−2) in 2009 (Table 4). Weed density was greatest in fallow plots and rye treatments (6.0–6.5 m−2), whereas plots containing common vetch averaged <1.0 m−2. However, escaped vetch became a weed and may have contributed to suppression of other weeds. Weed densities were similar among cover crop and control treatments (excluding the weed-free treatment) in 2010. Common vetch may have had less impact on weed density in 2010 due to 43% less vetch biomass produced in 2010 compared to 2009 (Table 2). Weed densities also tended to be greater in 2010 and more variable.
Early season weed density and final season weed and escaped cover crop biomass in snap bean following cover crops and control methods in 2009 and 2010 at Paterson, WA.

1 In monoculture vetch plots, the burndown herbicide was carfentrazone, whereas the herbicide used in rye or rye + vetch was glyphosate.
Snap bean was planted May 22, 2009 and May 27, 2010 and replanted June 17, 2010 and harvested July 27–31, 2009 and August 23, 2010.
Means followed by a different letter within a column and within a main or simple effect are significantly different according to Tukey–Kramer least significant different test (P = 0.05).
Final weed biomass was reduced 66–89% in snap bean following cover crops compared with the fallow treatment, which averaged 213 g m−2 at Paterson in 2009 (Table 4). Escaped common vetch also was present season long and was equal to or greater than the biomass of weeds in 2009 (Table 4). In 2010, common vetch comprised a lower portion of the weed biomass, but still contributed additional competition to snap bean. Common vetch terminated by flail chopping reduced percent weed cover similar to rye and more than hairy vetch in Washington studies (Wayman et al., Reference Wayman, Cogger, Benedict, Burke, Collins and Bary2014). In 2010, only the rye treatment reduced final weed biomass by 73% compared with the fallow treatment.
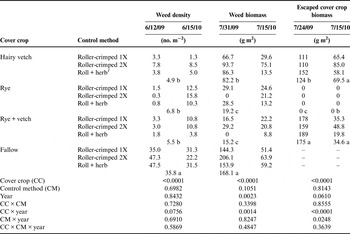
At Urbana, the main weeds present were common purslane (Portulaca oleraccea L.), ivyleaf morningglory (Ipomoea hederacea Jacq.), common dandelion (Taraxacum officinale G.H. Weber ex Wiggers) and common lambsquarters. Cover crop treatments significantly reduced early season weed density, regardless of control method (Table 5). Weed densities averaged 4.9–6.8 weeds m−2; in comparison, the fallow treatment averaged 35.8 weeds m−2 (Table 5).
Early-season weed density and final weed and escaped cover crop biomass in snap bean following cover crop treatments and control methods in 2009–10 at Urbana, IL.

1 In monoculture vetch plots, the burndown herbicide was carfentrazone, whereas the herbicide used in rye or rye + vetch was glyphosate.
Snap bean was planted June 2, 2009 and May 26, 2010 and harvested July 27–31, 2009 and July 19–20, 2010.
Means followed by a different letter within a column and within a main or simple effect are significantly different according to Tukey–Kramer least significant different test (P = 0.05).
Final weed biomass at Urbana was reduced by more than 50% by all cover crop treatments in 2009 compared with the fallow treatment, which averaged 168 g m−2 (Table 5). Rye and the rye + vetch reduced weed biomass the greatest. In 2010, weed biomass was not affected by cover crop treatment, but tended to be lowest in rye or rye + vetch. Mohler and Teasdale (Reference Mohler and Teasdale1993) reported greater weed emergence through hairy vetch residue compared with equal amounts of rye residue. In both years at Urbana, escaped hairy vetch biomass was greater than weed biomass and likely posed significant competition to snap bean plants.
In studies by Hayden et al. (Reference Hayden, Ngouajio and Brainard2014), winter annual weed control in rye + hairy vetch decreased as the proportion of hairy vetch in the mix was increased. Rye reduced weed biomass in our studies in all four site-years and rye biomass was at or above the 8000 kg ha−1, reported as a threshold needed for consistent suppression of annual weeds (Mirsky et al., Reference Mirsky, Ryan, Teasdale, Curran, Reberg-Horton, Spargo, Wells, Keene and Moyer2013). We suspect that part of the weed suppressiveness observed from common and hairy vetch was a result of the competition of escaped vetch with weedy species.
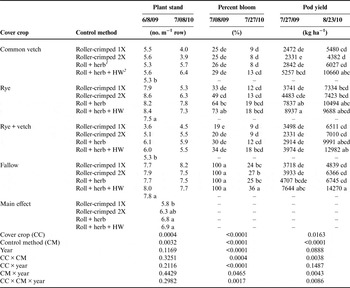
Snap bean population averaged only 6.4 plants m−1 (84 000 plants ha−1) at Paterson both years, well below typical commercial production of 13–26 plants m−1 (Table 6). The relatively low snap bean population at Paterson could be attributed, in part, to low planting rates due to planter limitations, soil type and low soil temperatures. Nevertheless, our stands were comparable to Abdul-Baki and Teasdale (Reference Abdul-Baki and Teasdale1997) and Mwaja et al. (Reference Mwaja, Masiunas and Eastman1996) who reported snap bean populations were not affected by planting into killed hairy vetch residues. In contrast, snap bean populations in our research were lowest following common vetch or rye + vetch mixtures that were roller-crimped, but not treated with herbicides (Table 6). Regardless of treatment, common vetch reduced snap bean population because the planter had difficulty closing seed furrows in the heavy cover crop residues.
Snap bean stand, percent bloom and pod yield following cover crop treatments and control methods in 2009 and 2010 at Paterson, WA.

1 In monoculture vetch plots, the burndown herbicide was carfentrazone, whereas the herbicide used in rye or rye + vetch was glyphosate.
2 HW=handweeded and also included s-metolachlor tank mixed with the burndown herbicide.
Snap bean was planted May 22, 2009 and May 27, 2010 and replanted June 17, 2010.
Means followed by a different letter within a column and within a main or simple effect are significantly different according to Tukey–Kramer least significant different test (P = 0.05).
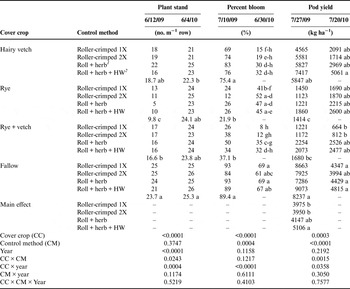
At Urbana, both year and cover crop significantly affected snap bean populations. Snap bean population averaged 17 plants m−1 in 2009 and 24 plants m−1 in 2010 (Table 7). Snap bean populations were lowest (9.8 plants m−1) following rye in 2009 because double-disc openers lining up on the rye row had difficulty penetrating rye roots, and when openers did penetrate, press wheels did not close the seed furrow completely in the high-residue situation. When the disc-openers were off the row, no problems with the seed furrow were observed. In 2010 at Urbana, glyphosate was applied in a narrow band over the snap bean row approximately 6 weeks prior to planting snap bean in plots containing rye and increased snap bean populations (24 plants m−1 row) (Table 7). In these studies, rye was roller-crimped and snap bean planted in the same direction as rye seeding. More recently, Mirsky et al. (Reference Mirsky, Ryan, Teasdale, Curran, Reberg-Horton, Spargo, Wells, Keene and Moyer2013) advised against planting the main crop in the same direction as the rye seeding to avoid the problem we experienced in 2009.
Snap bean stand, percent bloom and pod yield following cover crop treatments and control methods in 2009 and 2010 at Urbana, IL.

1 In monoculture vetch plots, the burndown herbicide was carfentrazone, whereas the herbicide used in rye or rye + vetch was glyphosate.
2 HW=handweeded and also included s-metolachlor tank mixed with the burndown herbicide.
Snap bean was planted June 2, 2009 and May 26, 2010. In 2010, glyphosate was banded over rows to control rye prior to planting snap bean.
Means followed by a different letter within a column and within a main or simple effect are significantly different according to Tukey–Kramer least significant different test (P = 0.05).
In previous studies, snap bean populations direct-seeded into killed hairy vetch were 62% of those planted into conventionally tilled bare soil (Knavel and Heron, Reference Knavel and Heron1986). Soybean (Glycine max) populations were reduced by 60% of targeted plant population when planted into roller-crimped rye (Mischler et al., Reference Mischler, Curran, Duiker and Hyde2010a). Those authors reported earlier termination of rye reduced rye biomass and increased soybean plant populations relative to later termination dates. Soybean populations were reduced 30 and 17% in roller-crimped rye and hairy vetch, respectively, compared with fallow (Davis, Reference Davis2010).
At Paterson, snap bean bloom in July was affected by cover crop, cover crop control method, year and all interactions between these factors. In both years, snap bean bloom was delayed most by cover crop treatments containing common vetch (Table 6). Snap bean bloom also was delayed following rye compared with fallow plots, but not to the extent as when following common vetch.
At Urbana, snap bean bloom was reduced most following cover crop treatments including rye in 2009 and was only slightly delayed when following hairy vetch (Table 7). However, in 2010, bloom was delayed most in snap bean following hairy vetch or rye + vetch. Planting dry bean (P. vulgaris L.) into fall-planted rye residues delayed maturity by 2–6 days in Canadian studies (Blackshaw and Molnar, Reference Blackshaw and Molnar2008) and Mwaja et al. (Reference Mwaja, Masiunas and Eastman1996) reported delayed maturity with no-till snap bean.
At Paterson, snap bean yield was influenced by cover crop and control method; there was a significant cover crop-by-control method interaction. There were also significant year-by-control method and year-by-cover crop-by-control method interactions on snap bean yield (Table 6). Snap bean following common vetch or rye + vetch tended to yield lower even when kept weed-free compared with snap bean following rye or fallow. Snap bean following common vetch controlled by roller crimping either once or twice without a herbicide averaged only 2331–2472 kg ha−1 in 2009 and 4382–5480 kg ha−1 in 2010 due to low plant populations and to competition from both weeds and escaped vetch.
At Urbana, both cover crop and control method influenced snap bean yield and there was a significant cover crop-by-control method interaction. Snap bean after fallow tended to yield the greatest both years at Urbana (Table 7). Snap bean yields were low (<2600 kg ha−1) following all rye containing treatments. In 2009, low snap bean yield following rye in Urbana was believed to be due in part to the low plant populations resulting from poor seed-to-soil contact from planting into heavy rye residues. However, in 2010 when rye was terminated with band-applied glyphosate prior to planting and snap bean populations were increased, snap bean yields still averaged only 2600 kg ha−2 in the hand-weeded treatment. Previous studies have reported yield loss due to N immobilization from high C:N ratio of rye residues (Bottenberg et al., Reference Bottenberg, Masiunas, Eastman and Eastburn1997). Rye biomass at Urbana averaged over 10 700 kg ha−1 in both years. Such high levels of rye biomass likely reduced the availability of N for snap bean in the present work.
In previous research, snap bean yielded greater in conventional tilled plots than when planted into completely controlled rye or hairy vetch (Mwaja et al., Reference Mwaja, Masiunas and Eastman1996). Those authors did not observe increases in disease incidence, stand reductions or problems planting no-till into glyphosate-killed cover crops, but indicated a delay in snap bean maturity following cover crops. Knavel and Heron (Reference Knavel and Heron1986) also reported greater snap bean yield in conventional tilled plots compared to no-till planted into hairy vetch. In those studies, snap bean population was reduced due to difficulty planting into hairy vetch residues despite using a no-till planter. Recent improvements in no-till planter equipment and management of cover crop residues could improve the ability to maintain plant populations in these systems (Mirsky et al., Reference Mirsky, Ryan, Teasdale, Curran, Reberg-Horton, Spargo, Wells, Keene and Moyer2013).
Snap bean was harvested by hand in the current studies, overcoming any potential machine harvest losses or difficulties encountered with heavy cover crop residues or weeds. Commercially grown snap bean is harvested mechanically with large rotating reels with fingers that strip bean pods from the plants. Cover crop plant residues and escaped weeds may slow harvest and increase foreign matter in harvested product.
Effects of addition of herbicides
Common and hairy vetch were not completely controlled by roller crimping even with application of carfentrazone (Table 3). Carfentrazone was selected to control hairy and common vetch rather than glyphosate due to reports of incomplete control of hairy vetch with glyphosate (Shite and Worsham, Reference Shite and Worsham1990). For control of mixtures, glyphosate was used because carfentrazone does not control rye. After roller crimping, control of mixtures with glyphosate was greater than control of common vetch (Paterson) or hairy vetch (Urbana) monocultures with carfentrazone (Table 3). Curran et al. (Reference Curran, Wallace, Mirsky and Crockett2015) also reported incomplete control of hairy vetch with carfentrazone.
Weed biomass was greater when including a burndown herbicide (glyphosate or carfentrazone) with roller crimping compared with roller crimping once or twice at Paterson in 2009 and 2010 (Table 4). We speculate that including the burndown herbicide controlled more of the cover crop, thereby decreasing competition of the cover crop with weeds. In previous research, both rye and hairy vetch residues left on the soil surface reduced weed density in a no-till corn system, but in the absence of a residual herbicide, weed populations increased to a severe level and residues did not always reduce final weed biomass (Teasdale et al., Reference Teasdale, Beste and Potts1991). Weed biomass and density were reduced in soybean direct seeded into a rye cover crop terminated by roller crimping and herbicides in three of four site-years (Mischler et al., Reference Mischler, Curran, Duiker and Hyde2010a).
In 2009 at Paterson, application of glyphosate following roller crimping of rye helped prevent some of the delay in bloom of snap bean observed when only roller crimping rye (Table 6). At Urbana, bloom of snap bean following cover crops controlled by roller crimping (once or twice) without herbicide also tended to be delayed compared to control methods including an herbicide (Table 7). Competition from escaped weeds and escaped vetch likely delayed snap bean bloom in plots where the roller–crimper was used without herbicides.
At Paterson, including herbicides to kill rye improved snap bean yield equal to snap beans following fallow, hand-weeded controls in both years (Table 6). When including an herbicide to kill hairy vetch at Urbana, snap bean yield was comparable with snap bean after fallow (Table 7).
Conclusions
Producing snap beans after cover crops without tillage proved challenging due to escaped vetch plants and heavy rye residue. Although a later planted crop like snap bean allows for increased production of weed-suppressive cover crop biomass in the spring, the large amount of residue complicates planting. Planters can be modified and are available to direct seed into dense cover crop residues (Mirsky et al., Reference Mirsky, Ryan, Teasdale, Curran, Reberg-Horton, Spargo, Wells, Keene and Moyer2013). We used no-till planters in the present studies, but further modifications (increased weight, row cleaners, etc.) might improve the ability to obtain adequate plant populations. Short-maturity rye cultivars are available that may allow for earlier roller-crimping, although cover crop biomass and weed suppressiveness, may be sacrificed (Wells et al., Reference Wells, Brinton and Reberg-Horton2015). Roller-crimped cover crops left on the soil surface suppress weeds, but not to the levels typically observed with residual herbicides or multiple cultivations. In addition, escaped vetch became an additional weed. Growers electing to direct-seed snap bean following these cover crops without herbicides would likely need to invest in specialized high-residue cultivation equipment for season-long control of weeds to prevent crop losses (Carr et al., Reference Carr, Anderson, Lawley, Miller and Zwinger2012; Mirsky et al., Reference Mirsky, Ryan, Teasdale, Curran, Reberg-Horton, Spargo, Wells, Keene and Moyer2013). Overcoming these obstacles is critical for snap bean growers to benefit from the many advantages offered by cover crops in a no-till system.
Acknowledgements
The authors thank AgriNorthwest for providing land and irrigation water for these studies at Paterson, WA. The authors thank Bernardo Chaves-Cordoba for statistical analysis. The authors also thank Encarnacion Rivera, Treva Anderson, Marc Seymour and Jim Moody for technical assistance.