


1 Introduction
The vast role of the ocean in the climate system spans from global processes such as water mass transport, sea level and heat content changes, to small-scale processes such as mixing heat, momentum and air–sea interactions (Siedler et al. Reference Siedler, Griffies, Gould and Church2013). It is common practice to partition the ocean into different time and length scales, as each have unique dynamical, statistical and energetic properties. The large-scale flow is related to smaller-scale flows by transfer of energy between the scales, down to turbulence and the dissipative scales (e.g. Capet et al. Reference Capet, McWilliams, Molemaker and Shchepetkin2008b; Ferrari & Wunsch Reference Ferrari and Wunsch2009; Molemaker, McWilliams & Capet Reference Molemaker, McWilliams and Capet2010; Callies et al. Reference Callies, Flierl, Ferrari and Fox-Kemper2016). Mesoscale eddies span as large as hundreds of kilometres in horizontal length and months in time evolution, and tend to merge, transferring kinetic energy from smaller scales to the larger scales (inverse cascade), and so do not provide an easy route to dissipation (Ferrari & Wunsch Reference Ferrari and Wunsch2009), except through intermittent interactions with boundary layers (Pearson & Fox-Kemper Reference Pearson and Fox-Kemper2018). Consequently, submesoscale currents are thought to be a key component in the forward energy cascade in the ocean (see McWilliams (Reference McWilliams2016), and references therein). They span the range of 0.1–10 km in horizontal scale, 0.01–1 km in vertical scale and hours to days in time evolution. Because of the fast time scale, submesoscales respond faster to atmospheric forcing and play an important role in atmosphere–ocean interactions in the mixed layer (e.g. Bachman et al. Reference Bachman, Fox-Kemper, Taylor and Thomas2017; Renault, McWilliams & Gula Reference Renault, McWilliams and Gula2018). However, for these exact reasons, it has also been challenging to study submesoscale currents, since they are small and impermanent, requiring new strategies for ship surveys, satellite detection and global climate models. Submesoscale length and time scales, together with typical mixed layer stratification and instabilities, complicate the theoretical study of submesoscale dynamics (McWilliams Reference McWilliams2016).
Fronts are an important and ubiquitous submesoscale feature of the upper ocean mixed layer. They are characterized by elongated sharp horizontal density gradients, and an ageostrophic overturning circulation in the interior, working to restore stratification and thermal wind balance, as mixing and strain alter the front. Due to the vertical properties of the ageostrophic overturning circulation, fronts are thought to play an important role in transporting tracers and supplying essential nutrients to marine biology (Mahadevan & Archer Reference Mahadevan and Archer2000; Taylor & Ferrari Reference Taylor and Ferrari2011; Mahadevan Reference Mahadevan2016; Smith, Hamlington & Fox-Kemper Reference Smith, Hamlington and Fox-Kemper2016; Olita et al. Reference Olita, Capet, Claret, Mahadevan, Poulain, Ribotti, Ruiz, Tintoré, Tovar-Sánchez and Pascual2017). The ageostrophic overturning circulation has also recently been shown to be associated with the formation of gravity currents (Pham & Sarkar Reference Pham and Sarkar2018).
The classic inviscid, adiabatic theory (Hoskins & Bretherton Reference Hoskins and Bretherton1972; Hoskins Reference Hoskins1982) of frontal formation, also referred to as frontogenesis, predicts that the cross-frontal scale becomes infinitely thin in finite time. This unphysical outcome does not comply with observations, both in the ocean and atmosphere (e.g. Bond & Fleagle Reference Bond and Fleagle1985; Pollard & Regier Reference Pollard and Regier1992). Frontogenesis occurs in the ocean mixed layer where stratification may be complex, especially including the mixed layer base and connected upper pycnocline, and where the ocean surface is subject to atmospheric forcing by winds and thermal variations, waves and wave breaking, as well as incoming and outgoing radiative energy at short and long wavelengths. Thus, a variety of mixed layer instabilities or forced turbulent mixing affects fronts, many at a scale consistent with the width of observed fronts (Sullivan & McWilliams Reference Sullivan and McWilliams2018). However, no scaling law or uniform understanding of how arrest happens over a variety of turbulent conditions exists, and present submesoscale parameterizations need such a scaling (Fox-Kemper et al. Reference Fox-Kemper, Danabasoglu, Ferrari, Griffies, Hallberg, Holland, Maltrud, Peacock and Samuels2011).
As fronts involve both density and velocity gradients, there are potential roles for both turbulent momentum fluxes (usually simplified here as eddy viscosity) and turbulent heat fluxes (usually simplified here as eddy diffusivity). It is not well understood what kinds of turbulent fluxes may halt frontogenesis and at what scale, and what kinds enhance it and at what rate. For example, vertical mixing has been shown to be important for frontal formation (e.g. Thompson Reference Thompson2000; Nagai, Tandon & Rudnick Reference Nagai, Tandon and Rudnick2006), whereas horizontal mixing is thought to play a role in the arrest process (Sullivan & McWilliams Reference Sullivan and McWilliams2018). Boundary layer mixing, specifically vertical momentum flux, has also been shown to incite frontogenesis through a process called turbulent thermal wind (McWilliams et al. Reference McWilliams, Gula, Molemaker, Renault and Shchepetkin2015).
Much of the original theory of fronts was developed for the atmosphere, where they are critical for the understanding and prediction of weather. For example, a number of atmospheric studies (Nakamura & Held Reference Nakamura and Held1989; Cooper, Thorpe & Bishop Reference Cooper, Thorpe and Bishop1992; Nakamura Reference Nakamura1994; Xu, Gu & Gao Reference Xu, Gu and Gao1998) study frictional potential vorticity (PV) injection, boundary conditions and nonlinear evolution in an evolving Eady (Reference Eady1949) wave, but they are simulation based while the theoretical perturbation approach taken here distinguishes the different viscous and diffusive contributions and boundary condition effects plainly. Rotunno, Skamarock & Snyder (Reference Rotunno, Skamarock and Snyder1994) examine differences between the perfect semi-geostrophic equations and the primitive (effectively, the hydrostatic, Boussinesq) equations, noting that both dissipative terms and non-semi-geostrophic effects contribute. However, our target application is that of fully turbulent, non-hydrostatic, Boussinesq arrest, of the kind studied using large eddy simulations in Suzuki et al. (Reference Suzuki, Fox-Kemper, Hamlington and Van Roekel2016), Sullivan & McWilliams (Reference Sullivan and McWilliams2018) and subsequent studies, where non-hydrostatic boundary layer turbulence arrests frontogenesis within the upper ocean boundary layer. Håkansson (Reference Håkansson2002) illustrates how sensitive the atmospheric application is to the details of vertical friction and diffusivity. The oceanic application requires a still broader consideration of the kinds of turbulence that are possibly significant. While here the theory is illustrated with simple parameterizations of horizontal and vertical eddy diffusivities. Directly comparable to the past atmospheric studies, the approach presented here is readily extended to address the submesoscale (Fox-Kemper et al. Reference Fox-Kemper, Danabasoglu, Ferrari, Griffies, Hallberg, Holland, Maltrud, Peacock and Samuels2011; Bachman et al. Reference Bachman, Fox-Kemper, Taylor and Thomas2017) and Langmuir (Li et al. Reference Li, Reichl, Fox-Kemper, Adcroft, Belcher, Danabasoglu, Grant, Griffies, Hallberg and Hara2019) turbulence found to dominate oceanic boundary layer turbulence.
In this study, we present an analytic method based on perturbation analysis to account for the effects of modest turbulent fluxes on frontal formation. While constant eddy diffusivity and viscosity are utilized as concrete examples here, the approach is easily generalized to other more realistic turbulence closures or to large eddy simulation diagnostic analysis (an ongoing analysis will be reported soon). A complementary diagnostic decomposition approach has recently been proposed (McWilliams Reference McWilliams2017), emphasizing the attribution of causes of frontogenesis to their effects. Here, an asymptotic approach is taken rather than a dynamical decomposition, illuminating different aspects of frontogenesis. In § 2 we review classic frontogenesis theory, present our asymptotic method in § 2.2 and the closed equation set of the modified solution, based on potential vorticity fluxes and boundary conditions, in §§ 2.3 and 2.4. Results are discussed in § 3, together with an analysis concerning localized approximations in §§ 3.1 and 3.2. Lastly, we conclude in § 4, followed by an outline for future work.
2 Theory and methods
The mathematical inviscid, adiabatic framework of strain-induced frontogenesis (Hoskins & Bretherton Reference Hoskins and Bretherton1972; Hoskins Reference Hoskins1982; Shakespeare & Taylor Reference Shakespeare and Taylor2013) describes the formation of fronts when strained by a geostrophically balanced strain flow, such as mesoscale eddies (or synoptic weather in the atmospheric case). Shakespeare & Taylor (Reference Shakespeare and Taylor2013) (hereafter Reference Shakespeare and TaylorST13) generalized the mathematical framework by Hoskins & Bretherton (Reference Hoskins and Bretherton1972) (hereafter Reference Hoskins and BrethertonHB72), to include fronts generated by an unbalanced flow. We follow the formulation presented in Reference Shakespeare and TaylorST13 for a rotating fluid in Cartesian coordinates in an incompressible, hydrostatic, Boussinesq flow on an untilted  $f$-plane. In the limit of Reference Hoskins and BrethertonHB72, the equations reduce to the semi-geostrophic equations suited for describing the early stages of strain-induced frontogenesis. Eddy viscosity and diffusivity are added as new forcing terms, but otherwise this treatment and notation follows Reference Shakespeare and TaylorST13.
The velocity and pressure terms are written as
 $$\begin{eqnarray}\left.\begin{array}{@{}c@{}}U=\bar{U}+u(x,z,t)=-\unicode[STIX]{x1D6FC}x+u(x,z,t),\\ V=\bar{V}+v(x,z,t)=\unicode[STIX]{x1D6FC}y+v(x,z,t),\\ W=0+w(x,z,t),\\ \displaystyle P=\bar{P}+p(x,z,t)=\unicode[STIX]{x1D70C}_{0}\left[-\unicode[STIX]{x1D6FC}^{2}\frac{(x^{2}+y^{2})}{2}+f\unicode[STIX]{x1D6FC}xy\right]+p(x,z,t),\\ B=0+b(x,z,t),\end{array}\right\}\end{eqnarray}$$
where  $\bar{U},\bar{V},\bar{P}$ are the background balanced, horizontal large-scale deformation fields and the associated pressure field respectively. The reference density is
 $\unicode[STIX]{x1D70C}_{0}$,
 $f$ is the Coriolis parameter and
 $u,v,w,p,b$ are the laminar frontogenetic velocity, pressure and buoyancy fields. As appropriate for a mixed layer, upper ocean problem, weak background buoyancy stratification is assumed, so the background pressure field can be thought to occur primarily by sea surface height anomalies. The laminar frontogenetic fields are assumed to be nearly independent of the along-front direction
 $y$, so only
 $\bar{V}$ and
 $\bar{P}$ vary in
 $y$. The strain rate
 $\unicode[STIX]{x1D6FC}$ is taken as a constant, an approximation valid when
 $\unicode[STIX]{x1D6FC}$ represents much larger-scale features, such as mesoscale eddies, that do not vary over the confluence region of the submesoscale front in question. Furthermore, the semi-geostrophic approximation requires that
 $\unicode[STIX]{x1D6FC}/f\ll 1$, which can also be described as a small Rossby number approximation. Note that
 $y$-invariance presumes that the laminar frontogenetic variables represent laminar perturbations to the background flow. All turbulent contributions will be assumed to be scale separated from these laminar flows, and thus treated via parameterization: here eddy viscosity and diffusivity are the explicit parameterization forms carried through the analysis, although generalizations are readily handled with the same methodology. To review, the flow is decomposed as a sum of background (capital letters), laminar frontogenetic (lower case) and turbulent (parameterized so not explicitly part of
 $u,v,w,b,p$, and either frontogenetic or frontolytic) pieces.
It is useful to introduce a vector streamfunction, with a geostrophic (vertical) component  $\unicode[STIX]{x1D6F7}$ (sometimes called ‘velocity potential’), and an ageostrophic (along-front) component
 $\unicode[STIX]{x1D6F9}$. The geostrophic streamfunction component is related to the pressure and horizontal geostrophic velocities by dividing into background and laminar frontogenetic contributions
 $\unicode[STIX]{x1D6F7}=\bar{\unicode[STIX]{x1D719}}+\unicode[STIX]{x1D719}(x,z,t)$,
 $$\begin{eqnarray}\displaystyle \bar{\unicode[STIX]{x1D719}}=\frac{\bar{P}}{\unicode[STIX]{x1D70C}_{0}f}+\unicode[STIX]{x1D6FC}^{2}\frac{(x^{2}+y^{2})}{2f}=\unicode[STIX]{x1D6FC}xy,\quad \unicode[STIX]{x1D719}(x,z,t)=\frac{p(x,z,t)}{\unicode[STIX]{x1D70C}_{0}f}, & & \displaystyle\end{eqnarray}$$
 $$\begin{eqnarray}\displaystyle \frac{\unicode[STIX]{x2202}\bar{\unicode[STIX]{x1D719}}}{\unicode[STIX]{x2202}y}=-\bar{U},\quad \frac{\unicode[STIX]{x2202}\bar{\unicode[STIX]{x1D719}}}{\unicode[STIX]{x2202}x}=\bar{V},\quad \frac{\unicode[STIX]{x2202}\unicode[STIX]{x1D719}}{\unicode[STIX]{x2202}y}=-u_{g}=0,\quad \frac{\unicode[STIX]{x2202}\unicode[STIX]{x1D719}}{\unicode[STIX]{x2202}x}=v_{g}. & & \displaystyle\end{eqnarray}$$
While the ageostrophic, or ‘overturning circulation’, streamfunction component is related to the ageostrophic laminar frontogenetic velocities  $\unicode[STIX]{x1D6F9}=0+\unicode[STIX]{x1D713}(x,z,t)$,
 $$\begin{eqnarray}\displaystyle \frac{\unicode[STIX]{x2202}\unicode[STIX]{x1D713}}{\unicode[STIX]{x2202}z}=u_{a},\quad -\frac{\unicode[STIX]{x2202}\unicode[STIX]{x1D713}}{\unicode[STIX]{x2202}x}=w=w_{a}. & & \displaystyle\end{eqnarray}$$
Please note that to be consistent with Reference Shakespeare and TaylorST13, we follow the left-hand rule definition for the streamfunction, rather than the right-hand rule as defined in Reference Hoskins and BrethertonHB72. Furthermore, here the term ‘secondary’ is avoided as a description of the overturning circulation, as it is easily confused with the order of the perturbation analysis. Likewise, the phrase ‘laminar frontogenetic’ is preferred over the more common ‘perturbation’ velocity because it is easily confused with terms involved in the perturbation method. As in Reference Hoskins and BrethertonHB72, the leading-order along-front laminar frontogenetic velocities are purely geostrophic ( $v\equiv v_{g}$), and the cross-front laminar frontogenetic velocity is a combination of geostrophic and ageostrophic components (
 $u=u_{g}+u_{a}$). The background straining velocity is given by
 $\bar{\unicode[STIX]{x1D719}}$ alone.
Similar to Reference Shakespeare and TaylorST13, the governing equations for the two-dimensional laminar frontogenetic response to the background flow can be expanded out from the definitions above, assuming hydrostatic, laminar flow. Here we include the novel addition of an eddy diffusive flux  $F(b)$ and viscous flux
 $F(u),F(v)$. For now, these are written in a form amenable to accommodate most present parameterizations, including spatial variation, non-local fluxes and tensor character (Large, McWilliams & Doney Reference Large, McWilliams and Doney1994; Griffies Reference Griffies1998; Fox-Kemper, Ferrari & Hallberg Reference Fox-Kemper, Ferrari and Hallberg2008; Bachman, Fox-Kemper & Bryan Reference Bachman, Fox-Kemper and Bryan2015; Bachman et al. Reference Bachman, Fox-Kemper, Taylor and Thomas2017).
 $$\begin{eqnarray}\displaystyle & \displaystyle \frac{\text{D}u}{\text{D}t}-fv=\unicode[STIX]{x1D6FC}u-\frac{1}{\unicode[STIX]{x1D70C}_{0}}\frac{\unicode[STIX]{x2202}p}{\unicode[STIX]{x2202}x}+\unicode[STIX]{x1D735}\boldsymbol{\cdot }F(u), & \displaystyle\end{eqnarray}$$
 $$\begin{eqnarray}\displaystyle & \displaystyle \frac{\text{D}v}{\text{D}t}+fu=-\unicode[STIX]{x1D6FC}v+\unicode[STIX]{x1D735}\boldsymbol{\cdot }F(v), & \displaystyle\end{eqnarray}$$
 $$\begin{eqnarray}\displaystyle & \displaystyle 0=b-\frac{1}{\unicode[STIX]{x1D70C}_{0}}\frac{\unicode[STIX]{x2202}p}{\unicode[STIX]{x2202}z}, & \displaystyle\end{eqnarray}$$
 $$\begin{eqnarray}\displaystyle & \displaystyle \frac{\text{D}b}{\text{D}t}=\unicode[STIX]{x1D735}\boldsymbol{\cdot }F(b), & \displaystyle\end{eqnarray}$$
 $$\begin{eqnarray}\displaystyle & \displaystyle \frac{\unicode[STIX]{x2202}u}{\unicode[STIX]{x2202}x}+\frac{\unicode[STIX]{x2202}w}{\unicode[STIX]{x2202}z}=0, & \displaystyle\end{eqnarray}$$
 $b$ is the buoyancy and from (2.5c) and (2.2) we have the relation
 $$\begin{eqnarray}\frac{\unicode[STIX]{x2202}\unicode[STIX]{x1D719}}{\unicode[STIX]{x2202}z}=\frac{b}{f}.\end{eqnarray}$$
The material derivative is defined as
 $$\begin{eqnarray}\frac{\text{D}}{\text{D}t}\equiv \frac{\unicode[STIX]{x2202}}{\unicode[STIX]{x2202}t}+(u+\bar{U})\frac{\unicode[STIX]{x2202}}{\unicode[STIX]{x2202}x}+w\frac{\unicode[STIX]{x2202}}{\unicode[STIX]{x2202}z}.\end{eqnarray}$$
Equation (2.5e) will be automatically satisfied if the streamfunctions  $\unicode[STIX]{x1D719}$ and
 $\unicode[STIX]{x1D713}$ are chosen as the prognostic variables instead of
 $u,v,w$.
For concreteness, we will assume in the following that the viscous and diffusive fluxes can be written as horizontal and vertical fluxes, assumed to be down gradient with constant viscosities and diffusivities
 $$\begin{eqnarray}\displaystyle & \displaystyle F(u)=\hat{x}\unicode[STIX]{x1D708}_{H}\frac{\unicode[STIX]{x2202}u}{\unicode[STIX]{x2202}x}+\hat{z}\unicode[STIX]{x1D708}_{V}\frac{\unicode[STIX]{x2202}u}{\unicode[STIX]{x2202}z}, & \displaystyle\end{eqnarray}$$
 $$\begin{eqnarray}\displaystyle & \displaystyle F(v)=\hat{x}\unicode[STIX]{x1D708}_{H}\frac{\unicode[STIX]{x2202}v}{\unicode[STIX]{x2202}x}+\hat{z}\unicode[STIX]{x1D708}_{V}\frac{\unicode[STIX]{x2202}v}{\unicode[STIX]{x2202}z}, & \displaystyle\end{eqnarray}$$
 $$\begin{eqnarray}\displaystyle & \displaystyle F(b)=\hat{x}\unicode[STIX]{x1D705}_{H}\frac{\unicode[STIX]{x2202}b}{\unicode[STIX]{x2202}x}+\hat{z}\unicode[STIX]{x1D705}_{V}\frac{\unicode[STIX]{x2202}b}{\unicode[STIX]{x2202}z}. & \displaystyle\end{eqnarray}$$
Consistent with assuming that the laminar fields do not vary in  $y$, we assume that turbulent fluxes are statistically homogeneous in
 $y$ and thus the
 ${\hat{y}}$ component can be ignored. One might be tempted to suggest that molecular viscosity and diffusivity might be used here, but we will soon see that asymptotic ordering demands an upper and a lower limit on Reynolds and Péclet number, so keep in mind that these terms are intended as turbulence parameterizations.
Within the mixed layer, these fluxes are assumed to be a direct result of turbulence, whereas in the very near-surface boundary they can be matched to applied wind shear ( $\unicode[STIX]{x1D70F}/\unicode[STIX]{x1D70C}_{0}$) and thermodynamic forcing (
 $Q$) via frictional and diabatic flux boundary conditions
 $$\begin{eqnarray}\displaystyle & \displaystyle \frac{\unicode[STIX]{x1D70F}_{x}}{\unicode[STIX]{x1D70C}_{0}}=\hat{z}\unicode[STIX]{x1D708}_{V}\frac{\unicode[STIX]{x2202}u}{\unicode[STIX]{x2202}z}, & \displaystyle\end{eqnarray}$$
 $$\begin{eqnarray}\displaystyle & \displaystyle \frac{\unicode[STIX]{x1D70F}_{y}}{\unicode[STIX]{x1D70C}_{0}}=\hat{z}\unicode[STIX]{x1D708}_{V}\frac{\unicode[STIX]{x2202}v}{\unicode[STIX]{x2202}z}, & \displaystyle\end{eqnarray}$$
 $$\begin{eqnarray}\displaystyle & \displaystyle Q=\hat{z}\unicode[STIX]{x1D705}_{V}\frac{\unicode[STIX]{x2202}b}{\unicode[STIX]{x2202}z}. & \displaystyle\end{eqnarray}$$
2.1 Dimensionless expressions
Following Reference Shakespeare and TaylorST13, we use the following scales to make the perturbation field equations dimensionless: the horizontal and vertical buoyancy gradients ( $M^{2}=\unicode[STIX]{x2202}b/\unicode[STIX]{x2202}y$ and
 $N^{2}=\unicode[STIX]{x2202}b/\unicode[STIX]{x2202}z$, which is also the buoyancy frequency squared), the horizontal and vertical length scales (
 $L,H$) and the strain and Coriolis rate parameters (
 $\unicode[STIX]{x1D6FC},f$). The dimensionless expressions for quantities of interest are given in table 1. As in Reference Shakespeare and TaylorST13, the vertical dimensionless coordinate ranges from
 $0$ to
 $1$,
 $0$ being the bottom of the mixed layer and
 $1$ the surface. The cross-frontal coordinate is centred around the initial front maximum. We focus on the semi-geostrophic limit for the background and laminar frontogenetic velocities, which implies that the along-front velocity is purely geostrophic, and it is scaled accordingly. The cross-front horizontal velocity scaling is assumed to be consistent with the conversion of potential energy being the primary source for the frontal overturning kinetic energy
 $bH\sim U^{2}$ (e.g. Suzuki et al. Reference Suzuki, Fox-Kemper, Hamlington and Van Roekel2016).
Dimensionless expressions for quantities of interest following Reference Shakespeare and TaylorST13 framework in the semi-geostrophic limit, which implies that the along-front velocity is purely geostrophic.

The dimensionless versions of (2.5b) and (2.5d) are, after reorganizing,
 $$\begin{eqnarray}\displaystyle & \displaystyle \left[\frac{\unicode[STIX]{x2202}}{\unicode[STIX]{x2202}t}+(Ro\,u+\unicode[STIX]{x1D6FE}\bar{U})\frac{\unicode[STIX]{x2202}}{\unicode[STIX]{x2202}x}+Ro\,w\frac{\unicode[STIX]{x2202}}{\unicode[STIX]{x2202}z}\right]v=-\frac{1}{Ro}u-\unicode[STIX]{x1D6FE}v+\left(\frac{Ro^{2}}{Re_{H}}\right)\frac{\unicode[STIX]{x2202}^{2}v}{\unicode[STIX]{x2202}x^{2}}+\left(\frac{Ro^{2}}{Re_{V}}\right)\frac{\unicode[STIX]{x2202}^{2}v}{\unicode[STIX]{x2202}z^{2}}, & \displaystyle \nonumber\\ \displaystyle & & \displaystyle\end{eqnarray}$$
 $$\begin{eqnarray}\displaystyle & \displaystyle \left[\frac{\unicode[STIX]{x2202}}{\unicode[STIX]{x2202}t}+(Ro~u+\unicode[STIX]{x1D6FE}\bar{U})\frac{\unicode[STIX]{x2202}}{\unicode[STIX]{x2202}x}+Ro~w\frac{\unicode[STIX]{x2202}}{\unicode[STIX]{x2202}z}\right]b=\left(\frac{Ro^{2}}{Pe_{H}}\right)\frac{\unicode[STIX]{x2202}^{2}b}{\unicode[STIX]{x2202}x^{2}}+\left(\frac{Ro^{2}}{Pe_{V}}\right)\frac{\unicode[STIX]{x2202}^{2}b}{\unicode[STIX]{x2202}z^{2}}. & \displaystyle\end{eqnarray}$$
The dimensionless relations for  $\unicode[STIX]{x1D719},\unicode[STIX]{x1D713},b$ and the velocities are
 $$\begin{eqnarray}u=\frac{\unicode[STIX]{x2202}\unicode[STIX]{x1D713}}{\unicode[STIX]{x2202}z},\quad \frac{\unicode[STIX]{x2202}\unicode[STIX]{x1D719}}{\unicode[STIX]{x2202}x}=v,\quad w=-\frac{\unicode[STIX]{x2202}\unicode[STIX]{x1D713}}{\unicode[STIX]{x2202}x},\quad \frac{\unicode[STIX]{x2202}\unicode[STIX]{x1D719}}{\unicode[STIX]{x2202}z}=b.\end{eqnarray}$$
Based on these scalings, the error made in assuming  $v$ is geostrophic rather than using all of (2.5a) is
 $O(Ro)$, following the approach to the semi-geostrophic equations of Hoskins (Reference Hoskins1975). This assumption implies that if the turbulent flux terms are to contribute significantly when compared to the neglected ageostrophic terms in (2.5a), at least one of
 $Re_{H},Re_{v},Pe_{H}$ or
 $Pe_{V}$ should be smaller than
 $Ro$, which is a small parameter. Thus, at least one dissipative term must arise as an eddy parameterization, rather than through molecular values with Reynolds and Péclet numbers much larger than one. For the purposes of this paper, qualitative inferences of the effects of turbulent fluxes are sought, but in ongoing work diagnosing large eddy simulations, a comparison of the laminar frontogenetic velocities to resolved turbulence is being evaluated directly.
Following Hoskins (Reference Hoskins1982), we take the  $z$ derivative of (2.12a) and the
 $x$ derivative of (2.12b), and using (2.13), reduce to one equation, representing the instantaneous ageostrophic streamfunction governed by the strain field, geostrophic field and turbulent flux terms
 $$\begin{eqnarray}\displaystyle & & \displaystyle \frac{\unicode[STIX]{x2202}^{2}\unicode[STIX]{x1D719}}{\unicode[STIX]{x2202}z^{2}}\frac{\unicode[STIX]{x2202}^{2}\unicode[STIX]{x1D713}}{\unicode[STIX]{x2202}x^{2}}-2\frac{\unicode[STIX]{x2202}^{2}\unicode[STIX]{x1D719}}{\unicode[STIX]{x2202}z\unicode[STIX]{x2202}x}\frac{\unicode[STIX]{x2202}^{2}\unicode[STIX]{x1D713}}{\unicode[STIX]{x2202}x\unicode[STIX]{x2202}z}+\left(\frac{\unicode[STIX]{x2202}^{2}\unicode[STIX]{x1D719}}{\unicode[STIX]{x2202}x^{2}}+\frac{1}{Ro^{2}}\right)\frac{\unicode[STIX]{x2202}^{2}\unicode[STIX]{x1D713}}{\unicode[STIX]{x2202}z^{2}}\nonumber\\ \displaystyle & & \displaystyle \quad =-\frac{2\unicode[STIX]{x1D6FE}}{Ro}\frac{\unicode[STIX]{x2202}^{2}\unicode[STIX]{x1D719}}{\unicode[STIX]{x2202}x\unicode[STIX]{x2202}z}+\left(\frac{Ro}{Re_{H}}\right)\frac{\unicode[STIX]{x2202}^{4}\unicode[STIX]{x1D719}}{\unicode[STIX]{x2202}x^{3}\unicode[STIX]{x2202}z}+\left(\frac{Ro}{Re_{V}}\right)\frac{\unicode[STIX]{x2202}^{4}\unicode[STIX]{x1D719}}{\unicode[STIX]{x2202}z^{3}\unicode[STIX]{x2202}x}-\left(\frac{Ro}{Pe_{H}}\right)\frac{\unicode[STIX]{x2202}^{4}\unicode[STIX]{x1D719}}{\unicode[STIX]{x2202}x^{3}\unicode[STIX]{x2202}z}-\left(\frac{Ro}{Pe_{V}}\right)\frac{\unicode[STIX]{x2202}^{4}\unicode[STIX]{x1D719}}{\unicode[STIX]{x2202}z^{3}\unicode[STIX]{x2202}x}.\nonumber\\ \displaystyle & & \displaystyle\end{eqnarray}$$
In Reference Shakespeare and TaylorST13 and Reference Hoskins and BrethertonHB72 an analytic solution is obtained by assuming zero or uniform PV everywhere in the domain. This class of solutions will be the zeroth-order starting point for the perturbation analysis here.
2.2 Perturbation analysis
For a small term  $\unicode[STIX]{x1D700}$ we use perturbation analysis to account for the effects of turbulence. We construct the zeroth-order solution to contain all the leading-order laminar frontogenetic dynamics described in Reference Shakespeare and TaylorST13 and Reference Hoskins and BrethertonHB72. Additionally, the background flow (i.e.
 $\bar{U},\bar{V}$) is also part of the zeroth order, so for the inviscid, adiabatic, zeroth-order limit a zero PV valid solution exists.
 $$\begin{eqnarray}\left.\begin{array}{@{}c@{}}U=\bar{U}+u=\unicode[STIX]{x1D700}^{0}(\bar{U}+u^{0})+\unicode[STIX]{x1D700}^{1}u^{1}+O(\unicode[STIX]{x1D700}^{2}),\\ V=\bar{V}+v=\unicode[STIX]{x1D700}^{0}(\bar{V}+v^{0})+\unicode[STIX]{x1D700}^{1}v^{1}+O(\unicode[STIX]{x1D700}^{2}),\\ W=w=\unicode[STIX]{x1D700}^{0}w^{0}+\unicode[STIX]{x1D700}^{1}w^{1}+O(\unicode[STIX]{x1D700}^{2}),\\ \unicode[STIX]{x1D6F7}=\bar{\unicode[STIX]{x1D719}}+\unicode[STIX]{x1D719}=\unicode[STIX]{x1D700}^{0}(\bar{\unicode[STIX]{x1D719}}+\unicode[STIX]{x1D719}^{0})+\unicode[STIX]{x1D700}^{1}\unicode[STIX]{x1D719}^{1}+O(\unicode[STIX]{x1D700}^{2}),\\ b=\unicode[STIX]{x1D700}^{0}b^{0}+\unicode[STIX]{x1D700}^{1}b^{1}+O(\unicode[STIX]{x1D700}^{2}).\end{array}\right\}\end{eqnarray}$$
At the first order, the effects of turbulence (2.8)–(2.10) and the associated surface forcing (2.11a)–(2.11c) on the laminar frontogenetic flow will be isolated and examined.
We will now study individually horizontal and vertical viscosity and diffusivity. For each case the small perturbation parameter  $\unicode[STIX]{x1D700}$ is defined by
 $$\begin{eqnarray}\left.\begin{array}{@{}c@{}}\displaystyle \unicode[STIX]{x1D700}_{HV}=\frac{Ro}{Re_{H}}=Ek_{H}:\quad \text{Horizontal viscosity (HV)},\\ \displaystyle \unicode[STIX]{x1D700}_{VV}=\frac{Ro}{Re_{V}}=Ek_{V}:\quad \text{Vertical viscosity (VV)},\\ \displaystyle \unicode[STIX]{x1D700}_{HD}=\frac{Ro}{Pe_{H}}=\frac{Ek_{H}}{Pr_{H}}:\quad \text{Horizontal diffusivity (HD)},\\ \displaystyle \unicode[STIX]{x1D700}_{VD}=\frac{Ro}{Pe_{V}}=\frac{Ek_{V}}{Pr_{V}}:\quad \text{Vertical diffusivity (VD)},\end{array}\right\}\end{eqnarray}$$
where  $Ek_{H}=Ro/Re_{H}=\unicode[STIX]{x1D708}/fL^{2},~Ek_{V}=Ro/Re_{V}=\unicode[STIX]{x1D708}/fH^{2}$ and
 $Pr_{H}=\unicode[STIX]{x1D708}_{H}/\unicode[STIX]{x1D705}_{H},Pr_{V}=\unicode[STIX]{x1D708}_{V}/\unicode[STIX]{x1D705}_{V}$ are the horizontal and vertical Ekman and Prandtl numbers. For small Ekman numbers and
 $O(1)$ Prandtl numbers, these terms are all expected to be small. However, depending on the details of the type of turbulence approximated, it may be expected that they may not be the same size. We proceed asymptotically by assuming they are all small and of equal order, and then after the asymptotic perturbation expansion we can choose to individually neglect them.
Using the eddy viscosity and diffusivity parameterizations (2.8)–(2.10), these small parameters appear before the terms of highest differential order. Hence, there will always be some small ‘frictional sublayer’ scale on which they are not small and they enlarge near the boundaries to satisfy the boundary conditions (2.11a)–(2.11c). A similarity or asymptotic matching solution may thus be more appropriate as an asymptotic approach in order to ‘magnify’ the sublayer region and examine potentially leading-order impacts outside the sublayer. However, other parameterizations of turbulence differ in differential order, e.g. a Newtonian drag as used in some eddy-damping boundary layer schemes (e.g. Parsons Reference Parsons1969; Fox-Kemper & Ferrari Reference Fox-Kemper and Ferrari2009) or Newtonian cooling as sometimes used in air–sea damping schemes (e.g. Dijkstra & Molemaker Reference Dijkstra and Molemaker1997) or linear drag as through parameterized Ekman layer pumping (Twigg & Bannon Reference Twigg and Bannon1998; Boutle, Belcher & Plant Reference Boutle, Belcher and Plant2015). Thus, the detailed asymptotics within the frictional boundary layer will be specific to the differential form of the parameterization – here eddy viscosity and diffusivity, but not generically those forms. Furthermore, the true ocean boundary has a wavy–frothy–bubbly sublayer for which there exist numerical approaches but not analytic ones. For these reasons, the effects of eddy viscosity and diffusivity in a specific frictional sublayer analysis are not the focus of this study. Rather, it is the intention here that the singular perturbation implied by neglecting these highest-derivative-order terms (i.e. as  $\unicode[STIX]{x1D700}\rightarrow 0$) be equivalent to the traditional solution of the classic inviscid, adiabatic frontogenesis theory, and may be used as a guide to later analyse realistic turbulent frontal simulations.
Thus, equation (2.14) is solved assuming an ansatz of regular perturbation analysis, and that the solution exists outside the frictional sublayer, affected only at first order by the turbulence there. We insert (2.15) above into (2.14) found in the previous section and separate by order of  $\unicode[STIX]{x1D700}$.
2.2.1 Zeroth order: inviscid, adiabatic
This order is the traditional frontogenesis regime, as studied by Reference Hoskins and BrethertonHB72 and Reference Shakespeare and TaylorST13. Typically, a zero or uniform potential vorticity is assumed to arrive at a simpler solution. We will preserve this assumption for the zeroth order, but it will be revisited in the context of turbulent fluxes and potential vorticity anomalies and injection below. Additionally, to ensure consistency with the limitation of the Hoskins (Reference Hoskins1975) semi-geostrophic assumption and asymptotic theory, we confine this analysis to  $\unicode[STIX]{x1D6FE}=O(Ro^{2})$ and
 $Ro<\unicode[STIX]{x1D700}<O(Ro^{-2})$. However, as both
 $Ro$ and
 $\unicode[STIX]{x1D700}$ must be small parameters, a tighter bound actually applies:
 $Ro<\unicode[STIX]{x1D700}<1$. The zeroth-order equation for the streamfunction, equation (2.14), equivalent to Reference Hoskins and BrethertonHB72, is
 $$\begin{eqnarray}\frac{\unicode[STIX]{x2202}^{2}\unicode[STIX]{x1D719}^{0}}{\unicode[STIX]{x2202}z^{2}}\frac{\unicode[STIX]{x2202}^{2}\unicode[STIX]{x1D713}^{0}}{\unicode[STIX]{x2202}x^{2}}-2\frac{\unicode[STIX]{x2202}^{2}\unicode[STIX]{x1D719}^{0}}{\unicode[STIX]{x2202}z\unicode[STIX]{x2202}x}\frac{\unicode[STIX]{x2202}^{2}\unicode[STIX]{x1D713}^{0}}{\unicode[STIX]{x2202}x\unicode[STIX]{x2202}z}+\left(\frac{\unicode[STIX]{x2202}^{2}\unicode[STIX]{x1D719}^{0}}{\unicode[STIX]{x2202}x^{2}}+\frac{1}{Ro^{2}}\right)\frac{\unicode[STIX]{x2202}^{2}\unicode[STIX]{x1D713}^{0}}{\unicode[STIX]{x2202}z^{2}}=-\frac{2\unicode[STIX]{x1D6FE}}{Ro^{2}}\frac{\unicode[STIX]{x2202}^{2}\unicode[STIX]{x1D719}^{0}}{\unicode[STIX]{x2202}x\unicode[STIX]{x2202}z}.\end{eqnarray}$$
Reference Shakespeare and TaylorST13 introduced a new coordinate system, similar to the geostrophic momentum coordinate in Reference Hoskins and BrethertonHB72,
 $$\begin{eqnarray}X=\text{e}^{\unicode[STIX]{x1D6FC}t}\left(x+\frac{v^{0}}{f}\right),\quad Z=z,\quad T=t.\end{eqnarray}$$
This  $X$ coordinate is conserved for any value
 $\unicode[STIX]{x1D6FC}$ and is referred to as the ‘generalized momentum coordinate’. A similar expression for the vertical coordinate is desirable when the scale of gradient sharpening in the vertical is comparable to the horizontal (e.g. McWilliams, Molemaker & Olafsdottir Reference McWilliams, Molemaker and Olafsdottir2009). Here we assume frontal sharpening is dominated by the horizontal strain field, and thus strictly use the horizontal form of the generalized momentum coordinate. Note that since Reference Shakespeare and TaylorST13 solve the inviscid non-diffusive case, this coordinate system is associated with the zeroth-order solution.
The dimensionless form of this coordinate system is
 $$\begin{eqnarray}X=\text{e}^{\unicode[STIX]{x1D6FE}T}(x+Ro\,v^{0}),\quad Z=z,\quad T=t.\end{eqnarray}$$
In this new coordinate system, which tracks the Lagrangian displacements in  $x$, the dimensionless material derivative reduces to
 $$\begin{eqnarray}\frac{\text{D}}{\text{D}t}=\frac{\unicode[STIX]{x2202}}{\unicode[STIX]{x2202}T}+Ro\,w^{0}\frac{\unicode[STIX]{x2202}}{\unicode[STIX]{x2202}Z}.\end{eqnarray}$$
And the dimensionless Jacobian for this transformation is
 $$\begin{eqnarray}J=\text{e}^{\unicode[STIX]{x1D6FE}T}\left(1-\text{e}^{\unicode[STIX]{x1D6FE}T}Ro\frac{\unicode[STIX]{x2202}v^{0}}{\unicode[STIX]{x2202}X}\right)^{-1}.\end{eqnarray}$$
The solution for all the zeroth-order terms, assuming zero PV, are given in Reference Shakespeare and TaylorST13. The buoyancy field is defined as
 $$\begin{eqnarray}b^{0}(X,Z,T)=B_{0}(X)+Fr^{-2}Z+\unicode[STIX]{x0394}b^{0}(X,Z,T),\end{eqnarray}$$
where  $B_{0}(X)$ is the initial imposed buoyancy field as a function of
 $X$, chosen to be
 $B_{0}(X)=\frac{1}{2}\text{erf}(X/\sqrt{2})$. For simplicity, we take the Reference Hoskins and BrethertonHB72 scenario (for which
 $v=v_{g}$) and the corresponding solution from Reference Shakespeare and TaylorST13 is the following:
 $$\begin{eqnarray}\displaystyle & \displaystyle u^{0}=-\text{e}^{\unicode[STIX]{x1D6FE}T}Ro\,B_{0}^{\prime }(X)(Ro\,w+(2Z-1)\unicode[STIX]{x1D6FE}), & \displaystyle\end{eqnarray}$$
 $$\begin{eqnarray}\displaystyle & \displaystyle w^{0}=Ro\,\unicode[STIX]{x1D6FE}\,B_{0}^{\prime \prime }(X)Z(Z-1)\text{e}^{2\unicode[STIX]{x1D6FE}T}\left(1-Ro\text{e}^{\unicode[STIX]{x1D6FE}T}\frac{\unicode[STIX]{x2202}v^{0}}{\unicode[STIX]{x2202}X}\right)^{-1}, & \displaystyle\end{eqnarray}$$
 $$\begin{eqnarray}\displaystyle & \displaystyle v^{0}=\text{e}^{\unicode[STIX]{x1D6FE}T}Ro\,B_{0}^{\prime }(X)\left(Z-{\textstyle \frac{1}{2}}\right). & \displaystyle\end{eqnarray}$$
The criterion in Reference Shakespeare and TaylorST13 for frontal singularity is that the transformation no longer holds, i.e. the inverse of the Jacobian vanishes  $(J^{-1}=\text{e}^{-\unicode[STIX]{x1D6FE}T}-Ro\,\unicode[STIX]{x2202}v^{0}/\unicode[STIX]{x2202}X)$. This happens when
 $B_{0}^{\prime \prime \prime }(X_{f})=0$. For the Reference Hoskins and BrethertonHB72 case, the singularity forms at the critical time of
 $t=19.8$, and the Eulerian location of this singularity is found to be
 $$\begin{eqnarray}x_{f}=Ro\frac{1}{\sqrt{2\unicode[STIX]{x1D6FD}}}(X_{f}\,\unicode[STIX]{x1D6FD}+B_{0}^{\prime }(X_{f})),\end{eqnarray}$$
where  $\unicode[STIX]{x1D6FD}=-B_{0}^{\prime \prime }(X)>0$. Note that we expect
 $x_{f}$ to appear in two locations: one at the surface, cold-side corner of the front in the mixed layer (
 $x_{fs}$) and the other at the base, warm-side corner of the front (
 $x_{fb}$).
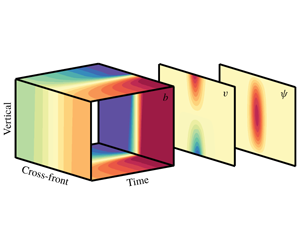
Frontal formation of the dimensionless zeroth-order buoyancy field (a), together with the cross-frontal planes showing the along-front velocity  $v$ (b), and overturning streamfunction
 $\unicode[STIX]{x1D713}$ (c). The cross-frontal, vertical and time axes correspond to the dimensionless
 $x,z$ and
 $t$ axes respectively.

Cross-frontal profiles of the zeroth-order along-front velocity  $v^{0}$ (shading) at two times defined as early frontogenesis (
 $t=5$, a) and late frontogenesis (
 $t=18$, b). Note the different colour bar axes. Superimposed in black contours is the buoyancy field, with intervals of 0.1 in non-dimensional units. Note the singularity developing during late frontogenesis. Here,
 $x$ and
 $z$ are the dimensionless cross-frontal and vertical axes, respectively, in real space.

Figure 1 illustrates the dynamical formation (in real space) of frontogenesis with the buoyancy field, and the emergence of the along-front velocity and cross-frontal overturning streamfunction. We follow Reference Shakespeare and TaylorST13 in choosing  $Ro=0.4,\unicode[STIX]{x1D6FE}=0.1$ as an example for the Reference Hoskins and BrethertonHB72 case. As frontogenesis progresses, the imposed strain enhances the buoyancy gradient, which, through thermal wind balance, strengthens the along-front shear (figure 2). A useful diagnostic measure for frontal tendency is the Lagrangian evolution of the horizontal buoyancy gradient
 $$\begin{eqnarray}T_{b}^{0}=\frac{\text{D}}{\text{D}t}\frac{1}{2}\left(\frac{\unicode[STIX]{x2202}b^{0}}{\unicode[STIX]{x2202}x}\right)^{2}\end{eqnarray}$$
(Hoskins Reference Hoskins1982; McWilliams et al. Reference McWilliams, Gula, Molemaker, Renault and Shchepetkin2015), shown in figure 3. Positive frontal tendency coincides with the largest buoyancy gradient, and in late frontogenesis a negative frontal tendency adjacent to the front maximum, contributes to the sharpening the front, eventually leading to singularity. An ageostrophic overturning circulation appears in the cross-frontal plane, attempting to re-stratify the front, further contributing to frontogenesis (figure 4). The positive overturning streamfunction in figure 4 indicates a counterclockwise overturning, which is in the direction to move buoyant water over dense and stratify the frontal region. However, as the frontal region is somewhat wider than the overturning, the upper left (upper, cold-side) and lower right (lower, warm-side) buoyancy gradients are concentrated more than other regions of the front. Illustrated in figures 2(b) and 4(b), as frontogenesis progresses, the ageostrophic streamfunction strengthens and narrows, and the along-front velocity gets pinched to two points at the top, cold-side corner and bottom, warm-side corner of the frontal region of the mixed layer, and the buoyancy gradient strengthens and isopycnals come closer together and tilt – especially in these two corners, consistent with the locations of maximum frontal tendency (figure 3). The zeroth-order solution continues to strengthen and narrow, and becomes singular at these two points within a finite time. In the following section, the first-order solution effects on this process are shown.
Contours show buoyancy as in figure 2, shading shows the zeroth-order frontal tendency  $T_{b}^{0}$.

Contours show buoyancy as in figure 2, shading shows the zeroth-order streamfunction  $\unicode[STIX]{x1D713}^{0}$.

2.2.2 First order: turbulent fluxes
The first-order equation for the streamfunction given by (2.14) will be slightly different, depending on the type of forcing at hand
 $$\begin{eqnarray}\displaystyle & & \displaystyle \frac{\unicode[STIX]{x2202}^{2}\unicode[STIX]{x1D719}^{0}}{\unicode[STIX]{x2202}z^{2}}\frac{\unicode[STIX]{x2202}^{2}\unicode[STIX]{x1D713}^{1}}{\unicode[STIX]{x2202}x^{2}}-2\frac{\unicode[STIX]{x2202}^{2}\unicode[STIX]{x1D719}^{0}}{\unicode[STIX]{x2202}z\unicode[STIX]{x2202}x}\frac{\unicode[STIX]{x2202}^{2}\unicode[STIX]{x1D713}^{1}}{\unicode[STIX]{x2202}x\unicode[STIX]{x2202}z}+\left(\frac{\unicode[STIX]{x2202}^{2}\unicode[STIX]{x1D719}^{0}}{\unicode[STIX]{x2202}x^{2}}+\frac{1}{Ro^{2}}\right)\frac{\unicode[STIX]{x2202}^{2}\unicode[STIX]{x1D713}^{1}}{\unicode[STIX]{x2202}z^{2}}\nonumber\\ \displaystyle & & \displaystyle \quad =-\frac{\unicode[STIX]{x2202}^{2}\unicode[STIX]{x1D719}^{1}}{\unicode[STIX]{x2202}x^{2}}\frac{\unicode[STIX]{x2202}^{2}\unicode[STIX]{x1D713}^{0}}{\unicode[STIX]{x2202}z^{2}}+2\frac{\unicode[STIX]{x2202}^{2}\unicode[STIX]{x1D719}^{1}}{\unicode[STIX]{x2202}z\unicode[STIX]{x2202}x}\frac{\unicode[STIX]{x2202}^{2}\unicode[STIX]{x1D713}^{0}}{\unicode[STIX]{x2202}x\unicode[STIX]{x2202}z}-\frac{\unicode[STIX]{x2202}^{2}\unicode[STIX]{x1D719}^{1}}{\unicode[STIX]{x2202}z^{2}}\frac{\unicode[STIX]{x2202}^{2}\unicode[STIX]{x1D713}^{0}}{\unicode[STIX]{x2202}x^{2}}-\frac{2\unicode[STIX]{x1D6FE}}{Ro}\frac{\unicode[STIX]{x2202}^{2}\unicode[STIX]{x1D719}^{1}}{\unicode[STIX]{x2202}x\unicode[STIX]{x2202}z}+{\mathcal{F}}(\unicode[STIX]{x1D719}^{0}).\end{eqnarray}$$
The different turbulent flux parameterizations arise as
 $$\begin{eqnarray}{\mathcal{F}}(\unicode[STIX]{x1D719}^{0})=\left\{\begin{array}{@{}l@{}}\displaystyle \frac{\unicode[STIX]{x2202}^{4}\unicode[STIX]{x1D719}^{0}}{\unicode[STIX]{x2202}x^{3}\unicode[STIX]{x2202}z}\quad \text{(HV)},\quad \\ \displaystyle \frac{\unicode[STIX]{x2202}^{4}\unicode[STIX]{x1D719}^{0}}{\unicode[STIX]{x2202}z^{3}\unicode[STIX]{x2202}x}\quad \text{(VV)},\quad \\ \displaystyle -\frac{\unicode[STIX]{x2202}^{4}\unicode[STIX]{x1D719}^{0}}{\unicode[STIX]{x2202}x^{3}\unicode[STIX]{x2202}z}\quad \text{(HD)},\quad \\ \displaystyle -\frac{\unicode[STIX]{x2202}^{4}\unicode[STIX]{x1D719}^{0}}{\unicode[STIX]{x2202}z^{3}\unicode[STIX]{x2202}x}\quad \text{(VD)}.\quad \end{array}\right.\end{eqnarray}$$
In our theoretical framework both surface boundary conditions and interior turbulent fluxes enter at the first order and are functions of zeroth-order terms. Thus (2.26) is an inhomogeneous (with turbulent flux divergences as forcing), second-order, linear (from perturbation method), partial differential equation (PDE) which is coupled for the unknown overturning and vertical streamfunction perturbations  $\unicode[STIX]{x1D713}^{1},\unicode[STIX]{x1D719}^{1}$ with non-constant coefficients, which are known functions of the zeroth-order solution. In addition to the limitations on
 $\unicode[STIX]{x1D700}$ and
 $Ro$, this analysis is also restricted to times of early frontal formation, when
 $\unicode[STIX]{x1D713}^{1}<O(1/\unicode[STIX]{x1D700})$ and the PDE (2.26) remains elliptic.
Note that the viscous terms are of opposite sign to the diffusive terms, but horizontal diffusivity and viscosity have the same operator, as do vertical diffusivity and viscosity. Although (2.27) suggests that diffusivity and viscosity may have opposite effects on frontal formation, an additional equation and boundary conditions that differ between viscosity and diffusivity are required in order to obtain the full uncoupled solutions for the first-order overturning and geostrophic streamfunction  $\unicode[STIX]{x1D719}^{1},\unicode[STIX]{x1D713}^{1}$.
2.3 Potential vorticity
Potential vorticity, specifically Ertel PV, is a conserved quantity fundamental to geophysical fluid dynamics, and has historically been immensely useful in understanding oceanic and atmospheric dynamics (e.g. Gill Reference Gill1982; Rhines Reference Rhines1986; Pedlosky Reference Pedlosky1987; Hoskins Reference Hoskins1991; Salmon Reference Salmon1998; Kurgansky & Pisnichenko Reference Kurgansky and Pisnichenko2000). The PV is defined from the absolute vorticity ( $\unicode[STIX]{x1D714}=f\boldsymbol{k}+\unicode[STIX]{x1D735}\times \boldsymbol{u}$) and buoyancy gradient
 $$\begin{eqnarray}q=(f\boldsymbol{k}+\unicode[STIX]{x1D735}\times \boldsymbol{u})\boldsymbol{\cdot }\unicode[STIX]{x1D735}b,\end{eqnarray}$$
where  $\boldsymbol{u}=(\bar{U}+u,\bar{V}+v,w)$ are the background and laminar velocity fields. Note that turbulent velocities are not included in this definition of PV, which is important in the interpretation of the eddy parameterizations. Since the zeroth-order PV is assumed to be zero as in traditional frontogenesis theory, any PV in the perturbation system is associated with the first order and is a result of turbulent fluxes and boundary injection. The dimensionless first-order PV is
 $$\begin{eqnarray}\frac{q^{1}}{Ro^{2}}=\frac{\unicode[STIX]{x2202}v^{1}}{\unicode[STIX]{x2202}x}\frac{\unicode[STIX]{x2202}b^{0}}{\unicode[STIX]{x2202}z}-2\frac{\unicode[STIX]{x2202}v^{0}}{\unicode[STIX]{x2202}z}\frac{\unicode[STIX]{x2202}b^{1}}{\unicode[STIX]{x2202}x}+\left(\frac{1}{Ro^{2}}+\frac{\unicode[STIX]{x2202}v^{0}}{\unicode[STIX]{x2202}x}\right)\frac{\unicode[STIX]{x2202}b^{1}}{\unicode[STIX]{x2202}z}.\end{eqnarray}$$
Or in terms of  $\unicode[STIX]{x1D719}^{1}$,
 $$\begin{eqnarray}\frac{q^{1}}{Ro^{2}}=\frac{\unicode[STIX]{x2202}b^{0}}{\unicode[STIX]{x2202}z}\frac{\unicode[STIX]{x2202}^{2}\unicode[STIX]{x1D719}^{1}}{\unicode[STIX]{x2202}x^{2}}-2\frac{\unicode[STIX]{x2202}v^{0}}{\unicode[STIX]{x2202}z}\frac{\unicode[STIX]{x2202}^{2}\unicode[STIX]{x1D719}^{1}}{\unicode[STIX]{x2202}x\unicode[STIX]{x2202}z}+\left(\frac{1}{Ro^{2}}+\frac{\unicode[STIX]{x2202}v^{0}}{\unicode[STIX]{x2202}x}\right)\frac{\unicode[STIX]{x2202}^{2}\unicode[STIX]{x1D719}^{1}}{\unicode[STIX]{x2202}z^{2}}.\end{eqnarray}$$
The PV equation (2.30), like (2.26), is also an inhomogeneous (the forcing here is the non-zero PV), second-order, linear elliptic PDE for  $\unicode[STIX]{x1D719}^{1}$ with non-constant coefficients which are functions of the zeroth-order solution. As the zeroth-order solution is already known, then if given the strength of
 $q^{1}$, equation (2.30) can be inverted to find
 $\unicode[STIX]{x1D719}^{1}$. From this,
 $\unicode[STIX]{x1D713}^{1}$ can be found using (2.26). So, if
 $q^{1}$ is known, then (2.30) and (2.26) are two coupled, linear PDEs in the unknowns
 $\unicode[STIX]{x1D719}^{1},\unicode[STIX]{x1D713}^{1}$.
The evolution of PV (which is just  $q^{1}$ as the zeroth order has zero PV) is determined by frictional and diabatic forcing through the so-called J-equation, and can be written in terms of an advective term, a frictional flux term and diabatic flux term (Haynes & McIntyre Reference Haynes and McIntyre1987; Marshall & Nurser Reference Marshall and Nurser1992; Thomas Reference Thomas2005; Benthuysen & Thomas Reference Benthuysen and Thomas2012; Wenegrat et al. Reference Wenegrat, Thomas, Gula and McWilliams2018):
 $$\begin{eqnarray}\frac{\unicode[STIX]{x2202}q}{\unicode[STIX]{x2202}t}=-\boldsymbol{u}\boldsymbol{\cdot }\unicode[STIX]{x1D735}q+(\unicode[STIX]{x1D735}\times \boldsymbol{D}_{u})\boldsymbol{\cdot }\unicode[STIX]{x1D735}b+\unicode[STIX]{x1D714}\boldsymbol{\cdot }(\unicode[STIX]{x1D735}D_{b}),\end{eqnarray}$$
where  $\boldsymbol{D}_{u}$ and
 $D_{b}$ are the frictional and diabatic flux divergences.
Since the zeroth-order PV is uniform, the total PV equation reduces to the evolution of the first-order PV.
 $$\begin{eqnarray}\frac{\unicode[STIX]{x2202}q^{1}}{\unicode[STIX]{x2202}t}=-\boldsymbol{u}^{0}\boldsymbol{\cdot }\unicode[STIX]{x1D735}q^{1}+(\unicode[STIX]{x1D735}\times \boldsymbol{D}_{u}^{1})\boldsymbol{\cdot }\unicode[STIX]{x1D735}b^{0}+\unicode[STIX]{x1D714}^{0}\boldsymbol{\cdot }(\unicode[STIX]{x1D735}D_{b}^{1}).\end{eqnarray}$$
In the asymptotic framework, the frictional and diabatic fluxes appear only in the first order and are functions only of known zeroth-order factors,
 $$\begin{eqnarray}\displaystyle & \displaystyle \boldsymbol{D}_{u}^{1}=\unicode[STIX]{x1D735}\boldsymbol{\cdot }F(v^{0}), & \displaystyle\end{eqnarray}$$
 $$\begin{eqnarray}\displaystyle & \displaystyle D_{b}^{1}=\unicode[STIX]{x1D735}\boldsymbol{\cdot }F(b^{0}). & \displaystyle\end{eqnarray}$$
 $(\bar{U}+u^{0},\bar{V}+v^{0},w^{0})$.
The non-dimensional form of this equation is
 $$\begin{eqnarray}\frac{\unicode[STIX]{x2202}q^{1}}{\unicode[STIX]{x2202}t}=-\left[(Ro\,u^{0}+\unicode[STIX]{x1D6FE}\bar{U})\frac{\unicode[STIX]{x2202}}{\unicode[STIX]{x2202}x}+Ro\,w^{0}\frac{\unicode[STIX]{x2202}}{\unicode[STIX]{x2202}z}\right]q^{1}+{\mathcal{D}}(v^{0},b^{0}),\end{eqnarray}$$
where the frictional and diabatic flux effects on PV have been collected into
 $$\begin{eqnarray}{\mathcal{D}}(v^{0},b^{0})=\left\{\begin{array}{@{}l@{}}\displaystyle \frac{\unicode[STIX]{x2202}b^{0}}{\unicode[STIX]{x2202}x}\frac{\unicode[STIX]{x2202}^{3}v^{0}}{\unicode[STIX]{x2202}x^{2}\unicode[STIX]{x2202}z}-\frac{\unicode[STIX]{x2202}b^{0}}{\unicode[STIX]{x2202}z}\frac{\unicode[STIX]{x2202}^{3}v^{0}}{\unicode[STIX]{x2202}x^{3}}\quad \text{(HV)},\quad \\ \displaystyle \frac{\unicode[STIX]{x2202}b^{0}}{\unicode[STIX]{x2202}x}\frac{\unicode[STIX]{x2202}^{3}v^{0}}{\unicode[STIX]{x2202}z^{3}}-\frac{\unicode[STIX]{x2202}b^{0}}{\unicode[STIX]{x2202}z}\frac{\unicode[STIX]{x2202}^{3}v^{0}}{\unicode[STIX]{x2202}z^{2}\unicode[STIX]{x2202}x}\quad \text{(VV)},\quad \\ \displaystyle \frac{\unicode[STIX]{x2202}v^{0}}{\unicode[STIX]{x2202}z}\frac{\unicode[STIX]{x2202}^{3}b^{0}}{\unicode[STIX]{x2202}x^{3}}-\frac{\unicode[STIX]{x2202}v^{0}}{\unicode[STIX]{x2202}x}\frac{\unicode[STIX]{x2202}^{3}b^{0}}{\unicode[STIX]{x2202}x^{2}\unicode[STIX]{x2202}z}\quad \text{(HD)},\quad \\ \displaystyle \frac{\unicode[STIX]{x2202}v^{0}}{\unicode[STIX]{x2202}z}\frac{\unicode[STIX]{x2202}^{3}b^{0}}{\unicode[STIX]{x2202}z^{2}\unicode[STIX]{x2202}x}-\frac{\unicode[STIX]{x2202}v^{0}}{\unicode[STIX]{x2202}x}\frac{\unicode[STIX]{x2202}^{3}b^{0}}{\unicode[STIX]{x2202}z^{3}}\quad \text{(VD)}.\quad \end{array}\right.\end{eqnarray}$$
2.4 Boundary conditions and first-order solution procedure
To evaluate first-order solutions for each of the frictional forcing cases, equation (2.34) is integrated in time using the zeroth-order terms from (2.22) and (2.23a)–(2.23c). During integration, the first-order PV is calculated, advected and accumulated.
The first-order solution is next found, for every forcing case, by solving (2.26) and (2.30) using the PV resulting from (2.34). By integrating equations (2.5a) and (2.5d), the vertical boundary conditions are solved at each time. Explicitly, the vertical boundary conditions are calculated by following the evolution of the first-order buoyancy and cross-frontal velocity at the top and bottom boundaries, for each forcing case
 $$\begin{eqnarray}\displaystyle & \displaystyle b^{1}=\frac{\unicode[STIX]{x2202}\unicode[STIX]{x1D719}^{1}}{\unicode[STIX]{x2202}z},\quad b^{1}|_{z=0,1}=\int _{0}^{t}[-\boldsymbol{u}^{0}\boldsymbol{\cdot }\unicode[STIX]{x1D735}b^{1}-\boldsymbol{u}^{1}\boldsymbol{\cdot }\unicode[STIX]{x1D735}b^{0}+\unicode[STIX]{x1D735}\boldsymbol{\cdot }F(b^{0})]\bigg|_{z=0,1}\text{d}t, & \displaystyle\end{eqnarray}$$
 $$\begin{eqnarray}\displaystyle & \displaystyle u^{1}=\frac{\unicode[STIX]{x2202}\unicode[STIX]{x1D713}^{1}}{\unicode[STIX]{x2202}z},\quad u^{1}|_{z=0,1}=\int _{0}^{t}[-\boldsymbol{u}^{0}\boldsymbol{\cdot }\unicode[STIX]{x1D735}u^{1}-\boldsymbol{u}^{1}\boldsymbol{\cdot }\unicode[STIX]{x1D735}u^{0}+\unicode[STIX]{x1D6FE}u^{1}+\unicode[STIX]{x1D735}\boldsymbol{\cdot }F(u^{0})]\bigg|_{z=0,1}\text{d}t, & \displaystyle\end{eqnarray}$$
 $$\begin{eqnarray}\displaystyle & \displaystyle q^{1}|_{z=0,1}=\left.\left[Ro^{2}\frac{\unicode[STIX]{x2202}b^{0}}{\unicode[STIX]{x2202}z}\frac{\unicode[STIX]{x2202}^{2}\unicode[STIX]{x1D719}^{1}}{\unicode[STIX]{x2202}x^{2}}-2Ro^{2}\frac{\unicode[STIX]{x2202}v^{0}}{\unicode[STIX]{x2202}z}\frac{\unicode[STIX]{x2202}^{2}\unicode[STIX]{x1D719}^{1}}{\unicode[STIX]{x2202}x\unicode[STIX]{x2202}z}+\left(1+Ro^{2}\frac{\unicode[STIX]{x2202}v^{0}}{\unicode[STIX]{x2202}x}\right)\frac{\unicode[STIX]{x2202}^{2}\unicode[STIX]{x1D719}^{1}}{\unicode[STIX]{x2202}z^{2}}\right]\!\right|_{z=0,1}. & \displaystyle\end{eqnarray}$$
The horizontal boundary conditions assume the laminar frontogenetic fields vanish in the horizontal, far from the front. Explicitly,
 $$\begin{eqnarray}\displaystyle & \displaystyle v^{1}|_{x\rightarrow \pm \infty }=\frac{\unicode[STIX]{x2202}\unicode[STIX]{x1D719}^{1}}{\unicode[STIX]{x2202}x}\bigg|_{x\rightarrow \pm \infty }=0, & \displaystyle\end{eqnarray}$$
 $$\begin{eqnarray}\displaystyle & \displaystyle u^{1}|_{x\rightarrow \pm \infty }=\frac{\unicode[STIX]{x2202}\unicode[STIX]{x1D713}^{1}}{\unicode[STIX]{x2202}z}\bigg|_{x\rightarrow \pm \infty }=0, & \displaystyle\end{eqnarray}$$
 $$\begin{eqnarray}\displaystyle & \displaystyle q^{1}|_{x\rightarrow \pm \infty }=0. & \displaystyle\end{eqnarray}$$
The initial conditions for all first-order terms, which include the PV,  $\unicode[STIX]{x1D713}^{1}$ and
 $\unicode[STIX]{x1D719}^{1}$ are zero, assuming turbulence and secondary circulations are negligible at
 $t=0$ when the front is weak. More details on the numerical methods used to illustrate the results in the following section can be found in appendix A.
Total frontal tendency  $T_{b}=T_{b}^{0}+\unicode[STIX]{x1D700}T_{b}^{1}$ for each of the forcing cases, over a variety of
 $\unicode[STIX]{x1D700}$ (shades of blue), evaluated at the surface, where the zeroth-order frontal tendency maximum (black) becomes infinitely strong. For each forcing case, the maroon line represents the
 $\unicode[STIX]{x1D700}$ for which
 $T_{b}=0$. The green vertical line represents the time where the limit of the perturbation approach is reached for each forcing case: horizontal viscosity (
 $t=11.1$), vertical viscosity (
 $t=8$), horizontal diffusivity (
 $t=8.4$), vertical diffusivity (
 $t=9.1$).

3 Results
To quantify the effects turbulent fluxes may have on frontal formation, the first-order frontal tendency is a useful start, evaluated by
 $$\begin{eqnarray}T_{b}^{1}=\frac{\text{D}}{\text{D}t_{0}}\left(\frac{\unicode[STIX]{x2202}b^{0}}{\unicode[STIX]{x2202}x}\frac{\unicode[STIX]{x2202}b^{1}}{\unicode[STIX]{x2202}x}\right)+\frac{\text{D}}{\text{D}t_{1}}\frac{1}{2}\left(\frac{\unicode[STIX]{x2202}b^{0}}{\unicode[STIX]{x2202}x}\right)^{2},\end{eqnarray}$$
where subscripts on the Lagrangian derivative operator indicate the order of the advecting velocities. The total frontal tendency, i.e.  $T_{b}=T_{b}^{0}+\unicode[STIX]{x1D700}T_{b}^{1}$, is sensitive to the choice of
 $\unicode[STIX]{x1D700}$ and the turbulent forcing at hand. Presented in figure 5 are the total frontal tendencies for each of the forcing cases, over a variety of
 $\unicode[STIX]{x1D700}$ (shades of blue), evaluated at the surface, where the zeroth-order frontal tendency maximum (black) becomes infinitely strong. For each forcing case, the maroon line represents the
 $\unicode[STIX]{x1D700}$ for which
 $T_{b}=0$. This is a major result of this study, as it implies that there exists a choice of parameters, for each turbulent forcing case, that is able to temporarily resist the strengthening of the front, i.e. lead to an arrest. It is important to note that
 $\unicode[STIX]{x1D700}$ is different for every forcing case, as well as the length of time for which it is able to sustain an arrest. However, the limitations of the perturbation theory are highlighted by the erratic behaviour of the solution at later times, a reminder that this theory is valid only for early frontal formation while higher-order corrections remain insignificant. In figure 5, a green vertical line is used to indicate when higher-order terms begin to rival leading-order terms – i.e. an estimate of the breakdown time of the perturbation method.
A closer look reveals that horizontal turbulent forcing cases share similar properties, as do the vertical. Both horizontal viscosity and diffusivity show a linear response in epsilon towards a weakening of the total frontal tendency, i.e. as  $\unicode[STIX]{x1D700}$ increases,
 $T_{b}$ becomes more negative. Additionally, the
 $\unicode[STIX]{x1D700}$ which enables an arrest is relatively small, only
 $\unicode[STIX]{x1D700}=0.25$ in the horizontal viscosity case and
 $\unicode[STIX]{x1D700}=0.04$ in the horizontal diffusivity case. Vertical viscosity and diffusivity also can reduce the rate at which frontal tendency grows, however larger values of
 $\unicode[STIX]{x1D700}$ are required to reach negative frontal tendency. During late frontogenesis (near time 10), larger values of vertical diffusivity enhance the rate of frontogenesis over the zeroth-order solution, with larger
 $\unicode[STIX]{x1D700}$ leading to faster frontal tendency (although this effect occurs after perturbation theory is estimated to remain formally accurate). To make early time frontal tendency negative, very large values of
 $\unicode[STIX]{x1D700}$ are needed with the vertical operators. Furthermore, larger values of the arrest
 $\unicode[STIX]{x1D700}$ are found in the vertical cases, where
 $\unicode[STIX]{x1D700}=0.53$ in the vertical viscosity case and
 $\unicode[STIX]{x1D700}=0.51$ in the vertical diffusivity case. Indeed,
 $Ro=0.4<\unicode[STIX]{x1D700}<1$ is required by the asymptotics, so much larger
 $\unicode[STIX]{x1D700}$ are not accessible consistently. By contrast, very small values of
 $\unicode[STIX]{x1D700}$ optimize arrest (as simulated in the perturbation theory) in the horizontal viscosity (
 $\unicode[STIX]{x1D700}\approx 0.25$) and especially diffusivity (
 $\unicode[STIX]{x1D700}\approx 0.04$) cases. The perturbation assumption of
 $Ro\sim \unicode[STIX]{x1D700}$ does not apply for such small
 $\unicode[STIX]{x1D700}$ values, and these specific values are unlikely to be accurate (Barcilon Reference Barcilon1998; Bender & Orszag Reference Bender and Orszag2013). However, even a small amount of horizontal diffusivity surely affects frontogenesis strongly. In practice, even small amounts of horizontal numerical viscosity and diffusivity will have a large impact on frontogenesis, consistent with other findings (see discussion in McWilliams et al. (Reference McWilliams, Molemaker and Olafsdottir2009)). Because numerical stability requires (horizontal) diffusivity and viscosity to scale with (horizontal) resolution, much higher horizontal resolution is required to properly capture frontogenesis numerically than one would naively expect based on assumed balances such as
 $Ro\sim \unicode[STIX]{x1D700}$. Thus, recent oceanic large eddy simulations of frontogenesis (e.g. Suzuki et al. Reference Suzuki, Fox-Kemper, Hamlington and Van Roekel2016; Sullivan & McWilliams Reference Sullivan and McWilliams2018) are likely addressing a novel regime where horizontal fluxes may contribute unlike in coarser hydrostatic models. Likewise, the results here that vertical turbulent fluxes approach leading order to contribute to arrest – or even become frontogenetic as in the vertical diffusivity near time 10 – is likewise consistent with recent numerical analyses of the frontogenetic turbulent thermal wind effects.
Cross-frontal plane of the total frontal tendency  $T_{b}=T_{b}^{0}+\unicode[STIX]{x1D700}T_{b}^{1}$ during early frontogenesis (
 $t=5$) with the appropriate arrest
 $\unicode[STIX]{x1D700}$ for each forcing case: horizontal viscosity (
 $\unicode[STIX]{x1D700}=0.25$), vertical viscosity (
 $\unicode[STIX]{x1D700}=0.53$), horizontal diffusivity (
 $\unicode[STIX]{x1D700}=0.04$), vertical diffusivity (
 $\unicode[STIX]{x1D700}=0.51$). Black ticks indicate the location of the maximum zeroth-order frontal tendency corresponding to that measured in figure 5 and for the sense of where the front is strongest.

Same as in figure 6 for the total along-front velocity  $v=v^{0}+\unicode[STIX]{x1D700}v^{1}$.

Same as in figure 6 for the total streamfunction  $\unicode[STIX]{x1D713}=\unicode[STIX]{x1D713}^{0}+\unicode[STIX]{x1D700}\unicode[STIX]{x1D713}^{1}$.

To better understand the underlying dynamics of the possible arrest mechanism for each forcing case, we next examine the cross-frontal planes of the total frontal tendency ( $T_{b}=T_{b}^{0}+\unicode[STIX]{x1D700}T_{b}^{1}$, figure 6), along-front velocity (
 $v=v^{0}+\unicode[STIX]{x1D700}v^{1}$, figure 7) and streamfunction (
 $\unicode[STIX]{x1D713}=\unicode[STIX]{x1D713}^{0}+\unicode[STIX]{x1D700}\unicode[STIX]{x1D713}^{1}$, figure 8). All figures are displayed at non-dimensional time
 $t=5$, and with the appropriate arrest
 $\unicode[STIX]{x1D700}$ for each forcing case found in figure 5. Black ticks indicate the location of maximum zeroth-order frontal tendency corresponding to that measured in figure 5, and for the sense of where the front is strongest. All forcing cases exhibit zero total frontal tendency at the location of the zeroth-order maximum (figure 6), which is expected by choosing the arrest
 $\unicode[STIX]{x1D700}$ for each case. A demonstration of the arrest is also apparent, for each forcing case, in the spreading and weakening of the along-front velocity at the surface (figure 7).
However, in the zeroth-order solution illustrated in figures 2–4, the overturning streamfunction tended to focus the buoyancy gradients in two corner points, consistent with the locations of maximum frontal tendency, and where eventually frontal singularities first develop. In the perturbation solutions combined to first order in figures 6–8, the behaviour at these points is different depending on which turbulent forcing case is examined.
(i) Horizontal viscosity: the frontal tendency (figure 6) exhibits weak negative and positive signals adjacent to the zeroth-order frontal maximum, of opposite orientation to figure 3 during late frontogenesis. Furthermore, a negative streamfunction (figure 8) appears near the surface, right of the region of maximum zeroth-order frontal tendency, directing fluid and gradients away from the front maximum. This supports the findings in figure 5, that the contribution of horizontal viscosity at the first order tends to weaken the front.
(ii) Vertical viscosity: although weaker in magnitude, the frontal tendency (figure 6) in this case is of similar orientation to the front maximum as in figure 3 during late frontogenesis. Here, a negative streamfunction (figure 8) appears near the surface as well, but in opposite configuration with respect to the front maximum when compared to the horizontal viscosity case, thus directing fluid and gradients to concentrate toward the region of maximum zeroth-order frontal tendency. Although, at time
 $t=5$ the total frontal tendency is near zero, the flow indicates that vertical viscosity at the first order tends to enhance frontogenesis, consistent with results from previous studies.
(iii) Horizontal diffusivity: the along-front velocity is relatively widespread in figure 7 as compared with the other cases, even for a relatively small value of
$\unicode[STIX]{x1D700}$. The streamfunction (figure 8) similarly is widespread, however the streamfunction reverses sign for increased $\unicode[STIX]{x1D700}$, directly opposing the zeroth-order streamfunction (not shown). Interestingly, the frontal tendency in this case (figure 5) does not resemble that of the horizontal viscosity case. Rather, it is of the same configuration as vertical viscosity and diffusivity, which may explain the acceleration found in figure 5 approaching the perturbation limit at time $t=8.4$. However, horizontal diffusivity in figure 5 displays a weakening even for very small values of $\unicode[STIX]{x1D700}$ and thus, we conclude that horizontal diffusivity, similar to horizontal viscosity, has mostly frontolytic characteristics.(iv) Vertical diffusivity: similar to the vertical viscosity case, the frontal tendency here (figure 6) exhibits the same configuration as in figure 3. However, the streamfunction (figure 8) displays a weak wider shape in the interior, yet is more concentrated near the surface. The streamfunction shape does not reveal much intuition regarding the effects of vertical viscosity on the flow field. For smaller
$\unicode[STIX]{x1D700}$, the streamfunction magnitude is stronger, and for larger $\unicode[STIX]{x1D700}$ more concentrated at the surface (not shown). Figure 5 shows that, as the perturbation limit is approached at time $t=9.1$, the total frontal tendency for all values of $\unicode[STIX]{x1D700}$ accelerates and focuses at the zeroth-order value. The time this occurs is likely sensitive to parameters such as $Ro$ and $\unicode[STIX]{x1D6FE}$. We conclude that vertical diffusivity, similar to vertical viscosity, is frontogenetic based on the frontal tendency, yet not easily understood from the streamfunction flow field.


To summarize, the first-order solution is distinguished from the zeroth-order solution in two ways, by the computed interior PV and through the altered boundary conditions that arise at first order. The first-order solutions examined in this section are surprisingly complex in comparison to the simple reversal of signs in (2.35) – the solutions are not just mirror images because the surface boundary conditions for momentum and buoyancy are not simply related, even though the field equations are. It is now natural to ask whether the solution is fully dependent on both or whether either the interior PV or the surface conditions dominates over the other.
3.1 Surface quasi-geostrophy versus interior quasi-geostrophy
In the mixed layer, surface quasi-geostrophic (SQG) dynamics (Lapeyre & Klein Reference Lapeyre and Klein2006; Lapeyre, Klein & Hua Reference Lapeyre, Klein and Hua2006) sometimes dominates over interior quasi-geostrophic (IQG) dynamics forced by anomalies in ocean interior PV (Klein et al. Reference Klein, Lapeyre, Roullet, Le Gentil and Sasaki2011), also called Charney (Reference Charney1971) QG dynamics (Bretherton Reference Bretherton1966; Capet et al. Reference Capet, Klein, Hua, Lapeyre and McWilliams2008a; Stamper, Taylor & Fox-Kemper Reference Stamper, Taylor and Fox-Kemper2018). The IQG has been shown in some simulations to enhance frontogenesis over SQG-only upper ocean cases (Capet et al. Reference Capet, Roullet, Klein and Maze2016), and can nonetheless exhibit mesoscale strain-induced frontogenesis to some degree which is enhanced by submesoscales (Callies et al. Reference Callies, Flierl, Ferrari and Fox-Kemper2016). The relative contributions of the SQG system are more easily detected by remote sensing (e.g. LaCasce & Mahadevan Reference LaCasce and Mahadevan2006; LaCasce & Wang Reference LaCasce and Wang2015; Chavanne & Klein Reference Chavanne and Klein2016).
In an SQG system, surface buoyancy anomalies are used to generate an active boundary condition, while the interior PV is taken to be uniform and inert (Blumen Reference Blumen1978). The full flow field is obtained by using the PV invertibility principle (Hoskins, McIntyre & Robertson Reference Hoskins, McIntyre and Robertson1985), with the active buoyancy field providing the boundary conditions for the inversion. In the IQG system, the boundary conditions are simplified by neglecting buoyancy anomalies and the flow dynamics is assumed to be driven solely by interior quasi-geostrophic PV anomalies (QGPV). Two interesting by-products of the perturbation analysis framework are that the first-order Ertel PV, as ordinarily used in the traditional frontogenesis literature, is locally equivalent to QGPV at that order, and that the impact of the first-order solution can be uniquely and completely decomposed into SQG effects and IQG effects (figures 9 and 10). Turbulent closures affect surface buoyancy quite differently from interior PV, so, are the effects on frontal formation by interior PV comparable to surface turbulent fluxes?
Cross-frontal planes of the first-order along-front velocity  $v^{1}$ at time
 $t=5$ for all forcing cases, calculated from the full system (a)–(d), the IQG system (e)–(h), the SQG system (i)–(l), the SQG system with a point source approximation (m)–(p) and the sum of the SQG and IQG systems (q)–(t). Note that for plotting purposes the IQG system is multiplied by a constant.

Same as in figure 9 for the first-order streamfunction  $\unicode[STIX]{x1D713}^{1}$. Note that for plotting purposes also here the IQG system is multiplied by a constant.

The PV in (2.30), together with the buoyancy boundary condition on  $\unicode[STIX]{x1D719}$ in (2.36a) and (2.37a), can thus be constructed from a combination of the interior QGPV, which in isolation drives the IQG system, and added delta functions based on surface buoyancy to replace the buoyancy boundary condition (Bretherton Reference Bretherton1966), which in isolation drive the SQG system (more details in appendix A). The surface delta boundary conditions are explicitly calculated by following the evolution of the first-order buoyancy and cross-frontal velocity at the surface, for each forcing case
 $$\begin{eqnarray}\displaystyle & \displaystyle b^{1}=\frac{\unicode[STIX]{x2202}\unicode[STIX]{x1D719}^{1}}{\unicode[STIX]{x2202}z},\quad b^{1}=\int _{0}^{t}[-\boldsymbol{u}^{0}\boldsymbol{\cdot }\unicode[STIX]{x1D735}b^{1}-\boldsymbol{u}^{1}\boldsymbol{\cdot }\unicode[STIX]{x1D735}b^{0}+\unicode[STIX]{x1D735}\boldsymbol{\cdot }F(b^{0})]\unicode[STIX]{x1D6FF}(z-0)\,\text{d}t, & \displaystyle\end{eqnarray}$$
 $$\begin{eqnarray}\displaystyle & \displaystyle u^{1}=\frac{\unicode[STIX]{x2202}\unicode[STIX]{x1D713}^{1}}{\unicode[STIX]{x2202}z},\quad u^{1}=\int _{0}^{t}[-\boldsymbol{u}^{0}\boldsymbol{\cdot }\unicode[STIX]{x1D735}u^{1}-\boldsymbol{u}^{1}\boldsymbol{\cdot }\unicode[STIX]{x1D735}u^{0}+\unicode[STIX]{x1D6FE}u^{1}+\unicode[STIX]{x1D735}\boldsymbol{\cdot }F(u^{0})]\unicode[STIX]{x1D6FF}(z-0)\,\text{d}t. & \displaystyle\end{eqnarray}$$
A delta function for the bottom boundary condition is used as well, although this has little effect on the end result. These are essentially identical to the full first-order boundary conditions (2.36a)–(2.36b).
Figures 9 and 10 show the cross-frontal planes of the first-order along-front velocity  $v^{1}$ and streamfunction
 $\unicode[STIX]{x1D713}^{1}$ at time
 $t=5$ for all forcing cases, calculated from the full system (a)–(d), the IQG system (e)–(h), the SQG system (i)–(l) and their sum (q)–(t). Panels (m)–(p) will be discussed in the following subsection.
To obtain the along-front velocity, we solve a linear PDE in  $\unicode[STIX]{x1D719}^{1}$, and thus expect the sum of the SQG and IQG systems to be similar to that of the full system. For all forcing cases, the full and SQG systems in figure 9 are characterized by negative velocity, centred at the surface and decreasing with depth. On the other hand, the IQG system shows a significantly weaker velocity, with a dipole shape (or double dipole in the vertical cases). Hence, for the along-front velocity, representing the geostrophic field, the SQG system appears to capture most elements of the complete solution.
Unlike the equation for  $\unicode[STIX]{x1D719}^{1}$, the streamfunction
 $\unicode[STIX]{x1D713}^{1}$ has a forcing term that cannot be easily attributed to SQG or IQG dynamics, as it is governed by zeroth-order terms. For illustration purposes, we divide this forcing term into surface and interior domains (more details in appendix A), and solve for the SQG and IQG systems separately. The first-order streamfunction exhibits different behaviour for each forcing case in figure 10. The full solution for the horizontal and vertical viscosity cases is focused near the surface, whereas in the horizontal and vertical diffusivity cases the streamfunction is centred in the interior. Furthermore, unlike figure 9, the IQG system is comparable in magnitude in the horizontal cases, yet weaker in the vertical cases. The sum of the SQG and IQG systems is very similar to the complete system in all cases, however only in the horizontal viscosity case does the IQG system contribute significantly in the interior.
Thus, given surface turbulent fluxes, the first-order correction of the along-front velocity and geostrophic potential can be found to a good approximation merely from surface conditions, using SQG theory in this classic strain-induced frontogenesis case. The overturning streamfunction and ageostrophic field reveal a more complex dependency on interior fluxes, which by affecting interior PV, may be important for a complete solution below the surface. This implies that parameterizations that affect the surface buoyancy will have a larger impact on frontal structure than those that affect interior PV or the rate of PV injection.
3.2 Point source surface quasi-geostrophy
In the SQG framework, we followed Bretherton (Reference Bretherton1966), and used delta functions in  $z$ to replace the surface buoyancy boundary conditions. The success of this approach in capturing much of the full frontogenesis impacts on along-front velocity highlights the importance of surface buoyancy gradients. We now examine a further simplification of buoyancy that is severely focused in the horizontal direction as well to see how much of the effect is retained. During frontogenesis, the buoyancy has a sharp, and sharpening, gradient over the frontal domain. As the buoyancy singularity is approached, the cross-frontal buoyancy gradient
 $\unicode[STIX]{x2202}b^{1}/\unicode[STIX]{x2202}x$ may be approximated by a delta function in the cross-frontal direction, corresponding to the location of maximum frontal tendency, and buoyancy gradients elsewhere being neglected. Using this assumption, a simplified boundary condition for the geostrophic potential
 $\unicode[STIX]{x1D719}^{1}$ is a Heaviside function in
 $x$ and a delta function in
 $z$,
 $$\begin{eqnarray}\displaystyle & \displaystyle \unicode[STIX]{x1D719}^{1}(z=0)=\left\{\begin{array}{@{}l@{}}\unicode[STIX]{x1D719}_{max}^{1}\unicode[STIX]{x1D6FF}(z-0)\quad x>x_{fb},\quad \\ \unicode[STIX]{x1D719}_{min}^{1}\unicode[STIX]{x1D6FF}(z-0)\quad x<x_{fb},\quad \end{array}\right. & \displaystyle\end{eqnarray}$$
 $$\begin{eqnarray}\displaystyle & \displaystyle \unicode[STIX]{x1D719}^{1}(z=1)=\left\{\begin{array}{@{}l@{}}\unicode[STIX]{x1D719}_{max}^{1}\unicode[STIX]{x1D6FF}(z-1)\quad x>x_{fs},\quad \\ \unicode[STIX]{x1D719}_{min}^{1}\unicode[STIX]{x1D6FF}(z-1)\quad x<x_{fs}.\quad \end{array}\right. & \displaystyle\end{eqnarray}$$
 $x_{fs},x_{fb}$ which represent the location of the front nose at the surface (
 $fs$) and bottom (
 $fb$) of the mixed layer respectively.
The motivation for considering such simplifications is Green’s functions theory, as a full flow field solution exists for  $\unicode[STIX]{x1D719}^{1}$ and
 $\unicode[STIX]{x1D713}^{1}$ even if only a point source buoyancy gradient is prescribed (e.g. Harnik & Heifetz Reference Harnik and Heifetz2007). An example analytic procedure for finding the first-order solution to (2.26), using delta function approximations and Green’s function theory, is given in appendix B.
Figures 9 and 10(m–p) show results for the SQG systems with point source surface conditions. In all forcing cases, the along-front velocity and streamfunction are very similar to the full SQG system solutions in (i–l), especially near the surface.
In conclusion, the SQG geostrophic potential, which contributes most of the along-front velocity, can be reconstructed by surface conditions highly localized near the front maximum. From a parameterization or numerics development perspective, it is the method of regularizing – or keeping finite – the buoyancy gradient very near the maximum gradient surface expression of the front that will dominate the fidelity of a strain-induced frontal simulation, rather than turbulent fluxes elsewhere or the broad-scale injection of PV.
4 Summary and discussion
In this study, an asymptotic approach estimates the leading-order correction of turbulent fluxes to classic theory for strain-induced frontogenesis. The system described by classic theory may capture the leading-order dynamics, but it is shown here that turbulent fluxes are likely a key secondary component missing in aligning theory with observations and model simulations, especially in the ocean where submesoscale fronts typically coexist with boundary layer turbulence, but also in lower-level atmospheric fronts. Here the effects of turbulent surface and interior fluxes of buoyancy and PV were isolated and examined.
The uncoupled first-order solutions for the along-front geostrophic velocity and ageostrophic overturning streamfunction are obtained by inverting the modified semi-geostrophic frontogenesis equation together with the first non-vanishing-order PV equation. By differentiating between horizontal and vertical eddy viscosity and diffusivity which, in reality, might be associated with parameterizations of mixed layer instabilities, boundary layer turbulence or numerical artefacts as simulated fronts approach singularity, an early understanding of the different impacts of these dissipative operators on fronts is gained. It is found that horizontal viscosity and diffusivity readily act to weaken the front, and thus are key to understanding frontal arrest, consistent with the arresting role of horizontal shear instabilities found by Sullivan & McWilliams (Reference Sullivan and McWilliams2018). Vertical viscosity and diffusivity, by contrast, act only to slow strengthening of the front at first, and later vertical diffusivity accelerates frontogenesis resembling turbulent thermal wind theory (McWilliams et al. Reference McWilliams, Gula, Molemaker, Renault and Shchepetkin2015; McWilliams Reference McWilliams2017; Crowe & Taylor Reference Crowe and Taylor2018).
As the full first-order solution depends on both turbulent boundary conditions and injected interior PV, a decomposition of the results into surface quasi-geostrophic and interior quasi-geostrophic subsystems isolates the contributions to the full solution. In most forcing cases, it is found that SQG dynamics is able to capture most of the along-front velocity and overturning streamfunction features, whereas IQG dynamics has a small contribution. The point source forcing indicates that only a small surface region near the front is needed. In the case of horizontal viscosity, the ageostrophic overturning circulation is only fully reconstructed by including both the SQG and IQG systems. Due to the nature of frontal dynamics, features tend to be localized where the front is strongest. By considering only a point source buoyancy gradient boundary condition, a good approximation to the full SQG response for both the along-front geostrophic velocity and overturning ageostrophic streamfunction was obtained. In a recent paper, Wenegrat et al. (Reference Wenegrat, Thomas, Gula and McWilliams2018) show that boundary layer turbulence can generate a source of PV at the surface, similar in magnitude to PV fluxes from wind and surface buoyancy fluxes (Thomas Reference Thomas2005). It is presently unclear whether our conclusions for the SQG and IQG systems hold true in the presence of strong surface forcing, such as downfront wind forcing, or realistic boundary layer turbulence. However, the same perturbation methods can be used while including wind forcing in (2.13), and many of the large eddy simulations being analysed include winds.
Furthermore, the asymptotic method presented in this study is derived from the semi-geostrophic equations presented in Reference Hoskins and BrethertonHB72, implying that the Rossby number is smaller than 1. However, in the submesoscale regime, both inertial and rotational forces are important and so the Rossby number is  $Ro\sim 1$ (e.g. McWilliams Reference McWilliams2016). Additionally, semi-geostrophic theory has been shown to be inconsistent with
 $Ro\sim 1$ (Barkan et al. Reference Barkan, Molemaker, Srinivasan, McWilliams and D’Asaro2019) and curved fronts (Gent, McWilliams & Snyder Reference Gent, McWilliams and Snyder1994). The expansion parameter
 $\unicode[STIX]{x1D700}$ is taken to be constant; however, the realistic form is highly uncertain as it represents parameterized effects of turbulent fluxes in the submesoscale regime. The modified theory presented here merely acts as a framework to study the effects of turbulent fluxes during early frontal formation, while the semi-geostrophic assumptions and asymptotic approximation still hold.
It is intended that this framework be utilized in concert with submesoscale simulations with more realistic turbulence parameterizations or resolved turbulence to highlight important regions or aspects of such simulations. At present, large eddy simulations (Moeng Reference Moeng1984; McWilliams, Sullivan & Moeng Reference McWilliams, Sullivan and Moeng1997) are able to resolve the submesoscale dynamics and boundary layer turbulence that motivate this theory. An examination of simulations similar to those studied in Hamlington et al. (Reference Hamlington, Van Roekel, Fox-Kemper, Julien and Chini2014), Smith et al. (Reference Smith, Hamlington and Fox-Kemper2016) and Suzuki et al. (Reference Suzuki, Fox-Kemper, Hamlington and Van Roekel2016) but including strain-inducing eddies are ongoing. In all runs, a confluent region produces strong frontogenesis, but the cross-frontal scale halts at a finite width. The eventual target is finding quantitative predictions for frontal width, strength and persistence in the presence of realistic turbulent fluxes.
Acknowledgements
This research was made possible in part by a grant from The Gulf of Mexico Research Initiative and in part by NSF EPSCoR RI-CAIM (NSF 1655221). No data were used in producing this manuscript. Much of this work was developed during the Kavli Institute for Theoretical Physics, as part of the Planetary Boundary Layers in Atmospheres, Oceans, and Ice on Earth and Moons programme, supported by the National Science Foundation under grant no. NSF PHY17-48958. We would especially like to thank G. Chini and S. Smith for their insights concerning asymptotics and boundary layer turbulence. Furthermore, we would like to thank N. Suzuki, A. Sane, Q. Li, J. Skitka, B. Pearson and J. Pearson for fruitful conversations throughout this study.
Appendix A. Numerical scheme
A.1 Parameters
(i) Dimensionless time (
$t$) range is $[0,19.8]$ where the zeroth order vanishes according to Reference Shakespeare and TaylorST13.(ii) Dimensionless cross-frontal (
$x$) range is $[-2.5,2.5]$.(iii) Dimensionless vertical (
$z$) range is $[0,1]$.(iv)
$\unicode[STIX]{x1D6FE}=0.1$.(v) Rossby number
$Ro=0.4$.(vi) The Froude number is calculated by
$Fr=Ro/Bu$ where $Bu=0.1$ following Reference Shakespeare and TaylorST13.


A.2 First-order solution
(i) The zeroth-order solution is calculated with (2.22) and (2.23a)–(2.23c), which serve as inputs for the consecutive steps.
(ii) The PV is calculated by integrating the PV evolution equation (2.34) using the forward Euler method for the first three time steps after which the third-order Adam–Bashforth explicit method is used. The zeroth-order solution is used to calculate the advection and and flux terms at every time step.
(iii) In the SQG simulation the PV is taken to be zero.
(iv) The five point stencil method is used to invert, at every time step, the second-order partial differential equation for
$\unicode[STIX]{x1D719}^{1}$ (2.30), using inputs from the zeroth-order solution and the PV.(v) A similar method is used for
$\unicode[STIX]{x1D713}$ (2.26), using inputs from the zeroth-order solution and $\unicode[STIX]{x1D719}^{1}$.


A.3 Boundary conditions
For the simulations presented in this paper we do not include fluxes induced by wind shear and thermodynamic forcing.
The boundary conditions for  $\unicode[STIX]{x1D713}^{1}$ are given by integrating the cross-front momentum equation (2.5a). We use the forward Euler method for the first three time steps after which the third-order Adam–Bashforth explicit method is used. The streamfunction is evaluated at every time step by (2.4). The zeroth-order solution is used as input for the zeroth-order advection and the total flux terms. The first-order advection terms are evaluated at every time step with the explicit method.
The boundary conditions for  $\unicode[STIX]{x1D719}^{1}$ are given by integrating the thermodynamic equation (2.5d) by the same method as for
 $\unicode[STIX]{x1D713}^{1}$, where the geostrophic potential is evaluated at every time step by (2.6).
In the IQG simulation the boundary conditions for  $\unicode[STIX]{x1D719}^{1}$ are taken to be trivial
 $\unicode[STIX]{x2202}\unicode[STIX]{x1D719}^{1}/\unicode[STIX]{x2202}z=0$. In both the IQG and SQG systems we maintain the boundary conditions for
 $\unicode[STIX]{x1D713}^{1}$ since this is the equation for the ageostrophic streamfunction and is independent at each time of the quasi-geostrophic PV inversion. At past times, the Lagrangian history of the boundary conditions does affect
 $\unicode[STIX]{x1D713}_{1},\unicode[STIX]{x1D719}_{1}$, but these historical effects do not directly accumulate in the first-order ageostrophic overturning circulation, which in the perturbation asymptotics, is diagnostically calculated from the zeroth-order fields through (2.26). The nature of this decomposition is highlighted by the characteristics of the boundary conditions in the SQG system, and (2.30) for the IQG system, independent of the first-order Lagrangian derivative. The turbulent flux forcing term
 ${\mathcal{F}}(\unicode[STIX]{x1D719}^{0})$ in (2.26) is divided into surface and interior domains for the SQG and QG case respectively.
In the point source case, the boundary conditions are calculated by (3.3) where  $x_{ft},~x_{fb}$ are the points of maximum along-front velocity on the boundary.
Appendix B. Analytic solution for the delta function approximation
To obtain an analytic framework, we chose the locations for which the zeroth-order solution goes singular as the points of maximum frontogenesis. In this approximation, the point sources of PV ( $\hat{q}_{fs},\hat{q}_{fb}$) can be found by evaluating the PV from (2.34) at these locations.
With the assumption of point sources of PV,  $\unicode[STIX]{x1D719}^{1}$ can be found using the Green’s function for the PDE (2.30), then (2.26) determines the first-order geostrophic streamfunction
 $\unicode[STIX]{x1D713}^{1}$.
If the PDE is elliptic then we can perform a change of variables so that it becomes  ${\sim}\unicode[STIX]{x1D6FB}^{2}$ in some other coordinate system. We are looking for a change of variables (
 $\unicode[STIX]{x1D709}(x,z),\unicode[STIX]{x1D702}(x,z)$) such that
 $J\equiv \unicode[STIX]{x1D709}_{x}\unicode[STIX]{x1D702}_{z}-\unicode[STIX]{x1D709}_{z}\unicode[STIX]{x1D702}_{x}\neq 0$ for any
 $x,z$ in the domain. For an equation of the sort
 $$\begin{eqnarray}{\mathcal{L}}[\unicode[STIX]{x1D719}^{1}]=A\unicode[STIX]{x1D719}_{xx}^{1}+2B\unicode[STIX]{x1D719}_{xz}^{1}+C\unicode[STIX]{x1D719}_{zz}^{1}=D,\end{eqnarray}$$
where
 $$\begin{eqnarray}\displaystyle \left.\begin{array}{@{}c@{}}\displaystyle A=Ro^{2}\frac{\unicode[STIX]{x2202}^{2}\unicode[STIX]{x1D719}^{0}}{\unicode[STIX]{x2202}z^{2}},\\ \displaystyle B=-Ro^{2}\frac{\unicode[STIX]{x2202}^{2}\unicode[STIX]{x1D719}^{0}}{\unicode[STIX]{x2202}x\unicode[STIX]{x2202}z},\\ \displaystyle C=\left(1+Ro^{2}\frac{\unicode[STIX]{x2202}^{2}\unicode[STIX]{x1D719}^{0}}{\unicode[STIX]{x2202}x^{2}}\right),\\ \displaystyle D=\hat{q}_{ft}\unicode[STIX]{x1D6FF}(x-x_{ft})\unicode[STIX]{x1D6FF}(z-z_{ft})+\hat{q}_{fb}\unicode[STIX]{x1D6FF}(x-x_{fb})\unicode[STIX]{x1D6FF}(z-z_{fb}).\end{array}\right\} & & \displaystyle\end{eqnarray}$$
Assuming  $A,B,C$ are real analytic functions in the domain, and that
 $A(x,y)\neq 0$ (i.e.
 $\unicode[STIX]{x2202}b^{0}/\unicode[STIX]{x2202}z\neq 0$), a transformation
 $\unicode[STIX]{x1D6F1}(\unicode[STIX]{x1D709},\unicode[STIX]{x1D702})=\unicode[STIX]{x1D719}^{1}(x(\unicode[STIX]{x1D709},\unicode[STIX]{x1D702}),y(\unicode[STIX]{x1D709},\unicode[STIX]{x1D702}))$ can be found such that
 $$\begin{eqnarray}{\mathcal{A}}\unicode[STIX]{x1D6F1}_{\unicode[STIX]{x1D709}\unicode[STIX]{x1D709}}+2{\mathcal{B}}\unicode[STIX]{x1D6F1}_{\unicode[STIX]{x1D709}\unicode[STIX]{x1D702}}+{\mathcal{C}}\unicode[STIX]{x1D6F1}_{\unicode[STIX]{x1D702}\unicode[STIX]{x1D702}}={\mathcal{D}}.\end{eqnarray}$$
And
 $$\begin{eqnarray}\displaystyle \left.\begin{array}{@{}c@{}}{\mathcal{A}}=A\unicode[STIX]{x1D709}_{x}^{2}+2B\unicode[STIX]{x1D709}_{x}\unicode[STIX]{x1D709}_{z}+C\unicode[STIX]{x1D709}_{z}^{2},\\ {\mathcal{B}}=A\unicode[STIX]{x1D709}_{x}\unicode[STIX]{x1D702}_{x}+B(\unicode[STIX]{x1D709}_{x}\unicode[STIX]{x1D702}_{z}+\unicode[STIX]{x1D709}_{z}\unicode[STIX]{x1D702}_{x})+C\unicode[STIX]{x1D709}_{z}\unicode[STIX]{x1D702}_{z},\\ {\mathcal{C}}=A\unicode[STIX]{x1D702}_{x}^{2}+2B\unicode[STIX]{x1D702}_{x}\unicode[STIX]{x1D702}_{z}+C\unicode[STIX]{x1D702}_{z}^{2}.\end{array}\right\} & & \displaystyle\end{eqnarray}$$
Since our operator is elliptic we are looking for  $\unicode[STIX]{x1D709},\unicode[STIX]{x1D702}$ that satisfy
 ${\mathcal{A}}={\mathcal{C}}$ and
 ${\mathcal{B}}=0$,
 $$\begin{eqnarray}\displaystyle & \displaystyle A\unicode[STIX]{x1D709}_{x}^{2}+2B\unicode[STIX]{x1D709}_{x}\unicode[STIX]{x1D709}_{z}+C\unicode[STIX]{x1D709}_{z}^{2}=A\unicode[STIX]{x1D702}_{x}^{2}+2B\unicode[STIX]{x1D702}_{x}\unicode[STIX]{x1D702}_{z}+C\unicode[STIX]{x1D702}_{z}^{2}, & \displaystyle\end{eqnarray}$$
 $$\begin{eqnarray}\displaystyle & \displaystyle A\unicode[STIX]{x1D709}_{x}\unicode[STIX]{x1D702}_{x}+B(\unicode[STIX]{x1D709}_{x}\unicode[STIX]{x1D702}_{z}+\unicode[STIX]{x1D709}_{z}\unicode[STIX]{x1D702}_{x})+C\unicode[STIX]{x1D709}_{z}\unicode[STIX]{x1D702}_{z}=0. & \displaystyle\end{eqnarray}$$
 $\unicode[STIX]{x1D706}=\unicode[STIX]{x1D709}+\text{i}\unicode[STIX]{x1D702}$, reducing to one equation,
 $$\begin{eqnarray}A\unicode[STIX]{x1D706}_{x}+(B\pm \text{i}\sqrt{AC-B^{2}})\unicode[STIX]{x1D706}_{z}=0,\end{eqnarray}$$
where  $\unicode[STIX]{x1D706}$ is constant on the characteristics (defined on the complex plane)
 $$\begin{eqnarray}\frac{\text{d}z}{\text{d}x}=\frac{B\pm \text{i}\sqrt{AC-B^{2}}}{A}.\end{eqnarray}$$
Inserting the non-dimensional definitions for  $A,B.~C$ gives
 $$\begin{eqnarray}\frac{\text{d}z}{\text{d}x}=\frac{\displaystyle -\frac{\unicode[STIX]{x2202}b^{0}}{\unicode[STIX]{x2202}x}}{\displaystyle \frac{\unicode[STIX]{x2202}b^{0}}{\unicode[STIX]{x2202}z}}\pm \text{i}\frac{\displaystyle \sqrt{\left(Ro^{2}\frac{\unicode[STIX]{x2202}b^{0}}{\unicode[STIX]{x2202}z}\right)\cdot \left(1+Ro^{2}\frac{\unicode[STIX]{x2202}v^{0}}{\unicode[STIX]{x2202}x}\right)-\left(Ro^{2}\frac{\unicode[STIX]{x2202}b^{0}}{\unicode[STIX]{x2202}x}\right)^{2}}}{\displaystyle \left(Ro^{2}\frac{\unicode[STIX]{x2202}b^{0}}{\unicode[STIX]{x2202}z}\right)}.\end{eqnarray}$$
Integrating the equation with respect to  $x$:
 $$\begin{eqnarray}\displaystyle & & \displaystyle \left[z+\int \left(\frac{\unicode[STIX]{x2202}b^{0}}{\unicode[STIX]{x2202}x}/\frac{\unicode[STIX]{x2202}b^{0}}{\unicode[STIX]{x2202}z}\right)\,\text{d}x\right]\pm \text{i}\left[\int \frac{\displaystyle \sqrt{\left(Ro^{2}\frac{\unicode[STIX]{x2202}b^{0}}{\unicode[STIX]{x2202}z}\right)\cdot \left(1+Ro^{2}\frac{\unicode[STIX]{x2202}v^{0}}{\unicode[STIX]{x2202}x}\right)-\left(Ro^{2}\frac{\unicode[STIX]{x2202}b^{0}}{\unicode[STIX]{x2202}x}\right)^{2}}}{\displaystyle \left(Ro^{2}\frac{\unicode[STIX]{x2202}b^{0}}{\unicode[STIX]{x2202}z}\right)}\,\text{d}x\right]\nonumber\\ \displaystyle & & \displaystyle \quad =\text{const}.\end{eqnarray}$$
This is the characteristic solution for which  $\unicode[STIX]{x1D706}$ is constant and
 $\unicode[STIX]{x1D709}=\text{Re}[\unicode[STIX]{x1D706}],\unicode[STIX]{x1D702}=\text{Im}[\unicode[STIX]{x1D706}]$
 $$\begin{eqnarray}\unicode[STIX]{x1D709}=z+\int \left(\frac{\unicode[STIX]{x2202}b^{0}}{\unicode[STIX]{x2202}x}\bigg/\frac{\unicode[STIX]{x2202}b^{0}}{\unicode[STIX]{x2202}z}\right)\,\text{d}x,\end{eqnarray}$$
 $$\begin{eqnarray}\unicode[STIX]{x1D702}=\pm \int \frac{\displaystyle \sqrt{\left(Ro^{2}\frac{\unicode[STIX]{x2202}b^{0}}{\unicode[STIX]{x2202}z}\right)\cdot \left(1+Ro^{2}\frac{\unicode[STIX]{x2202}v^{0}}{\unicode[STIX]{x2202}x}\right)-\left(Ro^{2}\frac{\unicode[STIX]{x2202}b^{0}}{\unicode[STIX]{x2202}x}\right)^{2}}}{\displaystyle \left(Ro^{2}\frac{\unicode[STIX]{x2202}b^{0}}{\unicode[STIX]{x2202}z}\right)}\,\text{d}x.\end{eqnarray}$$
The problem now reduces to solving the equation in the  $\unicode[STIX]{x1D702},\unicode[STIX]{x1D701}$ coordinate system, which is a Laplacian operator equal to an equivalent delta function
 $$\begin{eqnarray}\unicode[STIX]{x1D6F1}_{\unicode[STIX]{x1D709}\unicode[STIX]{x1D709}}+\unicode[STIX]{x1D6F1}_{\unicode[STIX]{x1D702}\unicode[STIX]{x1D702}}=\frac{{\mathcal{D}}(\unicode[STIX]{x1D701},\unicode[STIX]{x1D702})}{{\mathcal{A}}(\unicode[STIX]{x1D701},\unicode[STIX]{x1D702})}\sim \unicode[STIX]{x1D6FF}(\unicode[STIX]{x1D701},\unicode[STIX]{x1D702}).\end{eqnarray}$$
Using the definition for  $\unicode[STIX]{x1D709},\unicode[STIX]{x1D702}$ we can find the boundary conditions on
 $\unicode[STIX]{x1D6F1}$ from the boundary conditions of
 $\unicode[STIX]{x1D719}^{1}$.
Since  $\unicode[STIX]{x1D719}^{1}$ is confined to the frontal region, it can be assumed that far from the front as
 $x\rightarrow \pm \infty$ the first-order velocities vanish
 $$\begin{eqnarray}v^{1}=\frac{\unicode[STIX]{x2202}\unicode[STIX]{x1D719}^{1}}{\unicode[STIX]{x2202}x}=\frac{\unicode[STIX]{x2202}\unicode[STIX]{x1D6F1}}{\unicode[STIX]{x2202}\unicode[STIX]{x1D709}}\cdot \frac{\unicode[STIX]{x2202}\unicode[STIX]{x1D709}}{\unicode[STIX]{x2202}x}=-\frac{\unicode[STIX]{x2202}\unicode[STIX]{x1D6F1}}{\unicode[STIX]{x2202}\unicode[STIX]{x1D709}}\cdot \left(\frac{1}{\displaystyle Ro\frac{\unicode[STIX]{x2202}v^{0}}{\unicode[STIX]{x2202}Z}}\right)=-\frac{\unicode[STIX]{x2202}\unicode[STIX]{x1D6F1}}{\unicode[STIX]{x2202}\unicode[STIX]{x1D709}}\cdot \left(\frac{2}{\text{e}^{\unicode[STIX]{x1D6FE}T}Ro^{2}B_{0}^{\prime }(X)}\right),\end{eqnarray}$$
where we use the definition of the slope in  $X$ coordinates, as in Reference Shakespeare and TaylorST13. The initial buoyancy in
 $X$ coordinates is
 $B_{0}(X)=\frac{1}{2}\text{erf}(X/\sqrt{2})\rightarrow B_{0}^{\prime }(X)=(1/\sqrt{2\unicode[STIX]{x03C0}})\text{e}^{-X^{2}/2}$
 $$\begin{eqnarray}\rightarrow ~~\underset{x\rightarrow \pm \infty }{\lim }\frac{\unicode[STIX]{x2202}\unicode[STIX]{x1D6F1}}{\unicode[STIX]{x2202}\unicode[STIX]{x1D709}}=\underset{x\rightarrow \pm \infty }{\lim }\left[v^{1}\bigg/\frac{2\sqrt{2\unicode[STIX]{x03C0}}\text{e}^{X^{2}/2}}{\text{e}^{\unicode[STIX]{x1D6FE}T}Ro^{2}}\right]=0.\end{eqnarray}$$
Also it can be shown that  $\unicode[STIX]{x1D709}\rightarrow \pm \infty$ as
 $X\rightarrow \pm \infty$ and
 $X\rightarrow \pm \infty$ as
 $x\rightarrow \pm \infty$. Thus we now have the boundary conditions
 $$\begin{eqnarray}\underset{\unicode[STIX]{x1D709}\rightarrow \pm \infty }{\lim \frac{\unicode[STIX]{x2202}\unicode[STIX]{x1D6F1}}{\unicode[STIX]{x2202}\unicode[STIX]{x1D709}}}=0.\end{eqnarray}$$
In a QG system, we use trivial boundary conditions  $\unicode[STIX]{x2202}b^{1}/\unicode[STIX]{x2202}z=\unicode[STIX]{x2202}^{2}\unicode[STIX]{x1D719}^{1}/\unicode[STIX]{x2202}z^{2}=0$.
 $$\begin{eqnarray}\frac{\unicode[STIX]{x2202}\unicode[STIX]{x1D719}^{1}}{\unicode[STIX]{x2202}z}=\frac{\unicode[STIX]{x2202}\unicode[STIX]{x1D6F1}}{\unicode[STIX]{x2202}\unicode[STIX]{x1D702}}\frac{\unicode[STIX]{x2202}\unicode[STIX]{x1D702}}{\unicode[STIX]{x2202}z}~~~\rightarrow ~~~\frac{\unicode[STIX]{x2202}^{2}\unicode[STIX]{x1D719}^{1}}{\unicode[STIX]{x2202}z^{2}}=\frac{\unicode[STIX]{x2202}}{\unicode[STIX]{x2202}z}\left(\frac{\unicode[STIX]{x2202}\unicode[STIX]{x1D6F1}}{\unicode[STIX]{x2202}\unicode[STIX]{x1D702}}\frac{\unicode[STIX]{x2202}\unicode[STIX]{x1D702}}{\unicode[STIX]{x2202}z}\right)=\frac{\unicode[STIX]{x2202}^{2}\unicode[STIX]{x1D6F1}}{\unicode[STIX]{x2202}\unicode[STIX]{x1D702}^{2}}\left(\frac{\unicode[STIX]{x2202}\unicode[STIX]{x1D702}}{\unicode[STIX]{x2202}z}\right)^{2}+\frac{\unicode[STIX]{x2202}\unicode[STIX]{x1D6F1}}{\unicode[STIX]{x2202}\unicode[STIX]{x1D702}}\frac{\unicode[STIX]{x2202}^{2}\unicode[STIX]{x1D702}}{\unicode[STIX]{x2202}z^{2}}.\end{eqnarray}$$
In order to obey the boundary conditions, the limit  $(\unicode[STIX]{x2202}^{2}\unicode[STIX]{x1D6F1}/\unicode[STIX]{x2202}\unicode[STIX]{x1D702}^{2})(\unicode[STIX]{x2202}\unicode[STIX]{x1D702}/\unicode[STIX]{x2202}z)^{2}\ll (\unicode[STIX]{x2202}\unicode[STIX]{x1D6F1}/\unicode[STIX]{x2202}\unicode[STIX]{x1D702})(\unicode[STIX]{x2202}^{2}\unicode[STIX]{x1D702}/\unicode[STIX]{x2202}z^{2})$ implies that
 $$\begin{eqnarray}0=\frac{\unicode[STIX]{x2202}^{2}\unicode[STIX]{x1D719}^{1}}{\unicode[STIX]{x2202}z^{2}}\bigg|_{b.c}=\frac{\unicode[STIX]{x2202}^{2}\unicode[STIX]{x1D6F1}}{\unicode[STIX]{x2202}\unicode[STIX]{x1D702}^{2}}\left(\frac{\unicode[STIX]{x2202}\unicode[STIX]{x1D702}}{\unicode[STIX]{x2202}z}\right)^{2}+\frac{\unicode[STIX]{x2202}\unicode[STIX]{x1D6F1}}{\unicode[STIX]{x2202}\unicode[STIX]{x1D702}}\frac{\unicode[STIX]{x2202}^{2}\unicode[STIX]{x1D702}}{\unicode[STIX]{x2202}z^{2}}\approx \frac{\unicode[STIX]{x2202}\unicode[STIX]{x1D6F1}}{\unicode[STIX]{x2202}\unicode[STIX]{x1D702}}\frac{\unicode[STIX]{x2202}^{2}\unicode[STIX]{x1D702}}{\unicode[STIX]{x2202}z^{2}}\bigg|_{b.c}~~\rightarrow ~~\frac{\unicode[STIX]{x2202}\unicode[STIX]{x1D6F1}}{\unicode[STIX]{x2202}\unicode[STIX]{x1D702}}\bigg|_{b.c}=0.\end{eqnarray}$$
Thus, it is enough to show that  $(\unicode[STIX]{x2202}\unicode[STIX]{x1D702}/\unicode[STIX]{x2202}z)^{2}\ll \unicode[STIX]{x2202}^{2}\unicode[STIX]{x1D702}/\unicode[STIX]{x2202}z^{2}$ and
 $\unicode[STIX]{x2202}^{2}\unicode[STIX]{x1D6F1}/\unicode[STIX]{x2202}\unicode[STIX]{x1D702}^{2}\ll \unicode[STIX]{x2202}\unicode[STIX]{x1D6F1}/\unicode[STIX]{x2202}\unicode[STIX]{x1D702}$, which are given by the scaling argument
 $$\begin{eqnarray}\displaystyle & \displaystyle [\unicode[STIX]{x1D702}]=\frac{\sqrt{[A][C]-[B]^{2}}}{[A]}\cdot L=\frac{\displaystyle \sqrt{\frac{L^{2}}{H^{2}}Ro^{2}}}{\displaystyle \frac{1}{f^{2}}\frac{M^{2}LH}{H^{2}}}\cdot L=Ro^{3}\cdot H, & \displaystyle\end{eqnarray}$$
 $$\begin{eqnarray}\displaystyle & \displaystyle \rightarrow ~~~\left[\left(\frac{\unicode[STIX]{x2202}\unicode[STIX]{x1D702}}{\unicode[STIX]{x2202}z}\right)^{2}\bigg/\frac{\unicode[STIX]{x2202}^{2}\unicode[STIX]{x1D702}}{\unicode[STIX]{x2202}z^{2}}\right]=\frac{\displaystyle \frac{[A][C]-[B]^{2}}{[A]^{2}}\cdot \frac{L^{2}}{H^{2}}}{\displaystyle \frac{\sqrt{[A][C]-[B^{2}]}}{[A]}\cdot \frac{L}{H^{2}}}=\frac{\sqrt{[A][C]-[B]^{2}}}{[A]}\cdot L. & \displaystyle\end{eqnarray}$$
For the Reference Hoskins and BrethertonHB72 case  $Ro\sim O(0.4)$ and
 $H\sim O(10)$ which means that
 $Ro^{3}\cdot H\sim 10^{-3}\times 10^{1}=10^{-2}\ll 1$. Thus
 $(\unicode[STIX]{x2202}\unicode[STIX]{x1D702}/\unicode[STIX]{x2202}z)^{2}\ll \unicode[STIX]{x2202}^{2}\unicode[STIX]{x1D702}/\unicode[STIX]{x2202}z^{2}$.
Next, we want to show that  $\unicode[STIX]{x2202}^{2}\unicode[STIX]{x1D6F1}/\unicode[STIX]{x2202}\unicode[STIX]{x1D702}^{2}\ll \unicode[STIX]{x2202}\unicode[STIX]{x1D6F1}/\unicode[STIX]{x2202}\unicode[STIX]{x1D702}$
 $$\begin{eqnarray}\frac{\unicode[STIX]{x2202}\unicode[STIX]{x1D719}^{1}}{\unicode[STIX]{x2202}x}=\left\{\begin{array}{@{}l@{}}\displaystyle \frac{\unicode[STIX]{x2202}\unicode[STIX]{x1D6F1}}{\unicode[STIX]{x2202}\unicode[STIX]{x1D702}}\frac{\unicode[STIX]{x2202}\unicode[STIX]{x1D702}}{\unicode[STIX]{x2202}x}\quad \\ \displaystyle \frac{\unicode[STIX]{x2202}\unicode[STIX]{x1D6F1}}{\unicode[STIX]{x2202}\unicode[STIX]{x1D709}}\frac{\unicode[STIX]{x2202}\unicode[STIX]{x1D709}}{\unicode[STIX]{x2202}x}\quad \end{array}\right.\rightarrow ~~~\frac{\unicode[STIX]{x2202}\unicode[STIX]{x1D6F1}}{\unicode[STIX]{x2202}\unicode[STIX]{x1D702}}\frac{\unicode[STIX]{x2202}\unicode[STIX]{x1D702}}{\unicode[STIX]{x2202}x}=\frac{\unicode[STIX]{x2202}\unicode[STIX]{x1D6F1}}{\unicode[STIX]{x2202}\unicode[STIX]{x1D709}}\frac{\unicode[STIX]{x2202}\unicode[STIX]{x1D709}}{\unicode[STIX]{x2202}x}~~~\rightarrow ~~~\frac{\unicode[STIX]{x2202}\unicode[STIX]{x1D6F1}}{\unicode[STIX]{x2202}\unicode[STIX]{x1D702}}=\frac{1}{\displaystyle \frac{\unicode[STIX]{x2202}\unicode[STIX]{x1D702}}{\unicode[STIX]{x2202}x}}\frac{\unicode[STIX]{x2202}\unicode[STIX]{x1D6F1}}{\unicode[STIX]{x2202}\unicode[STIX]{x1D709}}\frac{\unicode[STIX]{x2202}\unicode[STIX]{x1D709}}{\unicode[STIX]{x2202}x}.\end{eqnarray}$$
In addition, in the same way as we got (B 15) with  $\unicode[STIX]{x1D702}$, we can do the same with
 $\unicode[STIX]{x1D709}$
 $$\begin{eqnarray}0=\frac{\unicode[STIX]{x2202}^{2}\unicode[STIX]{x1D719}^{1}}{\unicode[STIX]{x2202}z^{2}}\bigg|_{b.c}=\frac{\unicode[STIX]{x2202}^{2}\unicode[STIX]{x1D6F1}}{\unicode[STIX]{x2202}\unicode[STIX]{x1D709}^{2}}\left(\frac{\unicode[STIX]{x2202}\unicode[STIX]{x1D709}}{\unicode[STIX]{x2202}z}\right)^{2}+\frac{\unicode[STIX]{x2202}\unicode[STIX]{x1D6F1}}{\unicode[STIX]{x2202}\unicode[STIX]{x1D709}}\frac{\unicode[STIX]{x2202}^{2}\unicode[STIX]{x1D709}}{\unicode[STIX]{x2202}z^{2}}~~\rightarrow ~~\frac{\unicode[STIX]{x2202}^{2}\unicode[STIX]{x1D6F1}}{\unicode[STIX]{x2202}\unicode[STIX]{x1D709}^{2}}\bigg|_{b.c}=-\frac{\unicode[STIX]{x2202}\unicode[STIX]{x1D6F1}}{\unicode[STIX]{x2202}\unicode[STIX]{x1D709}}\frac{\displaystyle \frac{\unicode[STIX]{x2202}^{2}\unicode[STIX]{x1D709}}{\unicode[STIX]{x2202}z^{2}}}{\displaystyle \left(\frac{\unicode[STIX]{x2202}\unicode[STIX]{x1D709}}{\unicode[STIX]{x2202}z}\right)^{2}}\bigg|_{b.c}.\end{eqnarray}$$
Remembering that our initial Laplacian equation for  $\unicode[STIX]{x1D6F1}$ is equal to zero everywhere except at the point source. Specifically this means that at the boundaries (assuming the point source is not exactly at the boundary)
 $$\begin{eqnarray}\frac{\unicode[STIX]{x2202}^{2}\unicode[STIX]{x1D6F1}}{\unicode[STIX]{x2202}\unicode[STIX]{x1D702}^{2}}+\frac{\unicode[STIX]{x2202}^{2}\unicode[STIX]{x1D6F1}}{\unicode[STIX]{x2202}\unicode[STIX]{x1D709}^{2}}\bigg|_{b.c}=0~~~\rightarrow ~~~\frac{\unicode[STIX]{x2202}^{2}\unicode[STIX]{x1D6F1}}{\unicode[STIX]{x2202}\unicode[STIX]{x1D702}^{2}}\bigg|_{b.c}=-\frac{\unicode[STIX]{x2202}^{2}\unicode[STIX]{x1D6F1}}{\unicode[STIX]{x2202}\unicode[STIX]{x1D709}^{2}}\bigg|_{b.c}=\frac{\unicode[STIX]{x2202}\unicode[STIX]{x1D6F1}}{\unicode[STIX]{x2202}\unicode[STIX]{x1D709}}\frac{\displaystyle \frac{\unicode[STIX]{x2202}^{2}\unicode[STIX]{x1D709}}{\unicode[STIX]{x2202}z^{2}}}{\displaystyle \left(\frac{\unicode[STIX]{x2202}\unicode[STIX]{x1D709}}{\unicode[STIX]{x2202}z}\right)^{2}}\bigg|_{b.c}.\end{eqnarray}$$
Now comparing  $\unicode[STIX]{x2202}^{2}\unicode[STIX]{x1D6F1}/\unicode[STIX]{x2202}\unicode[STIX]{x1D702}^{2},\unicode[STIX]{x2202}\unicode[STIX]{x1D6F1}/\unicode[STIX]{x2202}\unicode[STIX]{x1D702}$ by using the expressions found for each on the boundaries and the scaling of the problem
 $$\begin{eqnarray}\displaystyle \left[\frac{\unicode[STIX]{x2202}^{2}\unicode[STIX]{x1D6F1}}{\unicode[STIX]{x2202}\unicode[STIX]{x1D702}^{2}}\bigg/\frac{\unicode[STIX]{x2202}\unicode[STIX]{x1D6F1}}{\unicode[STIX]{x2202}\unicode[STIX]{x1D702}}\right] & = & \displaystyle \left[\frac{\unicode[STIX]{x2202}\unicode[STIX]{x1D702}}{\unicode[STIX]{x2202}x}\frac{\unicode[STIX]{x2202}^{2}\unicode[STIX]{x1D709}}{\unicode[STIX]{x2202}z^{2}}\right]\bigg/\left[\frac{\unicode[STIX]{x2202}\unicode[STIX]{x1D709}}{\unicode[STIX]{x2202}x}\left(\frac{\unicode[STIX]{x2202}\unicode[STIX]{x1D709}}{\unicode[STIX]{x2202}z}\right)^{2}\right]=\frac{\displaystyle \frac{[\unicode[STIX]{x1D702}]}{L}\frac{[\unicode[STIX]{x1D709}]}{H^{2}}}{\displaystyle \frac{[\unicode[STIX]{x1D709}]}{L}\frac{[\unicode[STIX]{x1D709}]^{2}}{H^{2}}}=\frac{[\unicode[STIX]{x1D702}]}{[\unicode[STIX]{x1D709}]^{2}}\nonumber\\ \displaystyle & = & \displaystyle \frac{\displaystyle \frac{\sqrt{AC-B^{2}}}{A}L}{\displaystyle \left(H+\frac{B}{A}L\right)^{2}}=\frac{1}{4RoH}\sim \frac{1}{1.6H}\ll 1.\end{eqnarray}$$
Thus also  $\unicode[STIX]{x2202}^{2}\unicode[STIX]{x1D6F1}/\unicode[STIX]{x2202}\unicode[STIX]{x1D702}^{2}\ll \unicode[STIX]{x2202}\unicode[STIX]{x1D6F1}/\unicode[STIX]{x2202}\unicode[STIX]{x1D702}$ which means that
 $\unicode[STIX]{x2202}^{2}\unicode[STIX]{x1D6F1}/\unicode[STIX]{x2202}\unicode[STIX]{x1D702}^{2}\left(\unicode[STIX]{x2202}\unicode[STIX]{x1D702}/\unicode[STIX]{x2202}z\right)^{2}\ll (\unicode[STIX]{x2202}\unicode[STIX]{x1D6F1}/\unicode[STIX]{x2202}\unicode[STIX]{x1D702})(\unicode[STIX]{x2202}^{2}\unicode[STIX]{x1D702}/\unicode[STIX]{x2202}z^{2})$.
It can be shown that  $\unicode[STIX]{x1D702}\rightarrow \infty$ as
 $z\rightarrow -\infty$ and we can define
 $\unicode[STIX]{x1D702}=\unicode[STIX]{x1D702}_{0}$ for
 $z=0$.
Thus we now have the second boundary conditions
 $$\begin{eqnarray}\underset{\unicode[STIX]{x1D702}\rightarrow \infty ,\unicode[STIX]{x1D702}_{0}}{\lim \frac{\unicode[STIX]{x2202}\unicode[STIX]{x1D6F1}}{\unicode[STIX]{x2202}\unicode[STIX]{x1D702}}}=0.\end{eqnarray}$$
Now we can use Green’s functions theory to solve this equation with von Neumann boundary conditions on a half-plane
 $$\begin{eqnarray}\displaystyle & \displaystyle \underset{\unicode[STIX]{x1D709}\rightarrow \pm \infty }{\lim \frac{\unicode[STIX]{x2202}\unicode[STIX]{x1D6F1}}{\unicode[STIX]{x2202}\unicode[STIX]{x1D709}}}=0, & \displaystyle\end{eqnarray}$$
 $$\begin{eqnarray}\displaystyle & \displaystyle \underset{\unicode[STIX]{x1D702}\rightarrow \infty ,\unicode[STIX]{x1D702}_{0}}{\lim \frac{\unicode[STIX]{x2202}\unicode[STIX]{x1D6F1}}{\unicode[STIX]{x2202}\unicode[STIX]{x1D702}}}=0. & \displaystyle\end{eqnarray}$$
We can solve a linear PDE with an operator  ${\mathcal{L}}$ using the following method:
 $$\begin{eqnarray}{\mathcal{L}}\{\unicode[STIX]{x1D6F1}\}=F(\unicode[STIX]{x1D702},\unicode[STIX]{x1D709})\sim \hat{q}(t)\unicode[STIX]{x1D6FF}(\unicode[STIX]{x1D702}-p,\unicode[STIX]{x1D709}-s).\end{eqnarray}$$
We are looking for
 $$\begin{eqnarray}{\mathcal{L}}\{G(\unicode[STIX]{x1D702},\unicode[STIX]{x1D709};p,s)\}=\unicode[STIX]{x1D6FF}(\unicode[STIX]{x1D702}-p,\unicode[STIX]{x1D709}-s).\end{eqnarray}$$
Multiplying by  $F(p,s)$ and integrating by
 $p,s$
 $$\begin{eqnarray}\int {\mathcal{L}}\{G(\unicode[STIX]{x1D702},\unicode[STIX]{x1D709};~p,s)\}F(p,s)\,\text{d}p\,\text{d}s=\int \unicode[STIX]{x1D6FF}(\unicode[STIX]{x1D702}-p,\unicode[STIX]{x1D709}-s)F(p,s)\,\text{d}p\,\text{d}s=F(\unicode[STIX]{x1D702},\unicode[STIX]{x1D709}).\end{eqnarray}$$
Since  ${\mathcal{L}}$ is a linear operator, acting on
 $(\unicode[STIX]{x1D702},\unicode[STIX]{x1D709})$ we can take it out of the integral which acts on
 $(p,s)$
 $$\begin{eqnarray}\displaystyle {\mathcal{L}}\{\unicode[STIX]{x1D6F1}\}=F(\unicode[STIX]{x1D702},\unicode[STIX]{x1D709})=\int {\mathcal{L}}\{G(\unicode[STIX]{x1D702},\unicode[STIX]{x1D709};p,s)\}F(p,s)\,\text{d}p\,\text{d}s={\mathcal{L}}\left[\int G(\unicode[STIX]{x1D702},\unicode[STIX]{x1D709};p,s)F(p,s)\,\text{d}p\,\text{d}s\right]. & & \displaystyle \nonumber\\ \displaystyle & & \displaystyle\end{eqnarray}$$
Thus the solution for  $\unicode[STIX]{x1D6F1}(\unicode[STIX]{x1D702},\unicode[STIX]{x1D709})$ is given by
 $$\begin{eqnarray}\unicode[STIX]{x1D6F1}(\unicode[STIX]{x1D702},\unicode[STIX]{x1D709})=\int G(\unicode[STIX]{x1D702},\unicode[STIX]{x1D709};p,s)F(p,s)\,\text{d}p\,\text{d}s.\end{eqnarray}$$
Since  $F(\unicode[STIX]{x1D702},\unicode[STIX]{x1D709})\sim \hat{q}(t)\,\unicode[STIX]{x1D6FF}(\unicode[STIX]{x1D702}-p,\unicode[STIX]{x1D709}-s)$, the Green’s function is proportional to the function
 $\rightarrow \unicode[STIX]{x1D6F1}\sim G$.
We are looking for a solution matching two point sources on a half-plane with homogeneous von Neumann boundary conditions. This means we need to use the method of images in order to find the appropriate solution. In order to satisfy the boundary condition  $\unicode[STIX]{x2202}\unicode[STIX]{x1D6F1}/\unicode[STIX]{x2202}\unicode[STIX]{x1D702}|_{\unicode[STIX]{x1D702}=\unicode[STIX]{x1D702}_{0}}=0$, we need to add two image point sources of the same magnitude, sign and distance from the boundary as the point sources located at the front.
The Green’s function matching von Neumann boundary conditions is
 $$\begin{eqnarray}G(\unicode[STIX]{x1D709},\unicode[STIX]{x1D702};\unicode[STIX]{x1D709}^{\prime },\unicode[STIX]{x1D702}^{\prime })=-\frac{1}{4\unicode[STIX]{x03C0}}\frac{1}{\sqrt{(\unicode[STIX]{x1D709}-\unicode[STIX]{x1D709}^{\prime })^{2}+(\unicode[STIX]{x1D702}-\unicode[STIX]{x1D702}^{\prime })^{2}}}.\end{eqnarray}$$
In our problem each point source is multiplied by a factor of  ${\mathcal{D}}(\unicode[STIX]{x1D709}_{f},\unicode[STIX]{x1D702}_{f},t)/{\mathcal{A}}(\unicode[STIX]{x1D709}_{f},\unicode[STIX]{x1D702}_{f},t)$, so the total Green’s function, which is also the solution for
 $\unicode[STIX]{x1D6F1}$, is
 $$\begin{eqnarray}\displaystyle \unicode[STIX]{x1D6F1}(\unicode[STIX]{x1D709},\unicode[STIX]{x1D702}) & = & \displaystyle -\frac{1}{4\unicode[STIX]{x03C0}}\frac{\hat{q_{ft}}}{{\mathcal{A}}_{ft}}\frac{1}{\sqrt{(\unicode[STIX]{x1D709}-\unicode[STIX]{x1D709}_{ft})^{2}+(\unicode[STIX]{x1D702}-\unicode[STIX]{x1D702}_{ft})^{2}}}-\frac{1}{4\unicode[STIX]{x03C0}}\frac{\hat{q_{ft}}}{{\mathcal{A}}_{ft}}\frac{1}{\sqrt{(\unicode[STIX]{x1D709}-\unicode[STIX]{x1D709}_{ft})^{2}+(\unicode[STIX]{x1D702}+\unicode[STIX]{x1D702}_{ft})^{2}}}\nonumber\\ \displaystyle & & \displaystyle -\,\frac{1}{4\unicode[STIX]{x03C0}}\frac{\hat{q_{fb}}}{{\mathcal{A}}_{fb}}\frac{1}{\sqrt{(\unicode[STIX]{x1D709}-\unicode[STIX]{x1D709}_{fb})^{2}+(\unicode[STIX]{x1D702}-\unicode[STIX]{x1D702}_{fb})^{2}}}-\frac{1}{4\unicode[STIX]{x03C0}}\frac{\hat{q_{fb}}}{{\mathcal{A}}_{fb}}\frac{1}{\sqrt{(\unicode[STIX]{x1D709}-\unicode[STIX]{x1D709}_{fb})^{2}+(\unicode[STIX]{x1D702}+\unicode[STIX]{x1D702}_{fb})^{2}}}.\nonumber\\ \displaystyle & & \displaystyle\end{eqnarray}$$
This is the solution for the first-order geostrophic potential  $\unicode[STIX]{x1D719}^{1}$ in
 $\unicode[STIX]{x1D709},~\unicode[STIX]{x1D702}$ space.



