Introduction
There is clear evidence of climate-system variability at millennial-scale frequencies during the last glacial period. the most striking records are those from Greenland ice cores (e.g. Reference Dansgaard and TakahashiDansgaard and others, 1984, Reference Dansgaard1993) and North Atlantic marine sediments (e.g. Reference BondBond and others, 1993; Reference Oppo and Lehman.Oppo and Lehman, 1995), but other evidence from both land and sea, even outside the high-latitude regions of the Northern Hemisphere (e.g. Reference Clark and Bartlein.Clark and Bartlein, 1995; Reference Porter and AnPorter and An, 1995; Reference Behl and KennettBehl and Kennett, 1996; Reference Charles, Lynch-Stieglitz, Ninnemann and FairbanksCharles and others, 1996), suggests that this variability may have been more widespread. Such variations may have existed in Antarctica, even if the warm interstadials recorded in Greenland 20 000–40000 years ago are small or even absent (e.g. Reference Sowers and BenderSowers and Bender, 1995; Reference Mazaud, Vimeux and JouzelMazaud and others, 2000).
Recently, millennial-scale variability of the climate system has been demonstrated for the Holocene, particularly by unambiguous evidence arising from North Atlantic marine sediments (Reference BondBond and others, 1997; Reference Marchitto and OppoMarchitto and others, 1998; Reference Bianchi and McCaveBianchi and McCave, 1999; Reference Giraudeau and BondGiraudeau and others, 2000). Similar oscillations were also suggested in ice-core records from Greenland (Reference MayewskiMayewski and others, 1997) as well as in marine sediments from the Indian Ocean (Sarkar and others, 2000). the Southern Hemisphere lacks documentation on this matter, though a record from a marine sediment core off the Chilean coast contains similar millennial-scale fluctuations (Reference Lamy, Hebbeln, Rohl and WeferLamy and others, 2001).
In this context, we have analyzed the insoluble dust in the new Antarctic ice record from EPICA (European Project for Ice Coring in Antarctica) Dome C (75˚06’ S, 123˚23’ E) which spans the last 27000 years (Reference JouzelJouzel and others, 2001). Our study focuses on the Last Glacial Maximum (LGM)–Holocene changes in dust-particle concentration and size distribution and reveals evidence of millennial-scale oscillations in Antarctica over the period 13 000–2000years ago.
Analytical Procedure
A total of 360 levels within the new 580 mdeep EPICA Dome C ice core were analyzed for insoluble dust concentration and size distribution. for the period 2000–13 000 years ago, which includes most of the Holocene, we processed 265 samples, representing a temporal resolution of one sample every 40 years. Each sample (5 cm) integrates at least 2–3 years of accumulation. the decontamination procedure, the preparation of the samples for analysis and the analytical instrument (Coulter Counter Multisizer IIe(©), 256-channels) were the same as those used for preliminary studies and are described in Reference Delmonte, Petit and MaggiDelmonte and others (2002). Due to the very low concentrations involved, rigorous decontamination and calibration procedures have been applied. Our counter allows detection of particles with diameters larger than 0.7 μm. the number of particles with diameters larger than 5 μm is close to zero in EPICA ice. the upper limit of the continuous distribution is given by the first channel preceding the channel with zero particles on three successive measurements. This allows us to separate spurious counts caused by electric noise and/or very large particles introduced by possible contamination of the samples. More than 99 % of the total number ofparticles for both LGM and Holocene samples are in the 0.7–5 μm interval. the number of channels in this interval is ≈140, and particle size between two adjacent channels increases geometrically by a factor of 1.014.
A mass-size distribution was calculated from the volume-size distribution for each sample assuming a particle density of 2.5 g cm–3 and fitted using a lognormal function. As described in previous studies (e.g. Reference Royer, deAngelis and PetitRoyer and others, 1983; Reference SteffensenSteffensen, 1997), this function defines distributions using three parameters: the total mass (Mt), the modal diameter (Dv), where the derivative is null, and the geometric standard deviation (σg), which describes how closely the particle size is distributed around the mode.
Results
The deuterium record (Reference JouzelJouzel and others, 2001) is taken as the climatic reference in Figure 1a. It exhibits low values for the glacial LGM period (before≈18 000 years ago), a transitional phase showing a two-step pattern during the Antarctic Cold Reversal (ACR) phase, then higher values for the Holocene starting at about 11500 years ago.
Climate and dust records over 27 000 years from EPICA Dome C. (a) Deuterium content (Reference JouzelJouzel and others, 2001); (b) dust number concentration (g–1); (c) dust mass concentration (ppb); (d) nss-Ca (from Reference Röthlisberger, Hutterli and SommerRöthlisberger and others, 2000). the dotted line at 14 600 years ago marks the end of the major dust decrease that characterizes the deglaciation.
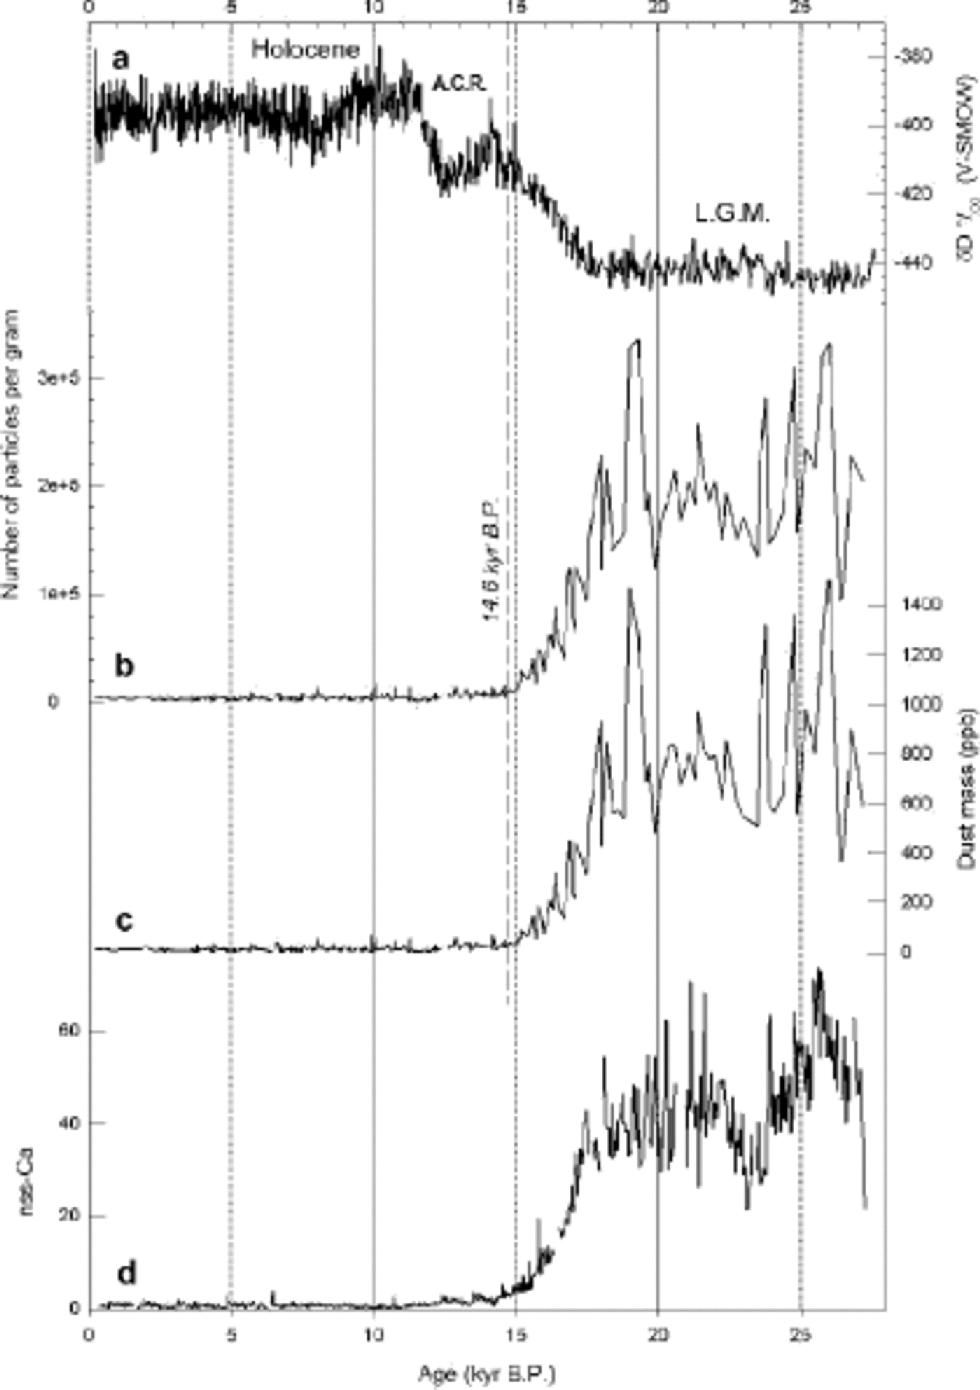
The total dust-particle number concentration pergram(g–1) and total mass(μg kg–1 or 10–9 g g–1or ppb)of the EPICA icecore are shown in Figure 1b and c along with the non-sea-salt calcium (nss-Ca) concentration from continuous flowline analysis, taken as a proxy for continent al wind-blown dust (Reference Röthlisberger, Hutterli and SommerRöthlisberger and others, 2000 and references therein). the dust concentrations are higher in number and mass during the LGM (197000+63000 g–1, 790+300 ppb for the period 27000– 18 000 years ago) than during the warmer Holocene period (3900±2000g–1, 15+9 ppb for the period 11400–2000years ago). During deglaciation, the drastic decrease in dust concentration (1.5 orders of magnitude) starts at ≈18 000 years ago, roughly at the same time as the isotope change,and ends at about 14 600 years ago. TheratiobetweenmeanLGMandHolocene dust concentrations is about55forbothnumberandmass.Given that the snow-accumulation rate during the glacial period was about one-half that during the Holocene,the change in dust flux is actually a factor of 27.
The three-parameter lognormal distribution suitably depicts the main differences between glacial and Holocene particles. the fitted distributions show correlation coefficients of up to 0.98 for highly concentrated LGM samples but only 0.75 for the very low concentrations of Holocene samples. We made sure this had no consequences for our results by checking that the change in the calculated mode of the distribution correctly followed the observations and did not bias the data. for example, a change of 0.12 μm in the mode of the lognormal fit reflects a mean increase in mass concentration represented by coarse particles (>3 μm) of 3–4%. the observed oscillations of Dv from 1.9 to 2.4 μm during the Holocene (see below) would therefore represent a change of 15% in large-particle mass contribution. In Figure 2a, the normalized distribution clearly displays a larger mode and a greater proportion of large particles for the Holocene than for the LGM.
Dust size distributions in the EPICA Dome C record. (a) Average Holocene (black squares) and LGM (open circles) mass-size distributions normalized to 100% and dV /dlog r expressed in relative units (%). ( b) LGM/Holocene ratio (relative and absolute) as function of particle diameters.
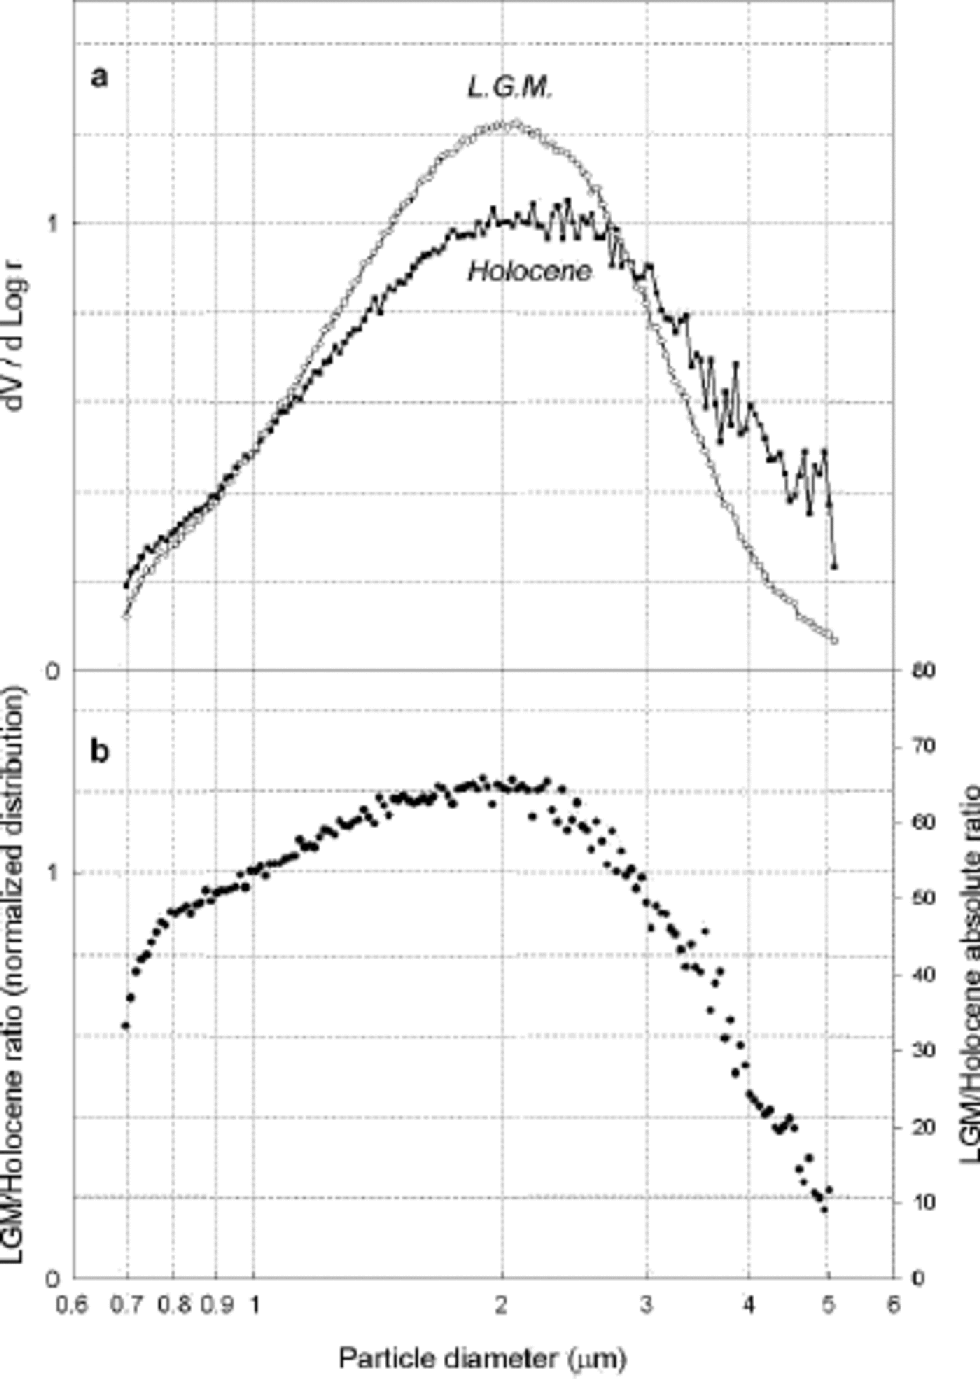
Figure 2b shows that the LGM/Holocene ratio varies with size, in particular being much smaller for large particles. Compared to the Holocene size distributions, LGM distributions display more small (1–3 μm) and fewer coarse (3–4 μm) particles. the ratio of particles with diameters of 2–5 μm decreases approximately as a function of the third power of the diameter (i.e. it is proportional to the mass), suggesting that depletion of large particles might be due to an apparent gravitational settling during transport. In addition, glacial samples display very similar modal diameters (mean Dv is 1.9±0.07 μm) and σg values (1.6±0.03). for Holocene samples, both parameters are higher and display a larger variability: mean Dv of 2.07±0.24 μm, and σg of 1.8±0.15.
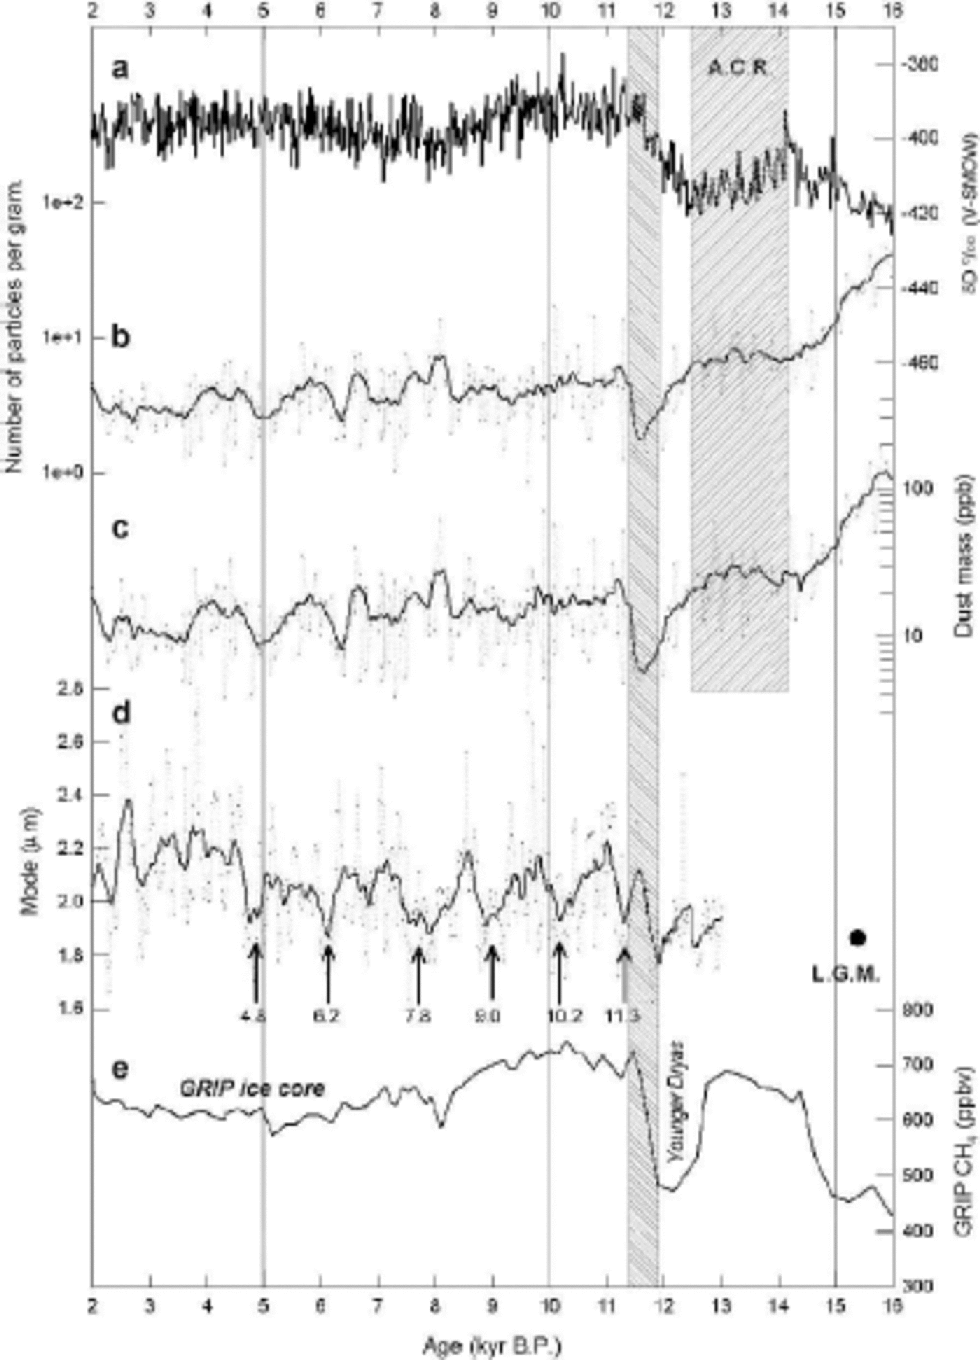
Figure 3 displays the number and mass concentration, the mode of the mass-size distribution of dust for the period 13 000–2000years ago along with Greenland CH4 record from the Greenland Icecore Project (GRIP) ice core. During deglaciation, dust decreases sharply to 14 600 years ago and then remains at a level of ≈30 ppb and 6000 g–1 during the ACR (Fig.3b and c). This event is followed immediately by a further decrease to a value of 6±3 ppb (1900±1300 g–1 ) that marks the absolute minimum for the whole profile. This phase is well depicted in the profile and spans about 200 years, centred around 11500–11600 years ago; it seems to correspond to the end of the Younger Dryas in Greenland (Fig. 3e) which was marked by the methane rise and was taken as a stratigraphic marker (Reference JouzelJouzel and others, 2001; Reference Schwander, Jouzel, Hammer, Petit, Udisti and WolffSchwander and others, 2001) to link GRIP and EPICA ice-core chronologies. Actually, the expected dating uncertainty of +250 years at 11500 years ago does not allow us to depict the exact phasing of these two events (see below).
Climate and dust records and CH4 record over the last 16 000 years. (a) Deuterium taken from Reference JouzelJouzel and others (2001); (b) dust number concentration (g –1); (c) dust mass concentration (ppb); (d) mode (Dv) of the lognormal fit of the mass-size distribution. ( e) CH4 from GRIP is also reported (Reference Chappellaz, Blunier, Raynaud, Barnola, Schwander and StaufferChappellaz and others, 1993). the smoothed dust records (black lines) represent the unweighted running averages over 280 years (seven samples) of individual measurements (dots). Arrows in ( d) refer to the periods during which minimum modal values occur. the LGM value represents the mean Dv for the period 20 000–27 000 years ago. the grey box on the right includes the ACR; the one on the left the period with the minimum dust concentration. for this latter, the width of the box represents the location of absolute minimum concentrations, with a shift of +250 years that represents the expected uncertainty in the time-scale at 11500 years ago.

From 11500 to 2000 years ago the number and mass concentration display a gradual decrease from ≈4000 to ≈2000 g–1 and from 30 to 15 ppb, respectively.
Figure 3d shows the Dv profile. Except for a value at 12000 years ago, all Holocene Dv values are higher than the mean LGM value. the profile also shows structured fluctuations suggesting some cycles with a millennial-scale periodicity. These are more evident before 5000 years ago, and five cycles can be observed in the profile 11300–4800years ago. the minima are separated by 1100–1600 years. Spectral analysis of the data (not shown) reveals several bands, one of which peaks at 1300 years (with F-test confidence levels >95%, using the multi-taper method). There appear to be other significant higher-frequency oscillations corresponding to multi-century periods, but they require further study before conclusions are drawn. from 11300 to 4800 years ago, Dv oscillates around 2.03+0.2 mm. Then a step increase is observed, followed by oscillations around 2.15+0.2 μm. Moreover, the millennial oscillations become less clear or are dampened by higher-frequency oscillations.
Each millennial-scale oscillation in the Holocene part of the EPICA ice core includes an average of 30 samples. As shown by Reference Benoist and PourchetBenoist and others (1982), even structured fluctuations may have no climatic significance. Up to now there are no detailed data from other cores about fluctuations in dust size distribution, and no such data exist even for the old Dome C core.This feature thus needs to be confirmed by replication in other records.
Discussion
LGM–Holocene changes
There is widespread evidence in polar and low-latitude ice cores (e.g. Reference Petit, Briat and RoyerPetit and others, 1981, Reference Petit1999; Reference Briat, Royer, Petit and LoriusBriat and others, 1982; Reference HanssonHansson, 1994; Reference SteffensenSteffensen 1997), as well as in marine (e.g. Reference ReaRea, 1994) and terrestrial deposits (e.g. Reference KuklaKukla, 1989), that the atmospheric dust load was greater during glacial periods. the nature of insoluble microparticles of continental origin deposited in polar areas is the end result of a series of factors including the source areas, long-range transport mechanisms and mode of deposition (Reference Basile, Grousset, Revel, Petit and Barkov.Basile and others, 1997). the environmental conditions at the source area primarily affect dust production, with wind strength determining mobilization and aeolian deflation. Deserts, arid regions with scarce vegetation, are good candidates for aeolian erosion. the regional meteorological conditions must also be favourable for dust ascension and injection into the upper troposphere. Subsequently, atmospheric circulation must be of sufficient strength to transport dust over distances of up to 10 000 km, taking several days or weeks. Dust is removed from the atmosphere by both gravitational settling and scavenging processes that are mostly linked to the hydrological cycle and the presence of water. Different atmospheric circulation patterns can yield longer or shorter paths and therefore different dust-transport times from the source to the ice sheet. Deposition in the central polar area occurs mostly by dry deposition (Reference De Angelis, Legrand, Clausen and HammerDe Angelis and others, 1997). Finally, the dust concentration in the ice will also depend on the snow-accumulation rate, which in turn depends on the local climate (Reference AlleyAlley and others, 1995).
The high dust concentration in polar ice cores during the LGM can therefore be interpreted as the result of both regional and large-scale factors as well as several concomitant conditions. There is considerable evidence to suggest that the LGM was windy and that the continents were arid with reduced vegetation (Reference MahowaldMahowald and others, 1999). In parallel to the extension of glaciers in mountainous areas, periglacial processes such as erosion from frost action were more widespread. This may have produced fine sediments in rivers and outwash plains. Loess deposits and other aeolian features characterize the late Quaternary period (Reference CharlesworthCharlesworth,1957). In a colder climate, the reduction in the intensity of the hydrological cycle affects vegetation and also reduces scavenging of dust in the atmosphere. It is generally thought that the steeper latitudinal temperature gradient during the LGM intensified the Westerlies circulation (CLIMAP Project Members, 1976). However, the effect on the dust concentration in Antarctica is not obvious since general circulation model simulations do not predict drastic changes (e.g. Reference JoussaumeJoussaume, 1993).
Previous studies on Dome C ice cores (Reference Petit, Briat and RoyerPetit and others, 1981; Reference DeAngelis, Legrand, Petit and BarkovDe Angelis and others, 1984) yielded values similar to ours. However, they suggested the presence of slightly coarser particles during the LGM than in the Holocene, and interpreted this as evidence of more efficient transport. Our new measurements from EPICA Dome C show the old Dome C data to be inaccurate. Thanks to the high quality of the new core and improvements in analytical measurement techniques (a 256-channel instead of a 16- channel counter) we now have a consistent set of high- quality data comprising ≈360 measurements of particle concentrations and size distributions. for particles 2 μm in diameter the difference between two channels is about 0.029 μm, while for the old instrument it was about 0.5 μm. the analytical precision thus has increased by a factor of 16. Moreover, for the old Dome C data the total number of samples was only 50 for the last 27000 years, and only 10 of these were from the Holocene.
Our new results clearly indicate differences between LGM and Holocene dust, in terms of both absolute concentration and size distribution. the LGM/Holocene ratio is ≈55 in absolute concentration and ≈27 in flux. This is higher than the previous value of 10–30 (Reference Petit, Briat and RoyerPetit and others, 1981), likely due to the lower Holocene concentrations found for EPICA. By comparison, EPICA nss-Ca (Fig. 1), taken as a proxy for continental dust, changes from ≈50 ppb (LGM) to ≈2 ppb (Holocene), representing a factor of ≈25 in concentration and ≈12 in flux. This difference from our values in the LGM/ Holocene ratio may be due to either a change in the Ca content of the dust (e.g. Ca content would be about 7% and 14% for Holocene and LGM dust, respectively) or a higher Ca content in the large particles than in the smaller particles. Further work is needed to clarify this point.
Dust is transported to high altitudes in the troposphere to reach inland sites of the East Antarctic plateau at 4000ma.s.l. Dust mainly has a continental origin (Reference Briat, Royer, Petit and LoriusBriat and others, 1982; Reference Gaudichet, Lefevre and PetitGaudichet and others, 1988). Its isotopic signature for Vostok and Dome C cores, based on 87Sr/86Sr and 143Nd/144Nd (Reference GroussetGrousset and others, 1992; Reference Basile, Grousset, Revel, Petit and Barkov.Basile and others, 1997), suggests that the Patagonia region in southern South America is likely the main source for the LGM period. for the Holocene, preliminary measurements suggest an isotopic signature compatible with a southern South American origin (Reference BasileBasile, 1997). In addition, the preferential atmospheric pathway for dust transport from South America to East Antarctica is suggested by the relative abundance of volcanic ash layers found in the Vostok core, most originating from South Sandwich volcanoes located in the southern South Atlantic (Reference BasileBasile,1997; Reference Basile, Touron, Grousset and Barkov.Basile and others, 2001). Moreover, back-trajectory analysis using the U.K. Meteorological Office Unified Model applied to present-day and LGM conditions suggests that 80 % of air masses arriving at Dome C have passed over South America, and almost 20% over Australia. This ratio is almost unchanged during the course of the year and for each season (Reference LuntLunt and Valdes, 2001). We assume therefore that dust in EPICA (and likely for East Antarctica) originated mainly from southern South America during both the LGM and the Holocene.
During the glacial period, southern South America was colder and dryer than during the Holocene. the equilibrium line of Patagonian glaciers was considerably lower (Reference Hulton and ClappertonHulton and others, 1994), periglacial erosion processes were intense, and the environment was favourable for dust mobilization and deflation (Reference ClappertonClapperton, 1993). the ≈120m drop in sea level caused an increase in the emerged area by a factor of about 2 in this region. Sea ice extended further northward, especially in the South Atlantic (Reference Burckle and CirilliBurckle and Cirilli, 1987). the polar front as well as the Westerlies belt moved northward, significantly affecting southern South American climate (Reference HeusserHeusser,1989).
We believe therefore that the drastic change in the dust concentration between the LGM and the Holocene (Fig.1) is the result of a number of concomitant factors including changes in the climate and environment at the source, the transport mechanism and conditions in the Southern Ocean. the decrease of dust is also the result of a milder and wetter climate at the source, as well as an increased intensity of the hydrological cycle, enhancing evaporation and precipitation to produce more efficient scavenging of aerosol.
The change in the size distribution provides certain indications concerning the long-range transport of the continental aerosol. At first glance, a closer source such as the ice-free areas of Antarctica could be used to explain the greater proportion of large particles during the Holocene; however, preliminary Sr-Nd measurements indicate southern South America as the source. In addition, ice-free areas in Antarctica likely increased in the course of the Holocene. Therefore, the dust concentration in ice should increase, whereas the observed concentration decreases at the same time as the particle size increases. Therefore, Antarctica is unlikely to be a significant source.
With respect to the LGM distributions, the Holocene in the EPICA ice core displays a relatively higher content of large particles (>3 μm) as well as less sorted distributions. Interestingly, the proportion of coarse particles (>2μm) was also greater in Greenland ice cores during the Holocene (6.4–11.9%) than during the LGM (3.9–6.1%) (Reference SteffensenSteffensen, 1997). the changes in EPICA could be explained by an apparent shorter time of transport towards this site. Indeed, we believe that during the LGM the polar front was located farther north, the very cold temperatures forming a strong thermal Antarctic anticyclone and an efficient barrier against direct penetration of warm subantarctic air masses. on the other hand, during the Holocene, Antarctica was warmer and the barrier effect became less efficient as the polar front moved southward.
We also speculate that the decrease in the efficiency of the polar front as a barrier is linked to the change in sea-ice extent around Antarctica, as suggested by marine records (Reference Burckle and CookeBurckle and Cooke, 1983).
Holocene dust changes
There are certain features of particular interest in the record, such as the plateau in dust concentration during the ACR phase, the development of a 200 year phase of very low concentrations reaching a minimum value around 11500 years ago, and a general decrease during the Holocene.
For the ACR period, the slightly greater values of dust concentration with respect to the average Holocene values do not represent a return to glacial conditions as is the case for the Younger Dryas in the Northern Hemisphere. They may be the result of slight changes in the environmental conditions in southern South America at that time. However, the evidence in this region is unclear and still subject to debate. Some glaciological (e.g. Reference McCulloch and Bentley.McCulloch and Bentley, 1998; Reference WenzensWenzens, 1999) and palynological proxies (e.g. Reference Heusser and RabassaHeusser and Rabassa, 1987; Reference HeusserHeusser, 1993) indicate a cooling phase which likely enhanced periglacial processes and therefore dust sources, while others (Asworth and Hoganson, 1993; Reference Lumey and SwitsurLumey and Switsur, 1993; Reference MarkgrafMarkgraf,1993) do not show this signature.
The well-marked period of minimum dust concentrations starts around 12 000 years ago and reaches its lowest values 11500–11600 years ago. the EPICA record suggests that southern South American dust sources were also less active at this time, which could correspond to a period of increased humidity at this time in this area and simultaneously could also correspond to higher precipitation rates at the EPICA site. This event seems to correspond to the methane rise in the Northern Hemisphere (Fig. 3e) which marks the end of the Younger Dryas cold phase (Reference Chappellaz, Blunier, Raynaud, Barnola, Schwander and StaufferChappellaz and others, 1993) and is used as stratigraphic marker for the EPICA chronology. However, the uncertainty of the EPICA time-scale is estimated to be +200 years at 10 000 years ago, and +2000 years for the glacial period (Reference Schwander, Jouzel, Hammer, Petit, Udisti and WolffSchwander and others, 2001), and this does not allow us to state if the absolute minimum of dust concentration coincides with the beginning of the methane rise or with the culmination of the methane peak at the end of the Younger Dryas (see shaded area in Fig. 3).
Since this methane increase at 11500 years ago was associated with a sudden warming and extension of wetlands in the Northern Hemisphere, we speculate that it also corresponds to significant rapid climatic changes in southern South America and Antarctica, and therefore could have been of interhemispheric to global extent.
Dust concentration displays a gradual decreasing trend from 11600 to 2000 years ago. We speculate that this represents a progressive reduction in primary dust production and mobilization at the source. This is probably related to several factors including a decrease in periglacial processes, an increase in biological activity, the pedogenesis of soils as well as the expansion of the vegetation cover leading to an enhanced dust-trapping effect.
In addition, changes in the mode of the volume-size distribution of the particles (Fig. 3d) indicate some organized fluctuations with an apparent millennial-scale periodicity (on average, 1200–1600 years), well marked between 11500 and 4800 years ago. Other significant oscillations at higher frequency are also present in the record, but they need to be studied in further detail. A step-like change occurs around 4800 years ago, and the average mode increases by ≈0.12 μm (Fig. 3).
Evidence of millennial-scale variability of the climate system has already been found for the last glaciation (e.g. Reference Adams, Maslin and ThomasAdams and others, 1999). Recently, several records have also suggested millennial periodicity for the Holocene, such as marine sediments from the North Atlantic Ocean (Reference BondBond and others, 1997; Reference Marchitto and OppoMarchitto and others, 1998; Reference Bianchi and McCaveBianchi and McCave, 1999; Reference Giraudeau and BondGiraudeau and others, 2000) showing an apparent periodicity of 1400–1500 years but with large bandwidths (+500 years). Such bandwidths make direct correlation with events from our Antarctic record difficult. Note also that a similar periodicity has been suggested in the ice chemistry of the Greenland Ice Sheet Project 2 ice core (Reference MayewskiMayewski and others, 1997) but it did not appear in the Holocene δ18O record (Reference Grootes and StuiverGrootes and Stuiver, 1997). In addition to the low amplitude of these periodicities, the chronological uncertainties between records as well as the often inadequate temporal resolution of marine records make it difficult to accurately determine the pacing of millennial and centennial variations.
The origin of the observed millennial-scale variations in the climate system is still not understood. Reference Broecker and SutherlandBroecker (1999, Reference Broecker2000) suggests an internal ocean–atmosphere variability, while Reference Stuiver and Braziunas.Stuiver and Braziunas (1993) and Reference Van Geel, Raspopov and JVan Geel and others (1999) support the hypothesis of a forcing on the climate system induced by changes in solar activity. Harmonics of orbital frequencies have been studied by Reference Pestiaux and BergerPestiaux and others (1988) and Reference Loutre, Berger and BretagnonLoutre and others (1992), but these have longer periods.
To date, such events are poorly documented in the Southern Hemisphere for the Holocene. Interestingly, a high-resolution marine record covering the last 7000 years on the continental slope off southern Chile (Reference Lamy, Hebbeln, Rohl and WeferLamy and others, 2001) has been obtained at a site with high sedimentation rates. This record is sensitive to changes in rainfall and is in turn linked to latitudinal shifts of the Westerlies. Millennial periodicity similar to that from North Atlantic sediments has been observed, but the link between the two records is not well understood.
The changes in the sorting and mode size of dust during the Holocene, using the same interpretation as for the LGM/ Holocene changes, could be the result of differences in the atmospheric circulation efficiency affecting the duration of aeolian transport of dust. We thus believe that the increase of large particles relative to small ones reflects an easier penetration of air masses towards the interior of Antarctica and vice versa. Observed periodicities could be interpreted as the oscillation between a situation of more meridional transport and a situation of more zonal circulation in the South Atlantic. In other words, these fluctuations are likely representative of changes in the efficiency of the polar front as a meteorological barrier in the South Atlantic. They are therefore probably linked to sea-ice extent in the South Atlantic that in turn is a response to conditions of ocean and atmospheric circulation in the Southern Ocean.
Conclusions
The EPICA ice-core dust record has allowed documentation of changes in the concentration, flux and size distribution of insoluble particles transported to East Antarctica (Dome C) over the last 27000 years. Between the LGM and the Holocene, drastic changes in dust concentration were accompanied by significant differences in particle size. As an explanation, we suggest more zonal atmospheric circulation around Antarctica during the LGM and a more meridional pattern during the Holocene, allowing easier penetration of air masses.
The record shows a gradual decrease of the total concentration over the last 13 000 years, as well as a period with very low dust concentration near the end of the Younger Dryas. Significant millennial-scale fluctuations in the mode of particle size are observed, especially before 5000 years ago. Higher-frequency fluctuations are superimposed on this signal.
Holocene Antarctic records therefore reflect oscillations similar to those found in North Atlantic marine records. This suggests that millennial-scale variability of the Holocene climate is an interhemispheric phenomenon; however, further work will be required to determine whether or not this variability is caused by a common primary forcing.
Acknowledgements
This work is a contribution to the ``European Project for Ice Coring in Antarctica’’ (EPICA), a joint European Science Foundation/European Commission (EC) scientific programme, funded by the EC under the Environmental and Climate Programme (1994–98) contract ENV4-CT95-0074 and by national contributions from Belgium, Denmark, France, Germany, Italy, the Netherlands, Norway, Sweden, Switzerland and the United Kingdom. This is EPICA publication No. 32.