Introduction
Ethnic minorities in the UK still face substantial discrimination within the job market with poorer job opportunities, interrupted job histories and greater unemployment rates than the white majority (Barnes and Taylor, Reference Barnes and Taylor2006; Mawhinney, Reference Mawhinney2010). Ethnic minority groups are more likely to experience lower living standards in retirement due to a strong link between continuity and type of employment and ability to save for retirement (Ginn and Arber, Reference Ginn and Arber2001), therefore disadvantage in the labour market is likely to continue in retirement (Johnson, Reference Johnson and Lloyd-Sherlock2004; Barnes and Taylor, Reference Barnes and Taylor2006).
Employment rates and pay levels are variables that have an important effect on the receipt of sufficient pension benefits once in retirement. Individuals from ethnic minority groups, particularly of Pakistani and Bangladeshi origins, are, on average, less likely to be in employment, and more likely to be in low paid jobs and self-employment than the white majority (Berthoud, Reference Berthoud2000; Pensions Policy Institute, 2003; Dale and Lindley, Reference Dale and Lindley2006; Salway et al., Reference Salway, Platt, Chowbey, Harriss and Bayliss2007). There are also important gender and inter-group differences in relation to financial welfare, both in the labour market and after retirement.
Ethnic minorities constituted 5.4 per cent of older people (age sixty-five plus) in 2007 compared with 9.6 per cent of the total UK population (Lievesley, Reference Lievesley2010). There has been an increasing interest in the retirement behaviour of ethnic minorities from researchers and policy-makers (Burton, Reference Burton1996, Reference Burton1997; Gustman and Steinmeier, Reference Gustman and Steinmeier2004; The Pensions Commission, 2004). The high concentration of young people within ethnic minorities implies that they now may have time to save for retirement (Evandrou, Reference Evandrou2000); however, whether they will save adequately is conditional on a number of other variables, such as retirement planning, regular employment and income, amongst others.
Research indicates that 60 per cent of ethnic minorities between fifty and state pension age are economically inactive compared with 40 per cent of the white population (The Pensions Commission, 2004). This means that large proportions of ethnic minorities are more likely to miss out on full non-means-tested, basic state pension and, importantly, on occupational and state second pensions and become dependent on means-tested benefits.
Our study investigates the private saving behaviour of ethnic minority groups in the UK, with particular focus on saving for retirement. This is a particularly important question, especially as public funding of retirement is likely to be reduced in the coming years and policy-makers are encouraging the shift of responsibility for retirement income towards private savings rather than state benefits. The use of the Family Resources SurveyFootnote 1 allows us to work with an extensive sample and a wealth of demographic and financial information to be able to perform a comprehensive and updated study on ethnic minorities’ saving behaviours.
We examine the saving behaviour, with focus on saving for retirement, of ethnic minorities between 1994 and 2008, updating the analysis of Ginn and Arber (Reference Ginn and Arber2001) which focused on the mid 1990s. The analysis is performed for different age and gender groups to show possible variations within each ethnic group and to find whether some ethnic groups may be at greater risk of poverty than others after retirement. Retirement age has important implications; this decision often depends on health, financial and household circumstances, work satisfaction, but also availability of pension schemes and changes in the labour market (Hirsch, Reference Hirsch2003; Vickerstaff et al., Reference Vickerstaff, Baldock, Cox and Keen2004). Retirement income is equally multi-faceted, comprising of income from basic state pension or other state benefits, private pensions and assets such as returns on investments, among others. There is evidence of wide variations in the retirement incomes of ethnic minorities and also between men and women in these groups (Evandrou, Reference Evandrou2000).
We study saving for retirement and financial diversity among ethnic minorities and compare them with our control group, the white population. We show that differences also exist within ethnic groups, between genders and age cohorts. An important part of this study is the analysis of how different ethnic groups plan for retirement through private pensions and other financial assets. The study examines whether minority groups still experience disadvantage in the labour market and in terms of income levels and how this may affect their welfare in retirement. Our results show extensive heterogeneity in saving patterns between ethnic groups, but also depending on gender and age.
The article is structured as follows: Section 2 describes the significant factors that affect retirement planning, with particular reference to ethnic minorities. Section 3 illustrates the data on employment conditions and income levels of ethnic minorities. Section 4 shows the distribution of saving types and levels in the sample. Section 5 concludes.
Literature review
Ageing, immigration and government policies affect the welfare of the older population. Education and employment status correlate with earnings, incomes and assets in retirement. Over the years, the concept of retirement itself has arguably changed, in part due to the introduction of anti age-discrimination legislation that increases the right to continue working. Despite the many changes in pension policies over the last twenty years, poverty rates increase after retirement (Gough and Adami, Reference Gough and Adami2011) and are often influenced by ethnicity and gender. In this section, we examine the existing literature relating to factors that influence ethnic minorities’ retirement planning in an effort to explain the heterogeneity observed across groups.
Research on retirement and ethnic minorities has emerged from two broad perspectives: Berthoud (Reference Berthoud1998), Nesbitt and Neary (Reference Nesbitt and Neary2001), Warren and Britton (Reference Warren and Britton2003) and Gustman and Steinmeier (Reference Gustman and Steinmeier2004) focus on retirement income and economic conditions, while Platt and Noble (Reference Platt and Noble1999), Evanrdou (Reference Evandrou2000) and Ginn and Arber (Reference Ginn and Arber2001) concentrate on social inequalities.
Current literature shows that disadvantages in the labour market lead to greater financial difficulties in retirement. This seems particularly true for older ethnic populations, although there are clear variations in the incidence of poverty in retirement between ethnic groups (Modood et al., Reference Modood, Berthoud, Lakey, Nazroo, Smith, Virdee and Beishon1997; Ginn and Arber, Reference Ginn and Arber2001; Nesbitt and Neary, Reference Nesbitt and Neary2001). The link between low employment earnings, part-time work and early retirement and low pension incomes amid ethnic minorities has also been evidenced recently by Steventon and Sanchez (Reference Steventon and Sanchez2008).
Berthoud (Reference Berthoud1998) highlights the disadvantages faced in employment in the UK by those from ethnic minority backgrounds. In his study, Berthoud combines eleven years of Labour Force Survey data to analyse men's employment in terms of demographic and social factors and to show the variation in the economic positions of ethnic groups. His findings show that while Indian and Chinese men feature education and employment rates similar to the white majority, Black Caribbean, Black African, Pakistani and Bangladeshi men experience disadvantage in the work place. Berthoud also suggests that some ethnic groups, such as those of Caribbean origins, did not experience relevant improvements between first and second generation migrants to the UK.
Ginn and Arber (Reference Ginn and Arber2001) use data from the Family Resource Survey. They merge observations for three consecutive years to analyse a large sample of adults, aged between twenty and fifty-nine, including more than 5,700 respondents from ethnic minorities, in terms of employment and private pension coverage. They show that Pakistani and Bangladeshi women are at a significant disadvantage in terms of employment status, with many more women in these groups unemployed or with interrupted working histories. The difficulties experienced during their working lives contribute to the disadvantage that ethnic minorities experience in terms of participation in good value occupational pension schemes.
One of Ginn and Arber's most relevant findings is that ethnicity and gender are both important factors in explaining private pension coverage. The authors conclude that lower private pension coverage amongst ethnic minorities is strictly linked to lower participation in full-time employment, employee status, type of occupation and employment income.
The link between income and saving for retirement has been examined extensively in the existing literature, with many studies stemming from theories such as the life cycle hypothesis (Modigliani and Brumberg, Reference Modigliani, Brumberg and Kurihara1954) and the permanent income hypothesis (Friedman, Reference Friedman1957). However, empirical results are often inconclusive (Sherraden and Barr, Reference Sherraden, Barr, Retsinas and Belsky2005). Even though at subsistence levels the potential for saving for retirement is small (Masson et al., Reference Masson, Bayoumi and Samiei1998), theoretical models often fail to explain saving patterns in low-income individuals. A number of studies, mainly in the US, show that while low-income households may be saving for key life events such as births, marriages and illnesses, the lack of easy access to basic financial services is an important factor in preventing them from saving for retirement (see Dunham, Reference Dunham, Blanton, Williams and Rhine2001; Vermilyea and Wilcox, Reference Vermilyea and Wilcox2002; Aizcorbe et al., Reference Aizcorbe, Kennickell and Moore2003; Han and Sherraden, Reference Han and Sherraden2009).
In the UK, Banks and Tanner (Reference Banks and Tanner1999) as well as Attanasio and Rohwedder (Reference Attanasio and Rohwedder2001) emphasise that although income is a crucial factor in determining the levels of saving for old age, empirical evidence on its impact is not clear-cut. Many factors, besides disposable income, such as uncertainty of future income, expected future rates of return and tax incentives to save, changing conditions in the labour market, level of welfare provisions as well as liquidity constraints all render the link between income and saving behaviour very complex.
Cultural differences have also been cited as affecting retirement provisions and planning amongst some ethnic groups in the UK (Burton, Reference Burton1996; Nesbitt and Neary, Reference Nesbitt and Neary2001; Hoff and Sen, Reference Hoff and Sen2005). Burton (Reference Burton1996) observes that extended families constitute a source of financial support for Asians in their old age and that Asians prefer safer types of savings and endowments to making contributions towards pensions on grounds of flexibility. The author attributes these differences mainly to two factors: the Asian value system of emphasizing the collective group rather than the individual, and the Asians’ experience of direct or indirect discrimination in their dealings with financial service providers.
However, there is recent evidence that expectations on inter-generation support are changing. In their studies, Barnes and Taylor (Reference Barnes and Taylor2006) and Gough and Hicks (Reference Gough and Hicks2009) contend that although older generations of Asians expect their children to support and care for the elderly, these expectations have become less common amid younger generations.
Nesbitt and Neary's (Reference Nesbitt and Neary2001) study in the UK shows significant differences between white and Pakistani respondents with respect to retirement provisions. The authors contrast the white population's better grasp of different types of pensions compared to their Pakistani peers. They observe that the white group had low expectations of state pensions, value occupational pension scheme membership due to employers’ contributions and find personal pensions attractive due to the level of control offered. In contrast, Pakistani respondents regard state pension as a more reliable and preferred source of retirement income compared to private pensions. Young Pakistanis prefer to use their spare income to invest in a business rather than to contribute to a pension scheme, and therefore consider pension planning a low priority.
Employment status
Research on ethnic minorities has been hindered by the limited number of observations in many national datasets. We use data from the Family Resources Survey (FRS) between 1994 and 2008. The FRS is an annual, nation-wide survey, carried out by the Department for Work and Pensions (DWP). It includes financial and socio-demographic data for a large number of respondents resident in the UK. The sample size has increased over the years, from 25,000 households in 1997 to 44,734 in 2008, with a response rate fluctuating between 58 per cent in 2008 and 69 per cent in 1994.Footnote 2 The survey is designed to provide information about living standards of adults aged sixteen and above and the efficiency of the social security system in the UK. It employs a two-stage stratified random sample from the small users’ Postcode Address File (PAF).
We combine observations from 1994 to 2008 and obtain a sample where over 4 per cent is represented by ethnic minorities. The method of combining independent cross-sectional data has previously been used to obtain a larger sample, as individuals from ethnic minorities are reportedly less inclined than whites to respond to surveys (Modood et al., Reference Modood, Berthoud, Lakey, Nazroo, Smith, Virdee and Beishon1997).
We group the sample into three cohorts, ‘Young’ (those between sixteen and twenty-four years of age), ‘Prime’ (those between twenty-five and fifty-four years old) and ‘Older’ (those aged between fifty-five and sixty-five). Respondents are also classified in one of the following ethnic groups: Indian, Pakistani, Bangladeshi, Chinese, Black Caribbean, Black African, Any Other Asian and the White control group. Employment status is categorised as ‘full-time employment or self-employment’ and ‘part-time employment or self-employment’. All of those between the age of sixteen and sixty-five not within the classification above are considered not in employment
Our preliminary results on employment rates show how ethnicity and gender can still be a cause of disadvantage in the workplace. Amongst ethnic minorities, there are greater proportions of those in part-time work and not in employment than in the control group. Employment status is likely to affect the ability to save for retirement and achieve adequate pension benefits (Ginn and Arber, Reference Ginn and Arber2001).
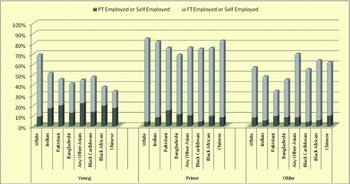
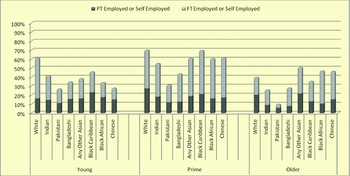
Figures 1 and 2 show the percentages of those in full-time and part-time employment/self employment by age and ethnic groups, for men and women respectively (FRS years 1993/4 to 2007/8).
Employment status by ethnicity and age group, men
Note: The young group includes those aged 16 to 24; the prime group consists of respondents aged 25 to 54; the older group includes respondents aged 55 to 65.
Source: Family Resources Survey, 1994–2008.

Employment status by ethnicity and age group, women
Note: The young group includes those aged 16 to 24; the prime group consists of respondents aged 25 to 54; the older group includes respondents aged 55 to 65.
Source: Family Resources Survey, 1994–2008.

White men show the highest percentages of those in full-time employment, especially in the Young and Prime age cohorts (60 per cent and over 80 per cent respectively). Amongst ethnic groups there is high heterogeneity, some feature similar patterns to the control group, particularly in the Prime age cohort, for example Chinese and Indian men, while Pakistani and Bangladeshi men show consistently higher proportions out of work across all age groups. Men's part-time employment is also far more common amongst ethnic minorities than within the control group; over 20 per cent of Pakistani, Any Other Asians and Black Africans in the ‘Young’ age group are in part-time employment. As expected, the control group shows higher percentages of those in full-time employment across all age cohorts except after the age of fifty-five, when the percentage of white men in full-time work declines considerably, down to 48 per cent. This contrasts with the employment status of respondents from ethnic groups, whereby Chinese, Black African and Any Other Asian men show higher proportions of those in full-time work amongst the ‘Older’ groupFootnote 3 than White men.
The data raise two crucial issues: firstly, greater proportions of white and, to a lesser extent, Indian and Chinese men are in full-time employment at young and prime age. This enables them to contribute to occupational pensions or other saving schemes, and, as a result, they are more likely to accumulate adequate pension rights. Secondly, there is evidence that, in percentage terms, more men in the control group than in any other ethnic group exit the workforce in the ‘Older’ age group, between fifty-five and sixty-four. A possible explanation is that White men are more likely to reach adequate pension entitlements before their peers from ethnic minorities, owing to higher percentages in full-time employment in earlier years.
The data for women also show considerable variation amongst ethnic groups. Full-time employment rates are consistently lower than men's, with many more women than men working part-time. Part-time employment is widespread amid women of all ethnicities and ages, including those belonging to the white control group. However, we find that part-time employment increases considerably for women in their Prime age, more so amongst white women, possibly because many take part-time work while in their thirties to look after their children. Women of Pakistani and Bangladeshi origin show much lower employment rates than other ethnic groups across all age cohorts. Percentages of Pakistani and Bangladeshi women in full-time employment are particularly low across all age groups, less than 20 per cent and 35 per cent respectively in their Prime age. Female overall employment rates increase with age for all ethnic groups, up to the ‘Prime’ age group, after which many women exit the workforce, especially those from the control group. Our data show high levels of female part-time work, which crucially means that women are far less likely than men to have constant and uninterrupted access to saving for retirement and occupational, personal pension schemes. This is not only because of lower overall pay in part-time jobs, but because they often have worse terms and conditions of employment. Broken work histories are still quite common amongst women. Our results show unambiguously that work participation amid Pakistani and Bangladeshi women is still low both in absolute terms and in comparison to other ethnicities. These findings are in agreement with those of Ginn and Arber (Reference Ginn and Arber2001) who also find significantly lower work participation by Pakistani and Bangladeshi women.
Income and saving
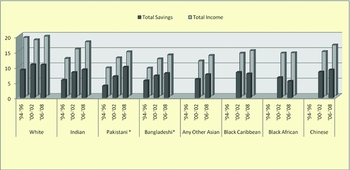
In this section we examine data on income levels to determine whether there are significant income differences between ethnic groups and how these may contribute to affect their saving patterns. Figure 3 shows individual income adjusted by family size and inflation. Income and saving amounts have been adjusted for the Consumer Price Index and are in 2008 GBP (Eurostat, 2010). The graph shows how values change over the timeframe examined; amounts are three-year averages for 1994 to 1996, 2000 to 2002 and 2006 to 2008. Data for some ethnic groups are only available from 2000.
Income and saving levels (in thousands of GBP) by ethnic groups and time
Note: *Low number of observations.
Source: Family Resources Survey, 1994–2008.

The data suggest that income differences between ethnic groups and the control group have reduced over time; however, some ethnic minorities (namely Pakistani, Bangladeshi and Other Asians) consistently experience an unequivocal disadvantage in terms of income throughout the timeframe examined. An important feature of the data is that those of Indian and Chinese background have experienced, on average, steady but considerable improvements in their income. This is consistent with our previous findings on employment status as it indicates that differences between the control group and those of Indian and Chinese origins in terms of employment and income have been diminishing and that perhaps possible existing disadvantages in the workplace are being somewhat overcome by these groups.
Pakistanis and Bangladeshis remain at greater risk of poverty, also owing to significantly larger household sizes than other groups. Although the number of observations for these two groups is very low and caution should be exercised when interpreting the data, this result is in agreement with a study carried out by Bradshaw et al. (Reference Bradshaw, Finch, Mayhew, Ritakallio and Skinner2006), which showed that family size and ethnic background are important factors in determining the risk of poverty.
Saving levels for all ethnic minorities remain below those of the control group; however they tend to increase over time with income, with the exception of Black Caribbean and Black African respondents, who see their saving levels decrease, although by small amounts, between 2000 and 2008, despite small improvements in their incomes.
Our data indicate that lower saving levels across ethnic minorities are by and large associated with lower income levels compared to the control group. Yet an important factor affecting saving behaviour, especially saving for retirement, is represented by the ease of access to financial services (see Han and Sherraden, Reference Han and Sherraden2009). Our sample shows that the majority of ethnic groups examined have experienced increasing saving levels over the years 1994 to 2008.
Saving behaviour
In this section, we present the results on saving patterns of ethnic minority groups and of the white population. The analysis is carried out by classifying the sample according to gender and age groups. We show how saving behaviour has changed between 1994 and 2008. All saving amounts have been adjusted for the Consumer Price Index (CPI) and are in 2008 GBP (Eurostat, 2010). Savings are categorised in four groups: basic accounts,Footnote 4 national savings,Footnote 5 saving for retirementFootnote 6 and investments.Footnote 7 Values represent three-year averages within the timeframe examined. Only individuals with at least one type of savings in any given year, beside current accounts, have been considered here, these constitute 25.3 per cent of the overall sample. Respondents who hold only basic accounts and no other type of savings have been excluded from the sample.
There is significant variation in the proportions of savers across ethnic groups. The groups with the highest percentages of savers are White and Chinese men (between 24 and 29 per cent for all age groups except the youngest cohort), while Bangladeshi, Black Africans and, to a lesser extent, Pakistani men, exhibit the lowest proportions of savers (below 18 per cent across all age cohorts). Data on women show similar patterns, with less than 19 per cent of Pakistani, Bangladeshi and Black Africans holding any type of savings at any age, while 26 to 28 per cent of White and Chinese women save across most age groups, except the youngest.
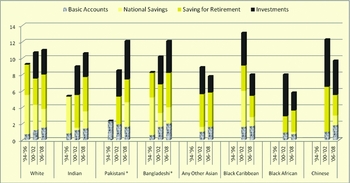
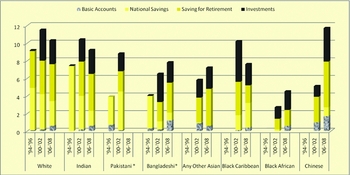
Figures 4 and 5 show saving types and amounts (in thousands of GBP) over time, for men and women of different ethnicities. For many groups data on saving is only available from 2000 onwards.
Saving types by ethnic groups (in thousands of GBP), men
Note: *Low number of observations.
Source: Family Resources Survey, 1994–2008.

Saving types by ethnic groups (in thousands of GBP), women
Note: *Low number of observations.
Source: Family Resources Survey, 1994–2008.

Savings levels are generally low but there is evidence that some groups save significantly less than others, for example Black Caribbean, Black African and Any Other Asian. These results are confirmed by a recent study on ethnic minorities, which shows that, in the UK, more than 60 per cent of Asian and Black people have no savings at all, and those who do have savings and investments hold lower amounts and less diversified financial products than the white majority (Khan, Reference Khan2010).
The amounts held in basic accounts are consistently small across time and ethnic groups. National Saving accounts are very popular among Asian men, possibly due to the greater perceived safety of these products. These findings confirm previous results from Gough and Hicks (Reference Gough and Hicks2009), who show that the use of alternative mechanisms for retirement saving, such as mutual savings or investments in property and businesses, are more likely to be incorporated in financial planning by Asian communities than by other ethnic groups.
In the years leading up to 2008, National Savings decrease in favour of new saving types specifically designed to provide additional retirement income or perceived to offer higher return, such as bond and stock investments. Saving for retirement still constitutes a small part of overall saving for most groups and does not grow significantly over time. Saving levels are low across all groups but some ethnic groups save significantly less than others, for example Black African and Any Other Asian.
It is interesting that in recent years Chinese men focused predominately on investments and saving for retirement rather than National Savings as for most other ethnic groups. Possible explanations of the changes towards saving for retirement which occurred within some groups over time can be found in the increased awareness of the need to save for life after work and the changes in the composition of ethnic groups in terms of age and education. The considerable increase in the levels of investments between 1996 and 2000 coincides with the growth in popularity of funds managed by financial institutions, which took place in the UK in the late 1990s. This is supported by a recently published report of the Office for National Statistics (2012) which shows that investment vehicles that allow individuals to invest in diversified portfolios have seen an expansion in value of more than 300 per cent between 1998 and 2008.
Figure 5 illustrates saving types and levels across time for women of different ethnicities. Data for Any Other Asian, Black Caribbean, Black African and Chinese respondents is not available until 2000 and the number of observations for some Asian groups, such as Pakistani and Bangladeshi women, is extremely low. Figure 5 shows some relevant information on the amounts saved by women and evidence that gender, as well as ethnicity, plays an important role in determining which groups are the most financially disadvantaged. Women from all ethnicities, including the control group, save less than men but there is variation amongst saving behaviour of different groups. On average, most ethnic minorities save considerably less than the control group. This may be evidence of the higher proportion of women from ethnic minorities in low-paid, part-time jobs or unemployed.
National Savings are predominant among women of Asian origins (especially Indian and Bangladeshi), which points to a cultural preference for these safer and uncomplicated saving vehicles. Saving for retirement is somewhat low across all ethnicities, including the control group and does not increase in any significant way over time, with the only exceptions being Chinese and Indian women who, however, start from very low levels. These findings indicate that Pakistani and Bangladeshi as well as Black African women are likely to be highly dependent on means-tested benefits once in retirement and mean that there has been little improvement since Ginn and Arber's study published in 2001, which found similar results.
Saving levels are highly correlated to income levels and to the propensity to save, which is often influenced by cultural factors. An interesting feature of our data is a distinctive pattern of some Asian groups (predominantly Indian and Pakistani) to save into what are perceived to be safer products, such as National Savings, rather than in financial markets. Furthermore, different levels of financial literacy exist amongst different groups, including the white majority, which can be explained also by social class and education. Among ethnic minorities, cultural barriers as well as greater reliance on inter-generational support can further explain some of the differences in saving patterns.
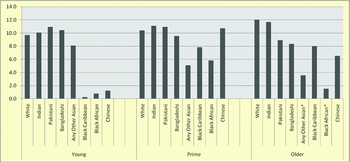
Figure 6 shows further details on total saving by examining their distribution across age cohorts and ethnicity. As expected, most ethnic groups, including the control group show higher total saving levels amongst those belonging to the ‘Prime’ and ‘Older’ age cohorts. Respondents of Indian origin present saving levels comparable to those of the control group across all age groups, whereas the other ethnic minorities have lower saving levels in the ‘Older’ age group.Footnote 8 The data show that although young Chinese, Black Caribbean and Black Africans save extremely low amounts, Chinese respondents in the Prime age save, on average, more than the control group. Black Caribbean, Black Africans and Any Other Asians save consistently low amounts across all age groups.
Total savings by age and ethnic groups (in thousands of GBP)
Notes: The young group includes those aged 16 to 24; the prime group consists of respondents aged 25 to 54; the older group includes respondents aged 55 to 65.
*Low number of observations.
Source: Family Resources Survey, 1994–2008.

This section confirms the great variation of saving patterns that exists amongst ethnic minorities, however the data also show some key features: Blacks show exceptionally low savings across all age groups. Chinese respondents feature low levels of saving amongst the young and the older groups, while saving levels for those in the prime age are notably higher. Generational differences may also play an important role here. Older generations are likely to have come from disadvantaged backgrounds and made relatively little economic gains throughout their life in the UK. It is plausible that younger generations experienced gains in earnings and saving rates once in their thirties and forties, owing to improvements in education and job prospects. The disadvantage in saving rates experienced by the youngest groups of Blacks and Chinese can also be explained, to some extent, by lower inheritance and family transfers than whites and non-Chinese Asians. The saving behaviour of Indian respondents across age cohorts is the one that is most similar to that of the control group.
Low levels of savings during working life combined with fewer contributions to basic state pensions affect retirement incomes. The low numbers of savers along with poor saving levels among many ethnic groups are likely to leave them at a greater risk of poverty in retirement.
Conclusions
In this study, we examine the literature on saving and planning for retirement of ethnic minorities. We use data from the Family Resources Survey between 1994 and 2008 to analyse employment status and income levels of ethnic minorities in the UK and explore their effect on saving patterns as well as age and gender differences.
Our findings show that there is significant variation within ethnic minority groups in terms of employment status and income, with Pakistani and Bangladeshi consistently showing the highest unemployment rates and lower incomes. Women's employment conditions tend to be worse across all groups with high rates among those in part-time employment or out of work, while Pakistani and Bangladeshi women feature particularly low full-time employment rates at any age.
We find that income levels of ethnic minorities are consistently lower than those of the control group over the timeframe examined. Low incomes and financial hardship throughout the working life affect Pakistani, Bangladeshi and Black minorities more severely and in greater numbers than other ethnic groups such as the Chinese and Indian. This is also reflected very clearly in the saving patterns.
Gender is also an important factor in determining saving behaviour. Only a small percentage of Asian respondents have savings of any kind and, for those who do, the saving levels are low, especially amongst women. There are important differences in the saving patterns within different groups: Indian and Chinese men, save in line with the control group, while Pakistani, Bangladeshi and Black women save consistently less across all the sub-periods examined. This finding further confirms the strong relation between disadvantage in the labour market, lower income and lower lifetime savings that some ethnic minorities are still likely to experience.
With regard to the types of savings, our findings suggest that those of Indian, Pakistani and Bangladeshi origins, especially women, choose to save mostly in National Saving schemes, possibly because they are perceived as simpler and safer compared to investments in the financial markets.
As expected, saving levels are higher for those in the ‘Prime’ age group; however, we find that Black Caribbean and Black African respondents save less than the other groups across all age cohorts. The lack of substantial savings amongst these groups can be linked to generally low-income levels and precarious employment patterns.
We add to the debate on saving for retirement by examining the saving behaviour of ethnic minorities. Our results have important implications in terms of private saving policies. They indicate a worryingly small number of savers among ethnic minorities and very low levels of retirement savings for most ethnic groups, especially for Pakistani and Bangladeshi women. Personal saving schemes and tax advantages put in place by successive governments to promote private saving for retirement have had a limited effect amongst ethnic minorities, while saving behaviours seem to be greatly affected by employment patterns and financial welfare during the working life. We find that at a time when policy makers highlight the importance of private saving and personal responsibility for the provision of retirement income, some ethnic minorities are still at a greater risk of poverty in old age than other groups. We show that over a decade after Ginn and Arber's (Reference Ginn and Arber2001) study, ethnicity and gender are still important determinants of the disadvantage experienced by some in terms of adequacy of saving for retirement.