Introduction
Fish embryo freezing has yet to be entirely successful. This situation is due to several factors including embryo size, the complex system of compartments, permeability between membranes and high sensitivity to cold temperatures (Hagedorn et al., Reference Hagedorn, Hsu, Kleinhans and Wildt1997, Reference Hagedorn, Kleinhans, Artemov and Pilatus1998). As such, studies have applied the chilling technique (temperatures close to freezing point) as an alternative in order to observe the damage caused to embryos when exposed to the cold (Ahammad et al., Reference Ahammad, Bhattachayya and Jana1998, Reference Ahammad, Bhattacharyya and Jana2003; Liu et al., Reference Liu, Zhang and Rawson2001; Zhang et al., Reference Zhang, Liu and Rawson2003). It is generally essential to use cryoprotectant agents to maintain cells at low temperatures because they inhibit the growth of ice crystals, which are considered lethal to the cells (Polge et al., Reference Polge, Smith and Parkes1949; Leibo, Reference Leibo, Tiersch and Mazik2000). On the other hand, although cryoprotectants are necessary, their toxicity may cause cell mortality (Chao & Liao, Reference Chao and Liao2001).
Cell dehydration during the chilling process depends directly on the speed of temperature decline. However, chilling curves vary in accordance with different types of cells and the following characteristics should be taken into account: amount of intracellular water; cell size; permeability of the membrane for water influx and efflux; and temperature coefficient (Hagedorn et al., Reference Hagedorn, Hsu, Kleinhans and Wildt1997).
There are two methods of cryopreservation, namely slow or rapid chilling curves. In the first method (slow), cells are chilled under a gradually declining temperature in the presence of cryoprotectants, resulting in greater extracellular osmolarity and faster cell dehydration (Mazur, Reference Mazur1984). The second method is a rapid chilling process known as vitrification, which requires fast exposure of cells to a highly concentrated cryoprotectant solution, which becomes more toxic as a result of exposure time (Fahy et al., Reference Fahy, Mac Farlane, Angell and Meryman1984).
According to Mazur (Reference Mazur1977), when submitting cells that contain cryoprotectants to temperatures around −5°C, both the cells and the surrounding environment lower the solidification point of the solution, an effect that is attributed to the presence of the cryoprotectant solution. The same author also states that when the temperature is maintained between −5 and −15°C, extracellular ice formation usually occurs and cells remain defrosted but super-chilled, probably because the plasma membrane prevents the growth of ice crystals near the extracellular environment.
Research conducted on embryo freezing and chilling techniques in Brazil is recent (Ninhaus-Silveira et al., Reference Ninhaus-Silveira, Foresti and Azevedo2006; Streit Jr. et al., Reference Streit, Digmayer, Ribeiro, Sirol, Moraes and Galo2007) and related to knowledge of the toxic potential of cryoprotectants in native species. P. mesopotamicus has been adopted as a model South-American species (Streit, Reference Streit2005; Streit et al., Reference Streit, Digmayer, Ribeiro, Sirol, Moraes and Galo2007; Neves, Reference Neves2008; Fornari, Reference Fornari2009), in which combinations of intra- and extracellular cryoprotectants and different embryonic stages have been studied for chilling at −8°C and freezing. Thus, the objective of this study was to assess the effect of different chilling curves on the storage of P. mesopotamicus embryos at −8°C.
Material and methods
Embryo collection
Six breeding pairs of P. mesopotamicus from the Hydrology and Aquaculture Station of DUKE Energy Brazil in Salto Grande, SP, Brazil were used for embryo collection. Brood fishes were, on average, 4 years old and were kept in earthen ponds at a stocking density of 0.7 kg fish/m2. External characteristics of the animals were observed to determine the level of gonad maturation for selection of specimens to be induced (Teodoro & Ferraz de Lima, Reference Teodoro and Ferraz De Lima1986). Hormonal therapy used was 5.5 mg.kg−1 of crude carp pituitary extract in two doses (0.5 and 5.0 mg.kg−1), with an interval of 12 h for females, and 1.0 mg.kg−1 (single dose) for males (intramuscularly). Gamete release (stripping) occurred at 5°C, followed by fertilization. An egg pool was then taken to 7 L hatcheries with continuous water flow and a temperature of 27 ± 1°C.
Chilling curves
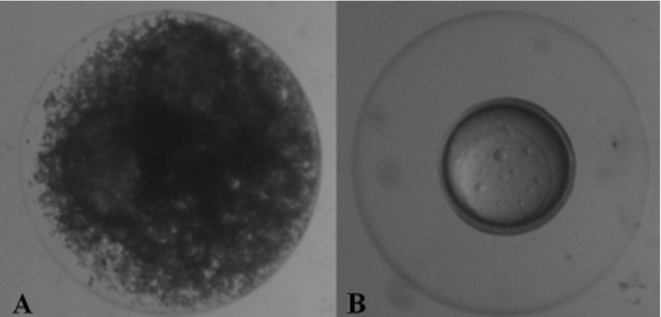
A solution of 10% methanol and 0.5 M sucrose was used to submit embryos to chilling curves, as recommended by Streit Jr et al. (Reference Streit, Digmayer, Ribeiro, Sirol, Moraes and Galo2007). Viable eggs (those displaying normal embryonic development) were selected at blastopore closure (8 h after fertilization), excluding addled eggs (Fig. 1A,B).
(A) Addled eggs were discarded. (B) Viable eggs (embryos at the stage of closure of the blastopores) (stereomicroscope magnification × 40).

The first group (G1) consisted of 1800 embryos exposed to cryoprotectant solution at room temperature (27°C ± 2). Three samples of 600 embryos each were distributed into three chilling curves declining to a temperature of −5°C, and subsequently to the established temperature of −8°C for 6 h (Streit Jr. et al., Reference Streit, Digmayer, Ribeiro, Sirol, Moraes and Galo2007). The following chilling curves were tested: T1: taken from room temperature directly to the refrigerator; T2: 0.5°C/min curve; and T3: 1°C/min curve. Following temperature reduction, embryos were taken to −8 ± 2°C for 6 h.
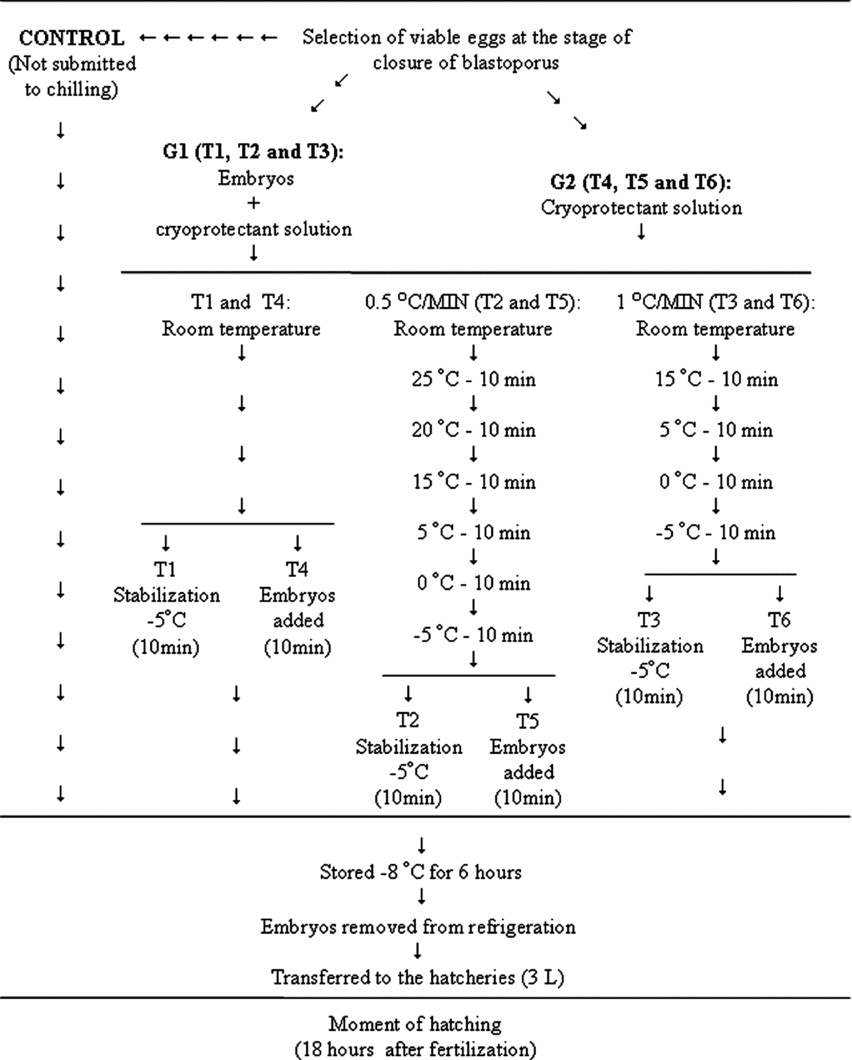
The second group (G2) also contained 1800 embryos. However, only the cryoprotectant solution was submitted to one of the three different chilling curves descending to −5°C, at which time the embryos were added to the solution and then placed in the refrigerator (−8°C). The following treatments were used: T4: cryoprotectant solution taken directly from room temperature to −5°C; T5: 0.5°C/min curve; and T6: 1°C/min curve, decreasing to −5°C (Fig. 2). In order to estimate natural hatching rates, a sample of 600 selected viable embryos was used, subdivided into six replicates of 100 embryos each, without undergoing chilling.
Fluxogram of the chilling of Piaractus mesopotamicus embryos exposed to cryoprotectant solution submitted to different chilling curves (G1), and the cryoprotectant solution submitted to different curves, receiving the embryos (G2) at −5°C.
Six coolers that contained ice were used to control temperature reduction during chilling. Each cooler was kept at a constant temperature (20, 15, 10, 5, 0 and −5°C, respectively) and monitored with thermometers to enable embryos to be transferred according to the time proposed in each curve (Fig. 2).
At the end of the storage period, each replicate of 100 embryos was removed from the refrigerator and transferred to a 3 L hatchery (continuous water flow) where they remained until hatching, 18 h after fertilization.
Embryo viability
The development of embryos submitted to chilling was assessed after hatching, by means of a total larvae (TL) count. These larvae were subdivided into: swimming (SL), dead (DL), or unhatched (UL), as well as addled eggs (AE) in each experimental unit.
Statistical analysis
Data were analyzed using a completely randomized design, with each treatment replicated six times. Two-way analysis of variance (ANOVA) and Tukey's test were used to compare mean values, with a significance level of 5%.
Results
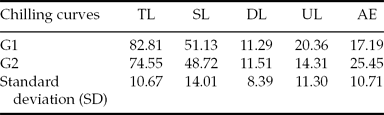
When the percentage of total larvae in groups G1 and G2 was compared, no difference (P > 0.05) was recorded between embryos submitted to chilling in cryoprotectant solution from room temperature and those added to the cryoprotectant solution after temperature decreased (Table 1). It is important to note that the total number of hatched larvae for embryos that did not undergo chilling was 94.3 ± 8.05%.
Percentage of total larvae (TL), swimming (SL), dead (DL) and unhatched larvae (UL), and addled eggs (AE) for the two groups G1 and G2

G1: embryos cooled from room temperature in cryoprotectant solution.
G2: cooled cryoprotectant solution with posterior addition of Piaractus mesopotamicus embryos, stored at −8°C for 6 h.
Original data and statistical analysis were transformed by arcsine (root(×/100)).
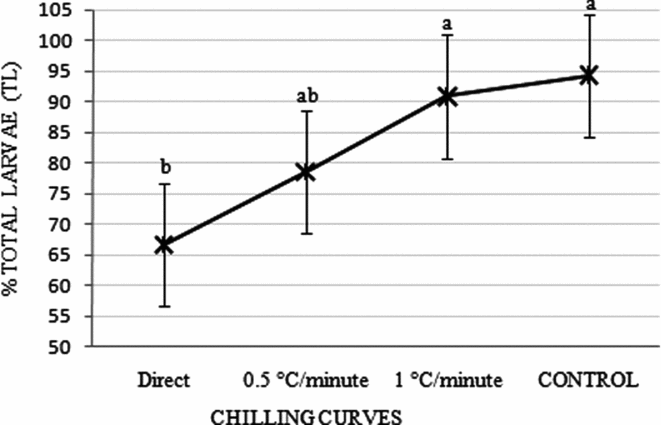
When total larvae percentages for treatments were added according to curves used in groups G1 and G2, T1 + T4; T2 + T5 and T3 + T6, embryos submitted to gradual temperature reductions of 0.5 or 1°C/min did not differ (P > 0.05) from values obtained in the control treatment (Fig. 3).
Percentage of total larvae obtained from the sum of the chilling curves for both groups (G1 – embryos chilled inside the cryoprotectant solution; and G2 – only the cryoprotectant solution was chilled) observed in Piaractus mesopotamicus embryos stored for 6 h at −8°C. Mean values followed by the same letters are not statistically different according to the Tukey's test (P > 0.05). Original data and statistical analysis were transformed by arcsine (root(×/100)).
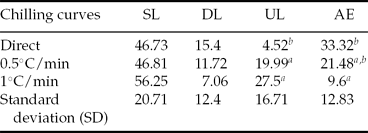
Although SL and DL did not differ for the sum of the treatments where a gradual decrease of 0.5 and 1°C/min was used (T2 and T5; T3 and T6, respectively), UL was higher (P < 0.05) for the sum of T1 and T4. However, in relation to AE percentage, the sum of T3 and T6 did not differ from T2 and T5 (P > 0.05), but was lower (P < 0.05) than the added mean values of T1 and T4 (Table 2).
Mean percentage of swimming (SL), dead (DL), and unhatched larvae (UL); and addled eggs (AE) of Piaractus mesopotamicus stored at −8°C for 6 h, after submitting embryos to different chilling curves
a,bMean values followed by the same letters within a column are not statistically different according to the Tukey's test (P > 0.05).
Original data and statistical analysis were transformed by arcsine (root(×/100)).
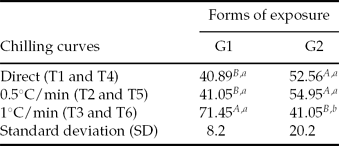
In separate analysis of the mean percentage of swimming larvae, T3 (for which embryos were placed in cryoprotectant solution and temperature was then reduced −5°C at 1°C/min) exhibited a higher percentage (P < 0.05) when compared with other treatments, both in G1 and T6 (G2). With the exception of T3, the total number of hatched larvae was similar in all other treatments, particularly T4 and T5 (G2), and higher (P < 0.05) than in T1 and T2 (G1), respectively (Table 3).
Percentage of SL (swimming larvae) for Piaractus mesopotamicus embryos stored at −8°C for 6 h, in different forms of exposure to cryoprotectant solution
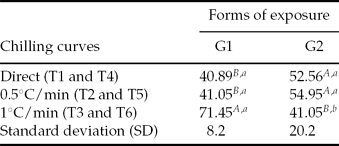
a ,b,A,B Mean values followed by the same capital letters within the columns and lower case letters within lines do not differ statistically according to Tukey's test (P < 0.05).
G1: embryos in cryoprotectant solution cooling from room temperature to −5°C in three chilling curves (T1, T2 and T3).
G2: chilling of cryoprotectant solution in three chilling curves (T4, T5 and T6) and posterior addition of embryos at −5°C.
Original data and statistical analysis were transformed by arcsine (root(×/100))
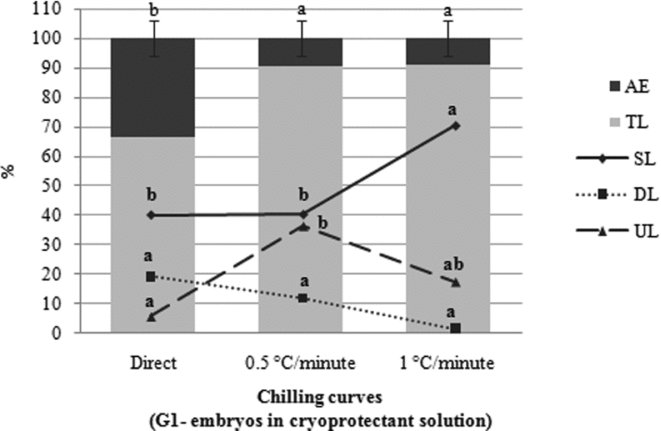
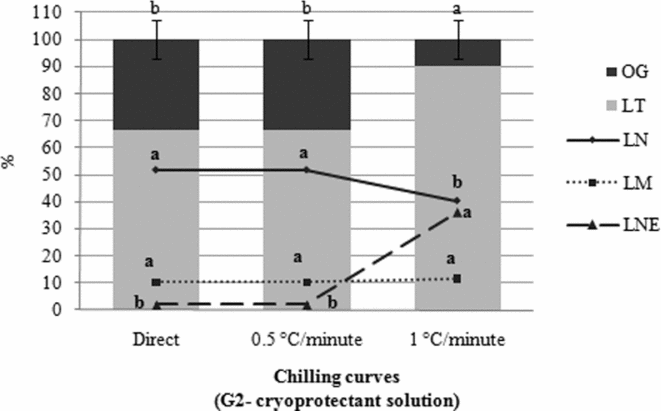
The effect of the curves within each group, G1 (Fig. 4) and G2 (Fig. 5), on the number of total larvae differed significantly (P < 0.05) according to chilling speed. TL percentage in G1 after embryos were submitted to the curves of 0.5°C/min (T2) and 1°C/min (T3) was statistically higher (P < 0.05) when compared with embryos taken from room temperature directly to −5°C (T1). However, only embryos subjected to T3 showed a greater percentage of swimming larvae (P < 0.05), in comparison with other treatments. There was no difference (P > 0.05) between the three treatments (T1, T2 and T3) in regard to the percentage of dead larvae. With respect to unhatched larvae, a difference was recorded (P > 0.05) for treatments T1 and T2 (Fig. 4).
Effect of the chilling curves in group G1 with regard to the percentage of addled eggs (AE); total larvae (TL); swimming larvae (SL); dead larvae (DL) and unhatched larvae (UL) of Piaractus mesopotamicus stored at −8°C for 6 h. Mean values followed by the same letter are not statistically different according to the Tukey's test (P < 0.05). Original data and statistical analysis were transformed by arcsine (root(×/100)).
Effect of the chilling curves in group G2 with regard to the percentage of addled eggs (AE); total larvae (TL); swimming larvae (SL); dead larvae (DL); and unhatched larvae (UL) of Piaractus mesopotamicus stored at −8°C for 6 h. Mean values followed by the same letters within a column are not statistically different according to the Tukey's test (P < 0.05). Original data and statistical analysis transformed by arcsine (root(×/100)).
When hatching rates of embryos placed into cryoprotectant solution after chilling in three different protocols (G2) were compared, a higher percentage of TL (P < 0.05) was observed in T6 (1°C/min) than in the other curves. However, the amount of normal larvae in T6 was lower than in treatments T4 and T5 (P < 0.05). On the other hand, the percentage of unhatched larvae was significantly higher (P < 0.05) in T6. The percentage of dead larvae did not vary among these three curves (P > 0.05) (Fig. 5).
Discussion
Initially, when analyzing results for the protocols tested, we were unable to identify a difference between the responses of embryos in G1, submitted to different chilling curves from room temperature, and those in G2, added to the cryoprotectant solution only at −5°C. However, as treatments within the two groups (T1, T2 and T3 in G1 and T4, T5 and T6 in G2) were analyzed, the performance of embryos in relation to each treatment was evident.
Based on the percentage of swimming larvae (SL) and unhatched larvae (UL) in G1, and between T3 and T6 (1°C/min curve), we determined that protocol T3 exhibited the best combination when compared with the other treatments.
Chilling protocols are used in an attempt to completely remove intracellular water by gradually lowering the temperature decrease so as not to create ice crystals, which are lethal to cells (Hagedorn et al., Reference Hagedorn, Peterson, Mazur and Kleinhans2004). The authors showed that the temperature of extracellular ice formation depended on the cryoprotectant solution used, but was typically between −5 and −15°C. Furthermore, the presence or absence of embryos in the solution did not change the environmental temperature at the moment of ice formation. In the present study, addition of P. mesopotamicus embryos at room temperature and gradually reducing the temperature of the solution (1°C/min − T3) was decisive for a good larvae survival rate. SL percentage in T3 was over 30% in relation to T6, where only the solution was cooled from room temperature in a curve of 1°C/min with posterior addition of the embryos at −5°C.
According to observations by Morris & Watson (Reference Morris and Watson1984), cell damage caused by chilling can be divided into two categories: (a) direct, where cold shock occurs as a result of abrupt chilling, and (b) indirect, occurring when embryos are exposed to low temperatures, usually for long periods. This suggests that the ideal scenario would be a moderate chilling curve, that is, neither slow nor fast. This concept is reinforced by the results of SL (over 30%) obtained when P. mesopotamicus embryos were cooled in T3 (1°C/min), in comparison with treatments T1 (direct) and T2 (0.5°C/min), curves of faster and slower chilling, respectively.
In T3, the association of methanol with sucrose may have resulted in different behavior from other treatments as 1°C/min chilling occurred, creating a more suitable environment for the P. mesopotamicus embryos and contributing to a certain extent to the efficiency of this chilling protocol. The chilling method using methanol as a cryoprotector used for P. mesopotamicus embryos was proposed by Streit Jr et al. (Reference Streit, Digmayer, Ribeiro, Sirol, Moraes and Galo2007), and corroborates results obtained by Zhang et al. (Reference Zhang, Liu and Rawson2003) when studying D. rerio embryos. Despite not clarifying the mechanism of protection provided by methanol for Danio rerio embryos, these authors reported that positive results were due to common characteristics among short-chain alcohols, such as the ability to lower the phase transition temperature of the lipid membrane. This finding corroborates the observation made by Liu et al. (Reference Liu, Zhang and Rawson2001) concerning the origin of direct or indirect chilling-related injury: that it may be related to phase transition of the lipid membrane, microtubule depolymerization, cell division difficulties and protein denaturation.
Regardless of the combination between chilling curves exhibiting the best results (T1, T2, T3, T4, T5 and T6) and the method of embryo exposure (G1 and G2) as assessed in this study, total larvae percentage may vary according to the species tested. Thus, results obtained with P. mesopotamicus embryos differ with regard to resistance to chilling when compared to other species. For example, Danio rerio embryos studied by Lahnsteiner at different stages (Reference Lahnsteiner2009) showed no differences between the slow chilling curve (0.35°C/min) and direct chilling at the end of embryonic development. Research has shown that these differences may be related to the type of cryoprotectant used (PPS – physiologic saline solution (125 mmol/L NaCl, 2 mmol/L KCl, 1 mmol/L CaCl2, 1 mmol/L MgSO4, 100 mmol/L tris). Zang et al. (Reference Zhang, Liu and Rawson2003) used methanol in three chilling curves (1, 30 and 300°C/min) with Danio rerio at different embryonic stages, recording high embryo survival rates for all three curves at any stage studied.
In conclusion, P. mesopotamicus embryos that are chilled must be stored in cryoprotectant solution at room temperature, with a chilling speed of 1°C/min.
Acknowledgements
This study was developed with the support of the CNPq (136522/2009-2), the research group from PEIXEGEN/State University of Maringá and Aquam/Federal University of Rio Grande do Sul, Hydrology and Aquaculture Station/DUKE Energy Brazil, and the Luiz Meneguel Agronomy College/State University of North Paraná.