INTRODUCTION
Global patterns of ungulate distribution show that in the Americas the diversity of this group is low in comparison with other continents (Wilson & Reeder Reference WILSON and REEDER2005). In fact, the African savanna biome supports the highest diversity of ungulate species in the world (du Toit & Cumming Reference DU TOIT and CUMMING1999). For example, while in Africa there are at least 99 large herbivore species (>2 kg), only 25 species exist in North America (Olff et al. Reference OLFF, RITCHIE and PRINS2002). In contrast, tropical forests support lower ungulate biomasses than savannas because most of the primary production in tropical forests occurs in the canopy, well out of the reach of terrestrial herbivores (Bodmer Reference BODMER1989). This difference between savannas and neotropical forests results, in part, from the extinction of many ungulate species in the Americas since the last glaciations. In the Miocene (24–5 Mya), the diversity of browser and grazer fauna in North (Janis et al. Reference JANIS, DAMUTH and THEODOR2000) and South America (MacFadden Reference MACFADDEN2006) was comparable to that of Africa (McNaughton et al. Reference McNAUGHTON, SALA, OESTERHELD and Goldblatt1993). However, the extinctions of large herbivorous mammals during the Pleistocene and Holocene significantly reduced the diversity of ungulates in the Americas (Arroyo-Cabrales et al. Reference ARROYO-CABRALES, POLACO and JOHNSON2007, Cannon Reference CANNON2004, de Vivo & Carmignotto Reference DE VIVO and CARMIGNOTTO2004), while in Africa the large-herbivore communities remain relatively intact (Fritz & Duncan Reference FRITZ and DUNCAN1994).
Extensive studies of African savannas ecosystems have shown that species diversity and composition, standing biomass and population densities of large herbivores are all strongly influenced by rainfall and soil nutrient contents (Coe et al. Reference COE, CUMMING and PHILLIPSON1976, East Reference EAST1984, Ogutu & Owen-Smith Reference OGUTU and OWEN-SMITH2003, Olff et al. Reference OLFF, RITCHIE and PRINS2002), as well as other factors such as fire, spatial heterogeneity, presence or absence of megaherbivores and large predators, and management of grazing areas (du Toit & Cumming Reference DU TOIT and CUMMING1999, Fritz et al. Reference FRITZ, DUNCAN, GORDON and ILLIUS2002, Klop & Prins Reference KLOP and PRINS2008, Mizutani Reference MIZUTANI1999). Similar patterns exist in some temperate ecosystems (Frank et al. Reference FRANK, McNAUGHTON and TRACY1998). Robinson & Bennett (Reference ROBINSON and BENNETT2004) used annual rainfall as a simple index of ecosystem type to explore variation in standing biomass of ungulates, primates and rodents across tropical ecosystems (evergreen wet and moist forest, deciduous forest and grassland/savanna). While plant biomass decreases steadily as rainfall declines, mammalian biomass does not follow the same trend. Previously, Eisenberg (Reference EISENBERG, Soulé and Wilcox1980) predicted that the relationship between mammalian biomass and rainfall could be described by a non-linear function in tropical forests. Robinson & Bennett (Reference ROBINSON and BENNETT2004) confirmed this prediction, and proposed a polynomial model which predicted that below 100 mm of rainfall, mammalian standing biomass is low, but grasslands and tropical dry forests with rainfall above 500 mm can support mammalian biomasses between 15 000 and 20 000 kg km−2. In contrast, total mammalian biomass in tropical rain forests rarely exceeds 3000 kg km−2 (Robinson & Bennett Reference ROBINSON and BENNETT2004).
Models that predict the richness and biomass of ungulates depending on rainfall have been developed using data primarily from the African savannas (Coe et al. Reference COE, CUMMING and PHILLIPSON1976, East Reference EAST1984, Fritz & Duncan Reference FRITZ and DUNCAN1994, Olff et al. Reference OLFF, RITCHIE and PRINS2002). However, considering the ecological differences between savannas and tropical forests, and the species composition and foraging guilds (grazers, grazers/browsers, browsers, browsers/frugivores, frugivores and omnivores; Bodmer Reference BODMER1990) differences found between continents, we hypothesized that the prediction of ungulate biomass in tropical forests may be biased when using data from savannas to model this relationship, and this bias may be greater if used to predict actual ungulate biomass in neotropical forests. To test these hypotheses, we used data from neotropical and palaeotropical dry and wet forests as well as from African savannas to evaluate the variation in standing ungulate biomass across a rainfall gradient using polynomial models. In this study we aimed to: (1) compare ungulate biomass between tropical forests and savannas; and (2) contrast predicted against observed local ungulate biomasses between a tropical dry forest and a tropical wet forest in Chamela-Cuixmala (CCBR) and Montes Azules (MABR) Biosphere Reserves in Mexico, respectively. From the neotropical ungulate perspective, we were particularly interested in evaluating the potential of polynomial models to predict ungulate biomass in neotropical dry and wet forests. A good model would allow us to estimate ungulate biomass at poorly studied sites, which in turn could be applied to support conservation and sustainable-use practices. We focus our discussion on the comparison of those ungulate families present today (Cervidae and Bovidae), as well as on the presence/absence of megaherbivores.
METHODS
Ungulate biomass–rainfall models
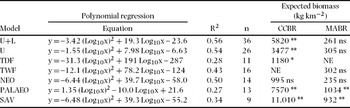
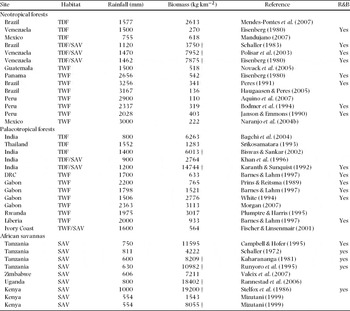
We compiled ungulate biomass data from 36 studies: neotropical dry forests (N = 6), neotropical wet forests (N = 8), palaeotropical dry forests (N = 5), palaeotropical wet forests (N = 8) and African savannas (N = 9) (Appendix 1). Neotropical forest data came from Mexico and South America; palaeotropical dry forest data were mainly from India; and palaeotropical wet forest data came from Africa. Using rainfall as an independent variable and ungulate biomass as a dependent variable, a polynomial model was estimated where y is biomass (kg km−2) predicted as function of rainfall in mm (x). Rainfall and biomass data were taken as published, but in cases where intervals were reported, we used mean values. We used the data set to estimate polynomial models for the following three cases: (1) complete data set including native ungulates and livestock at some sites (Model U+L) and only native ungulates at others (Model U); (2) data pooled by ecosystem type: tropical dry forests (Model TDF), tropical wet forests (Model TWF), and savannas (Model SAV); and (3) data pooled by region: Neotropical forests (Model NEO), Palaeotropical forests (Model PALAEO), and African savannas (Model SAV) (Table 1).
Polynomial models and prediction of ungulate biomass in the tropical dry forest of Chamela-Cuixmala Biosphere Reserve (CCBR), and the tropical wet forest of Montes Azules Biosphere Reserve (MABR). Abbreviations: native ungulates (U), livestock (L), Palaeotropical (PALAEO), Neotropical (NEO), tropical dry forest (TDF), tropical wet forest (TWF) and African savanna (SAV). Regression coefficients: predicted ungulate biomass (y), rainfall (x), determination coefficient (r2) and number of studies (n). Not estimated (NE), non-significant (ns), (*) P < 0.01 and (**) P < 0.001.

In order to test for differences in ungulate biomass values between ecosystem types, we applied a two-way analysis of covariance (ANCOVA), using biomass as the dependent variable, forest/site as the independent variable, and rainfall as the covariate variable. In the case of tropical dry forests and savannas, available data allowed us to separate those sites where only wild ungulates were present from those where livestock also occurred. None of the tropical wet forest sites supported both native ungulates and livestock simultaneously. We later used a post hoc LSD test to assess potential differences among forests/sites. Significant differences were assumed when P < 0.05. Statistical analyses were performed with the software Statistica version 5.5 (StatSoft, Inc., Tulsa, Oklahoma, USA).
Local analyses in Mexico
In order to test predictions of ungulate biomass at a local level using polynomial models, we selected data from two neotropical forests in Mexico where previously separate estimates of this variable were available (Mandujano Reference MANDUJANO2007, Naranjo et al. Reference NARANJO, GUERRA, BODMER and BOLAÑOS2004a). The locations were the Chamela-Cuixmala Biosphere Reserve (CCBR) and the Montes Azules Biosphere Reserve (MABR). CCBR is located on the coast of Jalisco, Mexico (19°30ʹN, 105°00ʹW). Here, the mean annual temperature is 25 °C, and climate is tropical with marked seasonality. Mean annual rainfall is 755 mm, with 80% of the rain falling between July and October. The dominant vegetation is tropical dry forest growing in rich soils. MABR is located in north-eastern Chiapas, Mexico (16°05ʹN, 90°30ʹW). Here, the mean annual temperature is 25 °C, while mean annual rainfall is 2500–3500 mm, with 80% of the rain falling between June and November. The dominant vegetation type in the area is tropical wet forest (also called rain forest) growing in poor soils.
Biomass was assessed through the multiplication of mean population densities of ungulates by their average body weight (15.9 kg for the collared peccary Pecari tajacu Linneaus; 26.9 kg for the white-lipped peccary Tayassu pecari G. Fisher; 42.3 kg for the white-tailed deer Odocoileus virginianus Zimmermann; 25.0 for the red brocket deer Mazama temama Kerr; and 190.0 kg for Baird's tapir Tapirus baiirdi Gill) (Naranjo et al. Reference NARANJO, GUERRA, BODMER and BOLAÑOS2004a). At both study sites, mean annual density (D, individuals km−2) was calculated as: D = nf(0)/2L, where n is the number of observations (groups of any size), f(0) is the probabilistic function of density at 0 m of perpendicular distance, and L is total length (km) of the transect. To estimate f(0) and the standard error, we used the program DISTANCE 5.1 (http://www.ruwpa.st-and.ac.uk/distance/). Our field observations suggest that detection probability declines noticeably beyond 40 m of perpendicular distance from transects. Therefore, long transects were walked in order to increase the precision of density estimates through the detection of higher numbers of animals in both tropical forests. Density estimations were based on the following numbers of observations: 363 white-tailed deer and 44 collared peccary groups (106 individuals), L = 817 km in CCBR; and 14 tapir, 13 white-lipped peccary groups (211 individuals), 49 collared peccary groups (87 individuals), and 13 brocket deer, L = 1307 km in MABR (Mandujano Reference MANDUJANO2007, Naranjo et al. Reference NARANJO, GUERRA, BODMER and BOLAÑOS2004a).
RESULTS
Biomass–rainfall models
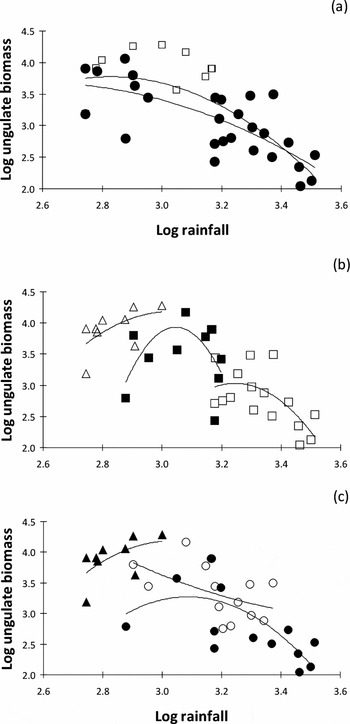
As a general pattern, ungulate biomass increased with rainfall from 500 to 1000 mm; maximum biomass was reached at 1000 to 1500 mm, and then declined from 1500 to 3200 mm. Thus, ungulate biomass (Model U+L) across a rainfall gradient fitted well to a polynomial regression model (Table 1, Figure 1a). Elimination of 10 data sets from tropical dry forests and savannas where livestock was included (Model U), produced lower values of predicted biomass in these ecosystems, while this did not affect expected ungulate biomass in the tropical wet forests analysed (Figure 1a).
Log10 biomass (kg km−2) of ungulates against Log10 annual rainfall (mm) at tropical sites. Model U+L (◽) includes ungulate native and livestock in some sites, whereas model U (·) excludes livestock (a). Models for tropical dry forests (◾), tropical wet forests (◽) and African savannas (Δ) (b). Models for neotropical forests (·), palaeotropical forests (○), and African savannas (▲) (c). Continuous curves represent data fitted to a polynomial regression. Details of each model are presented in Table 1.

In a separate analysis, data sets from tropical dry forests, tropical wet forests and African savannas fitted well to different polynomial models (Table 1, Figure 1b). Some tropical dry forests (Chamela, Mexico; Gir and Rajasthan, India) and savannas (Serengeti, Tanzania; Lake Mburo, Uganda; Mara, Kenya) received similar rainfall (750–1000 mm), but expected ungulate biomass varied considerably between ecosystems. The same pattern was observed for some tropical dry forests (Amazon, Brazil; Guatopo, Venezuela; Uthai Thani, Thailand) and tropical wet forests (Maya Biosphere Reserve, Guatemala; Lopé Reserve, Gabon; Comoé, Ivory Coast) where annual rainfall was between 1500 and 1600 mm, but expected biomass varied notably. A separate analysis of data from neotropical, palaeotropical and African savannas showed a higher variation in ungulate biomass in the palaeotropical region and, as a consequence, fitted poorly to a polynomial model (Table 1, Figure 1c).
Local analysis
The tropical wet forest of MABR is inhabited by five ungulate species with the following estimated biomass (mean ± SD): Baird's tapir 57 ± 30.4 kg km−2, white-lipped peccary 132 ± 65.5 kg km−2, collared peccary 27 ± 9.8 kg km−2, red brocket deer 5 ± 2.2 kg km−2 and white-tailed deer <1 ± 0.5 kg km−2. The combined biomass was 222 ± 108 kg km−2. In contrast, the tropical dry forest of CCBR shelters only two species: collared peccary 119 ± 50.8 kg km−2 and white-tailed deer 499 ± 44.0 kg km−2. Their combined biomass was 618 ± 95 kg km−2. The white-lipped peccary and Baird's tapir comprised 85.4% of the total ungulate biomass in MABR, while the white-tailed deer represented 80.7% of the total ungulate biomass in CCBR.
Predictions of expected ungulate biomass in CCBR and MABR varied considerably depending on the polynomial model used (Table 1). This variation was higher for the tropical dry forest in CCBR; for example, all models except NEO (single sample t-test, t = 3.34, P = 0.05) predicted biomass values higher than those observed. In contrast, expected biomass predicted by models U+L (t = 1.33, P = 0.27), U (t = 1.95, P = 0.15), TWF (t = 1.91, P = 0.15) and NEO (t = 0.97, P = 0.41) was close to the observed values in the tropical wet forest of MABR. As we hypothesized, the local Model NEO was the best model for estimating expected biomass in both CCBR and MABR.
Comparison among ecosystems
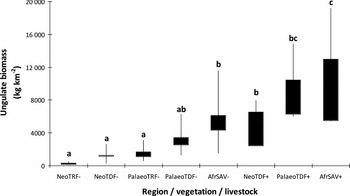
The two-way ANCOVA analysis indicated that at the ecosystem level, African savannas (9935 kg km−2), tropical dry forests (4933 kg km−2) and tropical wet forests (995 kg km−2) support significantly different ungulate biomasses (F = 5.51, df = 2, 32, P = 0.009). At regional level, African savannas (9935 kg km−2) support a significantly higher biomass than both palaeotropical forests (3424 kg km−2) and neotropical forests (1834 kg km−2) (F = 3.40, df = 2, 32, P = 0.046). Considering the presence/absence of livestock, African savannas and palaeotropical dry forests support the highest ungulate biomass (Figure 2, F = 6.15, df = 7, 27, P = 0.0002). In the absence of livestock, neotropical and palaeotropical dry and wet forests sustain a relatively similar biomass. When livestock is present in the neotropical dry forest, ungulate biomass is similar to that of the African savannas without livestock, and to palaeotropical dry forests (post hoc LSD test, P < 0.05). None of the selected tropical wet forests supports both native ungulates and livestock simultaneously.
Comparison of ungulate biomass between tropical dry (TDF) and wet (TWF) forests, and savanna (SAV) in neotropical (Neo), palaeotropical (Palaeo) and African (Afr) regions. Localities where livestock and wild ungulates were (+) or were not (−) considered simultaneously are shown. Letters (a, b, c) represent the post hoc LSD test comparison and grouped non-significant (P > 0.05) differences among localities.

DISCUSSION
Rainfall–biomass relationships
Considerable site-to-site variation is evident in the available estimates of forest ungulate biomass. We agree with Oates et al. (Reference OATES, WHITESIDES, DAVIES, WATERMAN, GREEN, DASILVA and MOLE1990) in that sampling errors, differences in the intensity of hunting by humans, and differences in sampling and analytical techniques undoubtedly contribute to this variation. However, these factors alone are insufficient to explain the magnitude of the variation reported. Ungulate biomass across a rainfall gradient can be fitted to a polynomial model. However, our results suggest that an overestimation of expected ungulate biomass could be obtained for some tropical forests if data from African savannas are included in the model. This overestimation was particularly high for predicted ungulate biomass in neotropical dry forests. Our analysis also showed that these ecosystems sustain different ungulate biomass values even for similar amounts of rainfall. This was particularly true for some tropical dry forests and savannas, and tropical dry and wet forests. Our analyses suggest that rainfall can predict expected ungulate biomass in neotropical ecosystems relative to that of palaeotropical ones under similar precipitation regimes, but it cannot correctly predict the actual or observed ungulate biomass at the local level if data outside the Neotropics are included in the model. This was most evident when we compared observed against predicted biomass in the tropical dry forest of CCBR, while some polynomial models successfully predicted observed biomass for the tropical wet forest of MABR. Therefore, pooling data from different sites gave us a general vision of the ungulate biomass along a rainfall gradient. But in order to obtain a better prediction at the local level, we suggest separate models for each region (neotropical or palaeotropical) and forest type (dry or wet forest), and savannas. We strongly recommend testing our polynomial model NEO (Table 1) on poorly studied neotropical forests.
Soil nutrient content has been suggested as another important factor for predicting ungulate richness and biomass (East Reference EAST1984, Olff et al. Reference OLFF, RITCHIE and PRINS2002). Using a multiple regression model, Olff et al. (Reference OLFF, RITCHIE and PRINS2002) showed that the highest diversity is expected in areas with intermediate moisture and high soil nutrient content (e.g. Argetinian pampas, Gir forest of India, steppes of Kazakhstan and Mongolia, Cordillera of Spain, and coastal region of Morocco and Algeria). However, recent analysis showed that moisture and nutrients alone fail to adequately predict the diversity patterns of grazing ungulates in West Africa (Klop & Prins Reference KLOP and PRINS2008). For example, in Laikipia, Kenya, the observed biomass of wild herbivores was estimated at 1543 kg km−2, while predicted biomass using the models of Coe et al. (Reference COE, CUMMING and PHILLIPSON1976) and East (Reference EAST1984) were 3371 and 1888 kg km−2, respectively. Additional factors constraining ungulate population growth such as predation, body size, feeding habits and density-dependent effects (Gaidet & Gaillard Reference GAIDET and GAILLARD2008, Sæther Reference SÆTHER1997) should be included to increase the predictive accuracy in polynomial models.
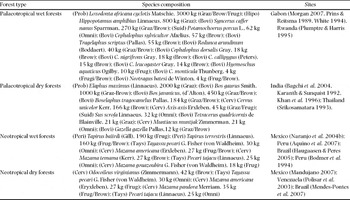
To explain differences between expected and observed biomass in neotropical ungulates, we should also consider species composition. From the data set shown in Appendix 1, we selected cases to illustrate the structure of ungulate guilds among neotropical and palaeotropical forests (Table 2). The inspection of this table suggests the following patterns: (1) neotropical forests maintain lower species richness in comparison with palaeotropical forests, this difference being particularly significant in neotropical dry forests; (2) neotropical forest ungulate guilds are made up of deer, peccaries and tapirs, and lack the heavier species (e.g. proboscidians and bovids such as buffalo and gaur) present in the palaeotropics; (3) neotropical forests maintain browsers, frugivores and omnivores, but no grazers; and (4) well-preserved neotropical and palaeotropical wet forests do not maintain livestock. These four assumptions are discussed in the following sections.
Examples of selected studies to show differences in species composition, individual body size, and principal feeding strategies of ungulates and proboscidians of palaeotropical and neotropical dry and wet forests. Species are listed according to their body mass. Abbreviations: orders Proboscidea (Prob) and Perissodactyla (Peri); families Suidae (Suid), Tayassuidae (Tays), Hippopotamidae (Hipo), Bovidae (Bovi) and Cervidae (Cerv). Feeding strategies classified according to Bodmer (Reference BODMER1990): grazers (Graz), browsers (Brow), frugivores (Frug), and omnivores (Omni).

Biogeographic differences
Pleistocene ungulates and proboscidians were represented in Mexico by at least 23 extinct species of artiodactyl (Antilocapridae, Bovidae, Camelidae, Cervidae and Tayassuidae); six extinct species of perissodactyl (Equidae and Tapiridae); and five extinct species of proboscidian (Elephantidae, Gomphotheriidae and Mammutidae) (Arroyo-Cabrales et al. Reference ARROYO-CABRALES, POLACO and JOHNSON2007). The Pleistocene megafauna included a group of typical grassland and savanna herbivores, which inhabited most of the present day Mexican Plateau. Among these were bison, camels, horses, pronghorns, ground sloths, llamas and mammoths. Browsers were found in the mountains, including different species of deer, several of which are now extinct, mastodons, gomphotheres, toxodonts, ground sloths and glyptodonts (Arroyo-Cabrales et al. Reference ARROYO-CABRALES, POLACO and JOHNSON2007). Extinct orders of South American ungulates include Lipoterna, Notoungulata, Pyrotheria and Astrapotheria (MacFadden Reference MACFADDEN2006). Species of the orders Artiodactyla, Perissodactyla and Proboscidea migrated south through the Isthmus of Panama during the Pliocene (5.3–1.8 Mya). Consequently, a rich fauna of large herbivores (ground sloths, lipoterns, notoungulates, proboscideans, horses, tapirs, peccaries, llamas and deer) was present in the late Pleistocene (de Vivo & Carmignotto Reference DE VIVO and CARMIGNOTTO2004). Increased competition during the Great American Interchange and human influence during the late Pleistocene resulted in the reduced diversity of grazing mammals we see today (MacFadden Reference MACFADDEN2006).
Out of 257 species of living ungulate, 34 are in the Americas (Wilson & Reeder Reference WILSON and REEDER2005). The Cervidae include 56% of the New World ungulate species. A notable aspect of New World ungulate communities is the near absence of Bovidae (only five of the 137 species), which are confined to North America. Therefore, of the 34 New World ungulate species, 10 species are restricted to the nearctic region, 22 species inhabit the neotropical region, and the remaining two species (white-tailed deer and collared peccary) are widely distributed throughout the continent. At least 15 species (principally from genus Mazama) occur in tropical dry and wet forests. However, no site contains all these species together. At the local level, neotropical ungulate richness varies from two to five species in dry forests (Mandujano Reference MANDUJANO2007, Mendes-Pontes et al. Reference MENDES-PONTES, CHIVERS and LEE2007, Polisar et al. Reference POLISAR, MAXIT, SCOGNAMILLO, FARREL, SUNQUIST and EISENBERG2003), and five to seven species in wet forests (Aquino et al. Reference AQUINO, TERRONES and TERRONES2007, Bodmer et al. Reference BODMER, FA, MOYA and GILL1994, Haugaasen & Peres Reference HAUGAASEN and PERES2005, Naranjo et al. Reference NARANJO, BOLAÑOS, GUERRA, BODMER, Silvius, Bodmer and Fragoso2004b, Novack et al. Reference NOVACK, MAIN, SUNQUIST and LABISKY2005). In contrast, five to seven species inhabit the dry forests of India and Thailand (Bagchi et al. Reference BAGCHI, GOYAL and SANKAR2004, Karanth & Sunquist Reference KARANTH and SUNQUIST1992, Khan et al. Reference KHAN, CHELLAM, RODGERS and JOHNSINGH1996, Srikosamatara Reference SRIKOSAMATARA1993), while five to 12 species occur in the tropical wet forests of Gabon and Rwanda (Morgan Reference MORGAN2007, Plumptre & Harris Reference PLUMPTRE and HARRIS1995, Prins & Reitsma Reference PRINS and REITSMA1989, White Reference WHITE1994) (Table 2).
Guild structure
Ungulate feeding strategies form a linear continuum of grazers, grazers/browsers, browsers, browsers/frugivores, frugivores and omnivores (Bodmer Reference BODMER1990). Pure grazers are absent from neotropical forests (McNaughton et al. Reference McNAUGHTON, SALA, OESTERHELD and Goldblatt1993). In particular, frugivorous ungulates are an important component in tropical forests (e.g. small-bodied ungulates such as duikers in Africa, brocket deer in the Neotropics, and muntjacs in the Malay Archipelago) (Bodmer Reference BODMER1990). Omnivory (peccaries) appears to help terrestrial herbivores inhabiting closed-canopy forests to overcome some of the effects of food limitation (Bodmer Reference BODMER1989). For example, mammalian density and biomass in terra firme Amazonian forests are dominated by mid-sized to large-bodied frugivores and seed predators, while browsers are rare (Haugaasen & Peres Reference HAUGAASEN and PERES2005). Another conspicuous difference between South American and African semi-arid to semi-humid ecosystems is the prevalence of leaf-cutter ants (Atta spp.) as the principal herbivores in the former and large mammals as the major herbivores in the latter (McNaughton et al. Reference McNAUGHTON, SALA, OESTERHELD and Goldblatt1993). For example, in the Brazilian cerrado (a vast tropical savanna eco-region) the biomass consumption by ants is comparable to the biomass consumed by ungulate species such as kudu (Tragelaphus strepsiceros) and impala (Aepyceros melampus) in palaeotropical savannas (Costa et al. Reference COSTA, VASCONCELOS, VEIRA-NETO and BRUNA2008).
A notable aspect in the Neotropics is the absence of megaherbivores (>1000 kg) as a result of Pleistocene extinctions. For example, the forest elephant (Loxodonta africana) dominates in lowland semi-evergreen tropical forest in Lopé Reserve, Gabon, making up 52–89% of its ungulate biomass (Prins & Reitsma Reference PRINS and REITSMA1989, White Reference WHITE1994). Megaherbivores comprise a larger proportion of the ungulate biomass in ecosystems with high rainfall and low soil nutrient contents, and can be considered a separate trophic guild (Fritz et al. Reference FRITZ, DUNCAN, GORDON and ILLIUS2002). In contrast, in the neotropical region ungulates are predominantly small (e.g. cervids), which contrasts with the larger species present in the Palaeotropics (e.g. proboscidians and bovids). Although more palaeontological data are needed, our results allow us to hypothesize that the absence of Bovidae species since the Pleistocene may have left the megaherbivore niche empty in the Neotropics.
Livestock introduction
The possible empty niche left by extinct megaherbivores in the Neotropics, could have been occupied by introduced domestic ungulates (mainly cows, goats, sheep and horses) (McNaughton et al. Reference McNAUGHTON, SALA, OESTERHELD and Goldblatt1993). Since the behaviour and ecology of these domestic species is different to that of wild ungulates, more information on potential niche competition between them is urgently needed. Some previous studies indicate a negative impact of domestic ungulates on wild species. For example, in a tropical dry forest of India, a decline in livestock was followed by an increase in the densities of gaur, chital and elephant by a factor of 57, five and two in the same area, respectively, whereas no changes were observed in the densities of wild pig and sambar (Madhusudan Reference MADHUSUDAN2004). These results indicate that resource competition may be intense between wild herbivores, particularly grazing ruminants, and domestic bulk feeders. These results also suggest that, where possible, interventions to reduce livestock grazing may rapidly benefit wild herbivores that have been competitively suppressed. Even in African savannas, overgrazing by livestock, coupled with episodic droughts, has caused widespread rangeland degradation and the loss of plant and animal diversity (du Toit & Cumming Reference DU TOIT and CUMMING1999).
Our analyses indicate that the tropical dry forest can support a higher cattle biomass than the tropical wet forest. Several studies have demonstrated that trees and shrubs present in tropical dry forests offer better potential food sources for livestock compared with tropical wet forests (Carranza-Montaño et al. Reference CARRANZA-MONTAÑO, SÁNCHEZ-VELÁSQUEZ, PINEDA-LÓPEZ and CUEVAS-GUZMÁN2003). Nonetheless, cattle management practices differ between these types of tropical forests. For example, the original rain-forest landscape has been largely transformed in the region of MABR to maintain livestock on induced grasslands. As a consequence, cattle densities are commonly between 100–150 cows km−2 (45 000–67 500 kg km−2, considering a mean weight of 450 kg per head), which often leads to overgrazing (Naranjo Reference NARANJO, Sánchez-Rojas and Rojas-Martínez2007). In contrast, cattlemen in the region of CCBR, and other Mexican topical dry forests, frequently free their cattle to graze within the tropical dry forest, which causes only a partial transformation of the original forest cover. Such practice maintains considerably lower cattle densities (e.g. 10–14 cows km−2, or 4500–6300 kg km−2), which is similar to the ungulate biomass values reported in other neotropical and palaeotropical tropical dry forests.
Conservation implications
Evidence from palaeontology, climatology, archaeology and ecology now supports the idea that the combination of human impacts with pronounced climatic change drove the precise timing and geography of the megafauna extinction in the northern hemisphere (Barnosky et al. Reference BARNOSKY, KOCH, FERANEC, WING and SHABEL2004). A significant implication of this phenomenon for contemporary conservation biology is that the coupling of marked climatic change with direct human impacts on fauna is especially pernicious. Today, both these processes are happening at an unprecedented rate. For example, many large animals are already ecologically extinct in vast areas of the Neotropics where the forest cover still appears intact (Redford Reference REDFORD1992). Therefore, considering that ungulate species are important for human societies in the Neotropics (Naranjo et al. Reference NARANJO, BOLAÑOS, GUERRA, BODMER, Silvius, Bodmer and Fragoso2004b, Redford Reference REDFORD1992), and assuming that hunting sustainability depends in part upon ecological conditions affecting the supply and demand of wild meat, available information on potential density and biomass of mammals is important from both ecological and management perspectives (Bodmer & Robinson Reference BODMER, ROBINSON, Silvius, Bodmer and Fragoso2004).
From a conservation perspective, our results suggest that tropical wet-forest ungulates appear more vulnerable to local extinction (Bodmer et al. Reference BODMER, EISENBERG and REDFORD1997) than dry-forest ungulates because of their lower densities and biomasses. This is particularly important for the tapir and the white-lipped peccary (Naranjo & Bodmer Reference NARANJO and BODMER2007). For example, local people around MABR extract 17.5 kg km−2 y−1 of wild ungulates, making this practice sustainable for brocket deer and collared peccary, but unsustainable for tapir and white-lipped peccary (Naranjo et al. Reference NARANJO, BOLAÑOS, GUERRA, BODMER, Silvius, Bodmer and Fragoso2004b). Similar results were found by Aquino et al. (Reference AQUINO, TERRONES and TERRONES2007) in the tropical wet forest of Alto Itaya in the Peruvian Amazon. Our results suggest that ungulate management in Wildlife Management and Conservation Units (in Spanish ‘UMA’; a legal system that allows for the sustainable use of wildlife in Mexico, Weber et al. Reference WEBER, GARCÍA-MARMOLEJO and REYNA-HURTADO2006) established in tropical wet forest areas should focus on using species such as brocket deer and collared peccary, while white-tailed deer management seems more plausible for UMA operating in tropical dry forests.
ACKNOWLEDGEMENTS
We appreciate the comments and suggestions of two anonymous reviewers. A. González-Zamora and C. Yañez helped us in the recompilation of some bibliographic data. J. Dunn revised the English transcription. This study was supported by the Department of Biodiversity and Animal Ecology, Institute of Ecology A. C. Xalapa, Mexico, and El Colegio de la Frontera Sur, San Cristobal de Las Casas, Mexico.
Information used to model ungulate biomass in relationship to rainfall in Neotropical and Palaeotropical tropical dry (TDF) and wet forests (TWF), and African savannas (SAV). Includes domestic livestock (†). Used previously by Robinson & Bennett (Reference ROBINSON and BENNETT2004) (R&B).