Decision rules in risk situations for firms have been extensively analyzed. In terms of asset valuation, the Capital Asset Pricing Model (CAPM) is at the root of current methods to estimate the value of an asset; it uses the correlation between the market and the asset, the so-called beta. The Black and Scholes (Reference Black and Scholes1973) model has been routinely used to price and manage financial options. In terms of investment decisions, the book by Dixit and Pindyck (Reference Dixit and Pindyck1994) popularized a full range of methods currently used by firms to decide on whether and when to implement an irreversible investment under uncertainty.
The situation is quite different for public investments, i.e. investments that are decided and largely funded by public authorities, which is often the case for transportation, energy, and more generally essential facilities that are the source of nonpriced externalities (such as congestion) and provide nonmarketed goods and services such as health improvements, increased safety, or time savings. These investments are assessed by public authorities, not through market criteria, but through public Cost-Benefit Analysis (CBA) procedures. CBA has been given a lot of attention, its procedures have been highly refined, and in most countries they have been codified in mandatory recommendations. However, these procedures and recommendations deal essentially with the way benefits should be calculated, a bias which can be easily justified by the fact that benefits come mainly from nonmarket goods, the prices of which are not readily available. Decision rules are rarely addressed. The most frequently evoked criteria are Net Present Value (
 $\mathbf{NPV}$
) or
 $\mathbf{NPV}$
per Dollar spent, and Internal Rate of Return; the literature says little on how to use these criteria, and the current directives even less. Generally, an array of indicators are proposed, but are not accompanied by precise explanations regarding their purposes, advantages, and disadvantages. Furthermore, no attention is paid to risk and uncertainty. Apart from the well-known optimism bias, which is countered mainly through expertise, the most elaborate recommendations deal with scenarios and the most elaborate procedures consist of associating probabilities with scenarios.
Unfortunately, the rules used by firms mentioned above cannot be directly applied to a public investment situation. First, note that the CAPM and its developments do not exist in the case of public investments, as there is no market for these assets, and no asset price can be observed. Second, the interest rate, a preeminent parameter of risk assessment procedures, cannot be used in public investment issues, due to the imperfections of financial markets, i.e. myopia and lack of ethical considerations, especially for long-term investments and inter-generational choices (see Arrow et al., Reference Arrow, Cropper, Gollier, Groom, Heal, Newell, Nordhaus, Pindyck, Pizer, Portney, Thomas Sterner, Tol and Weitzman2012). A discount rate for public decisions has to be built, generally from a social welfare function, and is the subject of a great deal of research (see for instance Barro, Reference Barro2006; Groom, Koundouri, Panopoulou & Pantelidis, Reference Groom, Koundouri, Panopoulou and Pantelidis2007; Gollier, Reference Gollier2011; Arrow et al., Reference Arrow, Cropper, Gollier, Groom, Heal, Newell, Nordhaus, Pindyck, Pizer, Portney, Thomas Sterner, Tol and Weitzman2012; Weitzman, Reference Weitzman2012). Risk and especially systemic risk are central to these works. Nevertheless, this stream of research has been limited to setting the discount rate rather than to deriving a decision rule for public investment. Lastly, the ideas and methods of dynamic programming for decision under uncertainty have never been implemented in directives, or even in specific cases, with the exception of a few studies.
The aim of this text is to fill this gap and show possible ways to make progress in this direction. It addresses the issue of whether and when a given investment should be implemented; this is a very simple situation that does not cover a wide variety of decision-making issues, but it should be noted that in practical decision-making processes, this issue has to be answered at some point. This problem has been addressed by many authors, and especially by Dixit and Pindyck (Reference Dixit and Pindyck1994).
Our framework differs from the previous models (and especially from Dixit and Pindyck) in several ways. First, it involves three stochastic motions instead of a maximum of two in the current dynamic optimization models (for instance in Dixit–Pindyck models); these three motions concern not only the benefits and the cost of implementing the investment, but also the growth of the economy, namely
 $\mathbf{GDP}$
. Second, unlike the method used by Dixit and Pindyck, the discount rate and risk premium are not exogenous; they are built, in a very traditional manner drawn from the above-mentioned authors’ presentation of discount theory, on the basis of a social welfare function (SWF) using
 $\mathbf{GDP}$
as a driver of utility. However, we do not use this framework for the purpose of calculating a discount rate, we use it as a basis for the dynamic optimization to compute the optimal time to implement the investment. To derive such optimization, we make several simplifying assumptions to make the calculation: the main one is that the three stochastic motions are Brownian motions, with linear trends; this crude assumption should be removed in further studies, although it is currently used for its obvious tractability advantage in computations.
We achieve this optimization through a device similar to the one produced by Dixit and Pindyck; the decision rule can be expressed as a threshold value of the First Year Benefit/Cost ratio (FYBCR); this threshold can be expressed in a closed form including the means, standard deviations, and correlations of the stochastic variables; the formula is complex and the relative importance of the parameters do not clearly appear. Therefore, we proceed to simulations with sensible current values of these parameters; these simulations show that the systemic risk, coming from the correlation between the benefits of the investment and the economic growth, is not that high, and that more attention should be paid to the risks of the construction cost of the investment; furthermore simple rules of thumb are designed for estimating the above-mentioned threshold.
The rest of the text is organized as follows: the first section analyzes the limited role of risk in current public investment CBA procedures; the second presents the optimization framework used in this text and its solution in the form of a closed-form relationship; the third section develops the simulations, which give rise to a few rules of thumb; the fourth concludes and points to potential improvements.
1 The limited role of risk and decision criteria in CBA
CBA has received considerable attention in the economics literature, from both conceptual and practical standpoints. Many scientific books and articles, as well as practical guidelines, have been devoted to this subject. Some publications deal exclusively with this topic,Footnote 1 and it is the subject of a whole chapter in all textbooks on transport economicsFootnote 2 – the sector we take as an example in this paper. Similarly, almost all countries, at least in Europe, have issued guidelines on how to implement CBA. However, while these texts pay great attention to how to estimate yearly benefits and to take into account consumers’ surplus and externalities, they put little emphasis on how these yearly benefits can be used to derive prioritization rules or take risk into account. On theoretical grounds, the criteria most frequently evoked are:
-
∙ First of all, the (
 $\mathbf{NPV}$
): where
$$\begin{eqnarray}\mathbf{NPV}=\mathop{\sum }_{t=t_{0}}^{T}\frac{a(t)-c(t)}{(1+j)^{t}}-\frac{I}{(1+j)^{t_{0}}}+\frac{RV}{(1+j)^{T}},\end{eqnarray}$$
$T$
is the appraisal period,
$j$
is the discount rate,
$a(t)$
and
$c(t)$
are the yearly benefits and costs of the project,
$I$
is the cost of building the project (with a proper discounting procedure if implementation takes several years) and
$RV$
is the residual value;
-
∙ Second, several other criteria such as the NPV per euro spent (
$\mathbf{NPV}/E$
); or the internal rate of return (
$\mathit{IRR}$
), which is the discount rate that makes the
$\mathbf{NPV}$
equal to zero, or the FYBCR (
$\mathit{FYBCR}$
):
$$\begin{eqnarray}\mathit{FYBCR}=\frac{a(t_{0})-c(t_{0})}{I}.\end{eqnarray}$$


However, the literature says little about how to use these criteria and the current directives say even less. Generally, an array of indicators are proposed, but do not precisely state each criterion’s purpose and their advantages and disadvantages.Footnote 3 Furthermore, none of them pay much attention to risk and uncertainty. Apart from the well-known optimism bias, which is countered through expert methods, the most elaborate recommendations deal with scenarios while the most elaborate procedures consist of associating probabilities with scenarios.
On the theoretical side, risk has been addressed by several authors using dynamic optimization methods through option values (see Henry, Reference Henry1974) or using Bellman and Pontryagin procedures (see Pindyck (Reference Pindyck1991) and also Traeger (Reference Traeger2014) for a complete discussion of various types of options), and many specific studies have used similar procedures, including the seminal study by McKean (Reference McKean1965) and Samuelson (Reference Samuelson1965). Dixit and Pindyck (Reference Dixit and Pindyck1994) have provided a comprehensive review of decision procedures under risk directed toward private firms (box 1 presents the main characteristics of their fundamental stopping time result). Applications to public investment are rather rare, and relate to specific studies. For instance Farrow (Reference Farrow2004) addresses the differences between taking risk into account and not taking it into account; but he deals with the case of regulation, not investment decisions. Bellinger (Reference Bellinger2016) also provides a thorough review of the issues connected to investment choices, but in a very general way. Other applications of dynamic optimization or variants feature in Purvis, Boggess, Moss and Holt (Reference Purvis, Boggess, Moss and Holt1995), Framstad (Reference Framstad and Strand2015), Fisher (Reference Fisher2000) and Pindyck (Reference Pindyck2002).
Up to now, apart from specific studies, no systematic use of dynamic programming has been implemented and no directive provides an operational procedure, although the general idea of an option value is present in many of them (see for instance OMB Circular A4, 17 September 2004, to the heads of executive agencies and establishments).

2 A
$\mathbf{GDP}$
-based model

We propose a model that fits the paradigm developed in Chapters 4 and 5 of Dixit and Pindyck (Reference Dixit and Pindyck1994) (presented in box 1). This model shares most of the formal aspects but introduces some particularities: it uses a Social Welfare Function (
 $\mathbf{SWF}$
) that directly involves
 $\mathbf{GDP}$
. This
 $\mathbf{SWF}$
allows us to directly determine the NPV and makes the discount rate an endogenous variable.
 $\mathbf{GDP}$
is assumed to follow a stochastic process as well as the benefits and cost of implementation. We therefore have to deal with three stochastic processes, and not one or two as in a typical case.
Moreover, the discount rate is endogenous (not exogenous) and the construction cost is also considered as at risk. As a consequence, the model is
 $3$
-dimensional in its definition (extending the examples considered in Dixit and Pindyck (Reference Dixit and Pindyck1994)); however, we will see that it can still be solved in a closed form thanks to its homogeneity properties.
2.1 The framework
The model uses standard assumptions on the utility function and on the yearly benefits and cost of the investment to assess. The assumptions on the
 $\mathbf{SWF}$
are quite standard (we refer to Gollier (Reference Gollier2011) for details); they allow for easily deriving results which grasp the main characteristics at work. This
 $\mathbf{SWF}$
is intertemporal and depends on the consumptions of each point of time in a continuous time framework; as usual, consumption is approached by the income per head of the representative agent
 $Y(t)$
, an assumption that could be criticized on the grounds that this income per head does not include nonmarket goods or externalities which are at the root of the public concern, but which feature in almost all discount theories. The
 $\mathbf{SWF}$
typically combines a rate of impatience
 $\unicode[STIX]{x1D6FF}$
and an aversion for inequality
 $\unicode[STIX]{x1D6FE}$
(greater than one) in the following expression:Footnote
4
 $$\begin{eqnarray}\mathbf{SWF}=\int _{0}^{+\infty }e^{-\unicode[STIX]{x1D6FF}t}\frac{Y(t)^{1-\unicode[STIX]{x1D6FE}}}{1-\unicode[STIX]{x1D6FE}}\,dt.\end{eqnarray}$$
If
 $Y(t)$
incurs a marginal change
 $a(t)$
, at time
 $t$
, then the change in
 $\mathbf{SWF}$
produce by this change is given by
 $$\begin{eqnarray}\mathbf{NPV}(t)=e^{-\unicode[STIX]{x1D6FF}t}Y(t)^{-\unicode[STIX]{x1D6FE}}a(t)\end{eqnarray}$$
and is the total (
 $\mathbf{NPV}$
) by:
 $$\begin{eqnarray}\mathbf{NPV}=\int _{0}^{+\infty }\mathbf{NPV}(t)\,dt.\end{eqnarray}$$
Let us consider the case where
 $Y(t)$
is certain and follows an exponential path:
 $$\begin{eqnarray}d\log (Y(t))=\unicode[STIX]{x1D707}\,dt.\end{eqnarray}$$
Then:
 $$\begin{eqnarray}\mathbf{NPV}(t)=Y(0)a(0)e^{-(\unicode[STIX]{x1D6FF}+\unicode[STIX]{x1D707}\unicode[STIX]{x1D6FE})t},\end{eqnarray}$$
which shows that the discount rate, transforming values at time
 $t$
to present values, is
 $\unicode[STIX]{x1D6FF}+\unicode[STIX]{x1D707}\unicode[STIX]{x1D6FE}$
. Let us now assume that
 $Y(t)$
and
 $a(t)$
both follow Brownian motions:
 $$\begin{eqnarray}\left\{\begin{array}{@{}l@{}}d\log (Y(t))=\unicode[STIX]{x1D707}dt+\unicode[STIX]{x1D70E}_{1}dW_{1}(t)\\ d\log (a(t))=gdt+\unicode[STIX]{x1D70E}_{2}dW_{2}(t)\end{array}\right.\end{eqnarray}$$
where
 $$\begin{eqnarray}\begin{array}{@{}l@{}}W_{t}^{1}=\bar{W}_{t}^{1},\\ W_{t}^{2}=\unicode[STIX]{x1D70C}\bar{W}_{t}^{1}+\sqrt{1-\unicode[STIX]{x1D70C}^{2}}\bar{W}_{t}^{2},\end{array}\end{eqnarray}$$
 $\bar{W}_{t}^{1}$
,
 $\bar{W}_{t}^{2}$
being
 $2$
independent Brownian motions. In that case, we are able to compute the expected change of
 $\mathbf{SWF}$
, given by
 $\mathbf{E}(\mathbf{NPV}(t))=\mathbf{E}(e^{-\unicode[STIX]{x1D6FF}t}Y(t)^{-\unicode[STIX]{x1D6FE}}a(t))$
. Using an explicit expression for
 $a(t)$
and
 $Y(t)$
derived from (2), we find
 $$\begin{eqnarray}\displaystyle \mathbf{E}(\mathbf{NPV}(t)) & = & \displaystyle a(0)Y(0)e^{-(\unicode[STIX]{x1D6FF}+\unicode[STIX]{x1D707}\unicode[STIX]{x1D6FE}+g)t+1/2(\unicode[STIX]{x1D6FE}^{2}\unicode[STIX]{x1D70E}_{1}^{2}+\unicode[STIX]{x1D70E}_{2}^{2}-2\unicode[STIX]{x1D70C}\unicode[STIX]{x1D70E}_{1}\unicode[STIX]{x1D70E}_{2}\unicode[STIX]{x1D6FE})t},\nonumber\\ \displaystyle & = & \displaystyle a(0)Y(0)e^{-(\unicode[STIX]{x1D6FF}+\unicode[STIX]{x1D707}\unicode[STIX]{x1D6FE})t+1/2(\unicode[STIX]{x1D6FE}^{2}\unicode[STIX]{x1D70E}_{1}^{2}-2\unicode[STIX]{x1D70C}\unicode[STIX]{x1D70E}_{1}\unicode[STIX]{x1D70E}_{2}\unicode[STIX]{x1D6FE})t}e^{-(g+\unicode[STIX]{x1D70E}_{2}^{2}/2)t}.\nonumber\end{eqnarray}$$
The second exponential translates the growth trend of
 $a(t)$
and the first one is the discounting term with a discount rate, which can be written as
 $$\begin{eqnarray}r=\unicode[STIX]{x1D6FF}+\unicode[STIX]{x1D707}\unicode[STIX]{x1D6FE}-{\textstyle \frac{1}{2}}\unicode[STIX]{x1D6FE}^{2}\unicode[STIX]{x1D70E}_{1}^{2}+\unicode[STIX]{x1D70C}\unicode[STIX]{x1D70E}_{1}\unicode[STIX]{x1D70E}_{2}\unicode[STIX]{x1D6FE},\end{eqnarray}$$
or, noting the correlation coefficient between
 $\log (Y(t))$
and
 $\log (a(t))$
as
 $\unicode[STIX]{x1D6FD}$
and
 $r_{f}=\unicode[STIX]{x1D6FF}+\unicode[STIX]{x1D707}\unicode[STIX]{x1D6FE}-\frac{1}{2}\unicode[STIX]{x1D6FE}^{2}\unicode[STIX]{x1D70E}_{1}^{2}$
 $$\begin{eqnarray}r=r_{f}+\unicode[STIX]{x1D6FE}\unicode[STIX]{x1D70E}_{1}^{2}\unicode[STIX]{x1D6FD}.\end{eqnarray}$$
Let us note the analogy with the CAPM formula giving the return of a risky asset, where
 $r_{f}$
is the “risk free” rate and
 $\unicode[STIX]{x1D6FE}\unicode[STIX]{x1D70E}_{1}^{2}$
is the risk premium.
2.2 General risky situation
However, our main interest is not the discount rate, but on the investment decision rule. Let us now turn to this problem and consider a possible marginal-investment implemented at time
 $T$
, whose marginal cost is
 $I(T)$
, and which provides increases in future
 $Y(t)$
values by a marginal amount
 $a(t)$
. Let us assume that these variables follow Brownian motions:
 $$\begin{eqnarray}\left\{\begin{array}{@{}l@{}}d\log (Y(t))=\unicode[STIX]{x1D707}\,dt+\unicode[STIX]{x1D70E}_{1}\,dW_{1}(t),\\ \,d\log (a(t))=g\,dt+\unicode[STIX]{x1D70E}_{2}\,dW_{2}(t),\\ \,d\log (I(t))=k\,dt+\unicode[STIX]{x1D70E}_{3}\,dW_{3}(t).\end{array}\right.\end{eqnarray}$$
Moreover, we suppose that these Brownian motions are correlated. To be more specific,
 $\bar{W}_{t}^{1}$
,
 $\bar{W}_{t}^{2}$
,
 $\bar{W}_{t}^{3}$
being three independent Brownian motions, we assume that:Footnote
5
 $$\begin{eqnarray}\begin{array}{@{}l@{}}W_{t}^{1}=\bar{W}_{t}^{1}\\ W_{t}^{2}=\unicode[STIX]{x1D70C}\bar{W}_{t}^{1}+\sqrt{1-\unicode[STIX]{x1D70C}^{2}}\bar{W}_{t}^{2}\\ W_{t}^{3}=\unicode[STIX]{x1D70C}^{I}\bar{W}_{t}^{1}+\sqrt{1-(\unicode[STIX]{x1D70C}^{I})^{2}}\bar{W}_{t}^{3}.\end{array}\end{eqnarray}$$
In this case, a deterministic time cannot give an optimal decision time when randomness is introduced, as it is necessary to use the informations given by
 $a(t)$
,
 $Y(t)$
, and
 $I(t)$
in order to determine the optimal time of the investment.
We need to determine an optimal stopping time and will use optimal stopping theory for this. We refer to Dixit and Pindyck (Reference Dixit and Pindyck1994) for an introduction to and background on this question in a financial context and to McKean (Reference McKean1965), Samuelson (Reference Samuelson1965) for the first application of this theory to finance.
We have to maximize
 $\mathbf{E}(\mathbf{NPV}(\unicode[STIX]{x1D70F}))$
where:
 $$\begin{eqnarray}\mathbf{NPV}(\unicode[STIX]{x1D70F})=\int _{\unicode[STIX]{x1D70F}}^{+\infty }e^{-\unicode[STIX]{x1D6FF}t}a(t)Y(t)^{-\unicode[STIX]{x1D6FE}}\,dt-e^{-\unicode[STIX]{x1D6FF}\unicode[STIX]{x1D70F}}I(\unicode[STIX]{x1D70F})Y(\unicode[STIX]{x1D70F})^{-\unicode[STIX]{x1D6FE}}\end{eqnarray}$$
among all the stopping times
 $\unicode[STIX]{x1D70F}$
of the filtration
 ${\mathcal{F}}_{t}=\unicode[STIX]{x1D70E}(Y_{s},a_{s},I_{s},s\leqslant t)$
.Footnote
6
Box 2 presents the solution in the certain case, in which the standard deviation of the above variables is null.

Let us turn to the general solution where the standard deviations and correlation are not null. Using Markov property for the process
 $(a,I,Y)$
, we obtain:
 $$\begin{eqnarray}\displaystyle & & \displaystyle \mathbf{E}\left(\left.\int _{\unicode[STIX]{x1D70F}}^{+\infty }e^{-\unicode[STIX]{x1D6FF}t}a(t)Y(t)^{-\unicode[STIX]{x1D6FE}}\,dt\right|{\mathcal{F}}_{\unicode[STIX]{x1D70F}}\right)\nonumber\\ \displaystyle & & \displaystyle \quad =\mathbf{E}_{\unicode[STIX]{x1D70F},a(\unicode[STIX]{x1D70F}),I(\unicode[STIX]{x1D70F}),Y(\unicode[STIX]{x1D70F})}\left(\int _{\unicode[STIX]{x1D70F}}^{+\infty }e^{-\unicode[STIX]{x1D6FF}t}a(t)Y(t)^{-\unicode[STIX]{x1D6FE}}\,dt\right)\nonumber\\ \displaystyle & & \displaystyle \quad =e^{-\unicode[STIX]{x1D6FF}\unicode[STIX]{x1D70F}}a(\unicode[STIX]{x1D70F})Y(\unicode[STIX]{x1D70F})^{-\unicode[STIX]{x1D6FE}}\mathbf{E}\left(\int _{0}^{+\infty }e^{-\unicode[STIX]{x1D6FF}s+gs+\unicode[STIX]{x1D70E}_{2}W_{s}^{2}-\unicode[STIX]{x1D6FE}\unicode[STIX]{x1D707}s-\unicode[STIX]{x1D6FE}\unicode[STIX]{x1D70E}_{1}W_{s}^{1}}\,ds\right).\nonumber\end{eqnarray}$$
The last integral can be computed. Taking into account the correlation structure of the Brownian motions
 $(W^{2},W^{1})$
, we get (assuming
 $\unicode[STIX]{x1D6FF}_{1}>0$
):Footnote
7
 $$\begin{eqnarray}\mathbf{E}\left(\left.\int _{\unicode[STIX]{x1D70F}}^{+\infty }e^{-\unicode[STIX]{x1D6FF}t}a(t)Y(t)^{-\unicode[STIX]{x1D6FE}}\,dt\right|{\mathcal{F}}_{\unicode[STIX]{x1D70F}}\right)=\frac{e^{-\unicode[STIX]{x1D6FF}\unicode[STIX]{x1D70F}}a(\unicode[STIX]{x1D70F})Y(\unicode[STIX]{x1D70F})^{-\unicode[STIX]{x1D6FE}}}{\unicode[STIX]{x1D6FF}_{1}},\end{eqnarray}$$
where:
 $$\begin{eqnarray}\unicode[STIX]{x1D6FF}_{1}=\unicode[STIX]{x1D6FF}+\unicode[STIX]{x1D6FE}\unicode[STIX]{x1D707}-g-{\textstyle \frac{1}{2}}\bar{\unicode[STIX]{x1D70E}}_{2}^{2}\end{eqnarray}$$
with
 $$\begin{eqnarray}\bar{\unicode[STIX]{x1D70E}}_{2}^{2}=\unicode[STIX]{x1D70E}_{2}^{2}+\unicode[STIX]{x1D6FE}^{2}\unicode[STIX]{x1D70E}_{1}^{2}-2\unicode[STIX]{x1D6FE}\unicode[STIX]{x1D70C}\unicode[STIX]{x1D70E}_{1}\unicode[STIX]{x1D70E}_{2}.\end{eqnarray}$$
So we have obtained a simplified formula for the expectation of the
 $\mathbf{NPV}$
:
 $$\begin{eqnarray}\mathbf{E}(\mathbf{NPV}(\unicode[STIX]{x1D70F}))=\mathbf{E}\left(e^{-\unicode[STIX]{x1D6FF}\unicode[STIX]{x1D70F}}Y(\unicode[STIX]{x1D70F})^{-\unicode[STIX]{x1D6FE}}\left[\frac{a(\unicode[STIX]{x1D70F})}{\unicode[STIX]{x1D6FF}_{1}}-I(\unicode[STIX]{x1D70F})\right]\right).\end{eqnarray}$$
Now, let us denote by
 $u(a_{0},Y_{0},I_{0})$
the value function of the optimal stopping problem:
 $$\begin{eqnarray}u(a_{0},Y_{0},I_{0})=\sup _{\unicode[STIX]{x1D70F},{\mathcal{F}}_{t}\text{t.a.}}\mathbf{E}(\mathbf{NPV}(\unicode[STIX]{x1D70F})).\end{eqnarray}$$
Standard results of optimal stopping theory allows us to identify an optimal stopping time as:
 $$\begin{eqnarray}\unicode[STIX]{x1D70F}_{\text{opt}}=\inf \left\{t\geqslant 0,u(a(t),Y_{t},I_{t})=Y_{t}^{-\unicode[STIX]{x1D6FE}}\left[\frac{a(t)}{\unicode[STIX]{x1D6FF}_{1}}-I(t)\right]\right\}.\end{eqnarray}$$
Moreover, the value function
 $u$
(see Lapeyre and Quinet (Reference Lapeyre and Quinet2016), Appendix B for details) can be rewritten as:
 $$\begin{eqnarray}u(a_{0},I_{0},Y_{0})=Y_{0}^{-\unicode[STIX]{x1D6FE}}\bar{u}(a_{0},I_{0})\end{eqnarray}$$
with:
 $$\begin{eqnarray}\bar{u}(a_{0},I_{0})=\sup _{\unicode[STIX]{x1D70F}\text{t.a.}}\tilde{\mathbf{E}}\left(e^{-\unicode[STIX]{x1D6FF}_{2}\unicode[STIX]{x1D70F}}\left(\frac{a_{0}}{\unicode[STIX]{x1D6FF}_{1}}e^{\unicode[STIX]{x1D707}_{2}\unicode[STIX]{x1D70F}+\bar{\bar{\unicode[STIX]{x1D70E}}}_{2}\tilde{W}_{\unicode[STIX]{x1D70F}}^{2}}-I_{0}\right)_{+}\right),\end{eqnarray}$$
where
 $$\begin{eqnarray}\left\{\begin{array}{@{}l@{}}\bar{\unicode[STIX]{x1D70E}}_{2}^{2}=\unicode[STIX]{x1D70E}_{2}^{2}+\unicode[STIX]{x1D6FE}^{2}\unicode[STIX]{x1D70E}_{1}^{2}-2\unicode[STIX]{x1D70C}\unicode[STIX]{x1D6FE}\unicode[STIX]{x1D70E}_{1}\unicode[STIX]{x1D70E}_{2}\\ \unicode[STIX]{x1D6FF}_{1}=\unicode[STIX]{x1D6FF}+\unicode[STIX]{x1D6FE}\unicode[STIX]{x1D707}-g-{\textstyle \frac{1}{2}}\bar{\unicode[STIX]{x1D70E}}_{2}^{2}\\ \bar{\unicode[STIX]{x1D70E}}_{3}^{2}=\unicode[STIX]{x1D70E}_{3}^{2}+\unicode[STIX]{x1D6FE}^{2}\unicode[STIX]{x1D70E}_{1}^{2}-2\unicode[STIX]{x1D70C}_{I}\unicode[STIX]{x1D6FE}\unicode[STIX]{x1D70E}_{1}\unicode[STIX]{x1D70E}_{3}\\ \unicode[STIX]{x1D6FF}_{2}=\unicode[STIX]{x1D6FF}+\unicode[STIX]{x1D6FE}\unicode[STIX]{x1D707}-k-{\textstyle \frac{1}{2}}\bar{\unicode[STIX]{x1D70E}}_{3}^{2}\\ \bar{\bar{\unicode[STIX]{x1D70E}}}_{2}^{2}=\unicode[STIX]{x1D70E}_{2}^{2}+\unicode[STIX]{x1D70E}_{3}^{2}-2\unicode[STIX]{x1D70C}\unicode[STIX]{x1D70C}_{I}\unicode[STIX]{x1D70E}_{2}\unicode[STIX]{x1D70E}_{3}\\ \unicode[STIX]{x1D70C}_{3}=\frac{(\unicode[STIX]{x1D70E}_{3}\unicode[STIX]{x1D70C}_{I}-\unicode[STIX]{x1D6FE}\unicode[STIX]{x1D70E}_{1})(\unicode[STIX]{x1D70C}\unicode[STIX]{x1D70E}_{2}-\unicode[STIX]{x1D70C}_{I}\unicode[STIX]{x1D70E}_{3})-\unicode[STIX]{x1D70E}_{3}^{2}(1-\unicode[STIX]{x1D70C}_{I}^{2})}{\bar{\bar{\unicode[STIX]{x1D70E}}}_{2}\bar{\unicode[STIX]{x1D70E}}_{3}}\\ \unicode[STIX]{x1D707}_{2}=g-k+\unicode[STIX]{x1D70C}_{3}\bar{\bar{\unicode[STIX]{x1D70E}}}_{2}\bar{\unicode[STIX]{x1D70E}}_{3}.\end{array}\right.\end{eqnarray}$$
But the function
 $\bar{u}$
can be explicitly computed and used to obtain a Dixit–Pindyck type representation of an optimal stopping type as in formula (1). We refer to Lapeyre and Quinet (Reference Lapeyre and Quinet2016) Appendix A for details and references. It follows that we can define an optimal stopping time
 $\unicode[STIX]{x1D70F}^{\ast }$
by setting:
 $$\begin{eqnarray}\unicode[STIX]{x1D70F}^{\ast }=\inf \left\{t\geqslant 0,\frac{a(t)}{I_{t}}\geqslant r^{\ast }(\unicode[STIX]{x1D70E})\right\},\end{eqnarray}$$
where:
 $$\begin{eqnarray}r^{\ast }(\unicode[STIX]{x1D70E})=\frac{\sqrt{\unicode[STIX]{x1D707}^{2}+2j\unicode[STIX]{x1D70E}^{2}}-\unicode[STIX]{x1D707}}{\sqrt{\unicode[STIX]{x1D707}^{2}+2j\unicode[STIX]{x1D70E}^{2}}-\unicode[STIX]{x1D707}-\unicode[STIX]{x1D70E}^{2}}(j-\unicode[STIX]{x1D707}-\unicode[STIX]{x1D70E}^{2}/2)\end{eqnarray}$$
with:
 $$\begin{eqnarray}\left\{\begin{array}{@{}l@{}}j=\unicode[STIX]{x1D6FF}_{2}\\ \unicode[STIX]{x1D707}=\unicode[STIX]{x1D707}_{2}\\ \unicode[STIX]{x1D70E}=\bar{\bar{\unicode[STIX]{x1D70E}}}_{2}.\end{array}\right.\end{eqnarray}$$
If we name (as before)
 $r^{\ast }(\unicode[STIX]{x1D70E})$
the minimal FYBCR; the decision rule remains that the investment should be made as soon as the IRR (
 $a(t)/I_{t}$
) reach or overcome the minimal FYBCR. Note that the parameters defining the dynamics of
 $\mathbf{GDP}$
only affect the value of the minimal FYBCR, but that the value of
 $\mathbf{GDP}$
at time
 $t$
is not needed to launch the investment.
3 Teachings from simulations
The above relationship is not easy to grasp. The minimal FYBCR depends on many parameters, and it is not clear which of these are important, or even how they play a role. The recourse to simulations is intended to make things more understandable; these simulations are achieved through sensible estimates of the parameters of the previous formula, drawn from real situations. In order to design these simulations, note first that, for a given sector, the parameters of economic growth and construction costs (rate of growth, standard deviations, and correlation between economic growth and construction costs) are the same; the differences between investments of the same sector lie only in three parameters: the rate of growth of the benefits, the standard deviation of the random component, and its correlation with the random component of economic growth. Hence the employment of a simulation strategy, which consists in gathering data from a sector and drawing from these data average estimates and a reasonable range of these parameters.
3.1 Data
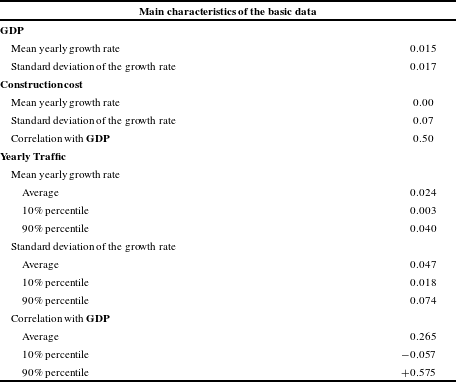
With this objective and thanks to the precious collaboration of SETRA, we were able to gather yearly traffic data on about 550 road sections that benefitted from an investment over a 16-year period (1992–2008), and a few rail sections. From these traffic series, we made a rough calculation to obtain yearly surplus series; we assumed that the surplus indexes are the product of the traffic evolution indexes and the value of time evolution (we assumed that value of time elasticity to
 $\mathbf{GDP}$
is 1.0). A calibration of each of these series against
 $\mathbf{GDP}$
was made. The relationship between the cost of construction and
 $\mathbf{GDP}$
was taken from Becker et al. (Reference Becker, Delache, Brunel, Sigaud, Sauvant and Quinet2013).
The general characteristics of the data and the results of the calibrations are described in Table 1.
Characteristics of the data (covering 554 sections of road and 16 years from 1992 to 2008).

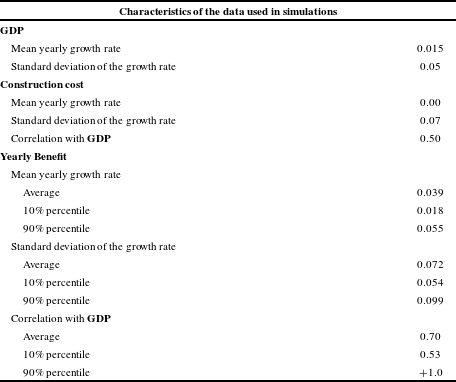
In addition, we choose values of
 $\unicode[STIX]{x1D6FF}=0$
(no impatience) and
 $\unicode[STIX]{x1D6FE}=3.5$
. These values are in the range of current values used in discounting theory. Inputting these values into the relationships giving the discount rates leads to a very low risk premium: the discount rate
 $r_{0}$
(whose definition is
 $r_{0}=\unicode[STIX]{x1D6FF}+\unicode[STIX]{x1D707}\unicode[STIX]{x1D6FE}-k$
) is 5.25%. The discount rate
 $r_{f}$
(whose definition is
 $r_{f}=r_{0}-\unicode[STIX]{x1D6FE}^{2}\unicode[STIX]{x1D70E}_{1}^{2}/2$
) is 5.24%, and the risk premium
 $\unicode[STIX]{x1D719}$
appearing in:
 $$\begin{eqnarray}r=r_{f}+\unicode[STIX]{x1D6FD}\unicode[STIX]{x1D719}\end{eqnarray}$$
is only 0.001%: this is quite low and the risk should be quite negligible. This is another version of the well-known equity premium puzzle already mentioned. There are two ways to overcome it. The first is to use random walks rather than the pure Wiener process; this way is appealing as it is clear that at least the
 $\mathbf{GDP}$
, and also many other series such as surpluses, do not follow this process; the frequency of catastrophic events is higher than in normal distributions. Another way is to stick to normal distributions and to use values different from those given by the historic analysis; this way has the advantage of continuing to use Brownian motion, which is much simpler to handle and often leads to closed formulas; this way is used in finance where, in Black–Scholes applications, the parameters employed are deduced from the equity price and not from the standard deviation of its motion.
In the following, we use this second direction, and use parameter values that provide sensible values for the risk premium. These sensible values cannot come from observation as, unlike finance markets where it is possible to observe equity dividends, it is not possible to observe surpluses. The expertise on the equity premium establishes that it is around 1–2% (see Quinet, Reference Quinet2013). Then we artificially increase the standard
 $\mathbf{GDP}$
deviation in order to obtain a risk premium of 1.75%. The following Table 2 provides the simulation parameters which are related to economic growth, construction costs, and benefits (the characteristics of benefits are different from those of traffic, as benefits are proportional to the product of traffic by
 $\mathbf{GDP}$
). These values lead to a risk premium of 1.7% and discount rates
 $r_{0}=0.0525$
(not changed) and
 $r_{f}=0.0372$
.
Characteristics of the parameters used in simulations.

3.2 Simulations for roads
3.2.1 Effect of benefits parameters
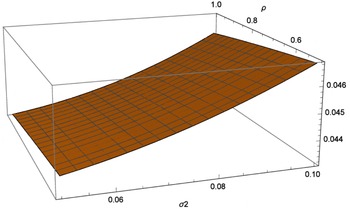
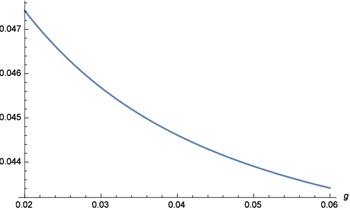
From this starting point, let us first explore how the minimal FYBCR depends on the parameters of the benefits, all other parameters being held at their central value as shown in Table 2. The following two graphs provide an answer. The first represents the dependence of minimal FYBCR on the standard deviation and the correlation of benefits with
 $\mathbf{GDP}$
, all other parameters being held at their central default values. The second represents the dependence of minimal FYBCR with the rate of growth of benefits, all other parameters being held at their central default values. To interpret these results, note that, when the growth rate of benefits is 3%, a figure close to the default growth rate of the present simulations, a 10% change in the minimal FYBCR corresponds, on average, to a change of 3 years to implement the investment. Bearing this in mind, it appears from Figure 2 that when the correlation coefficient varies along its full range of variation, the implementation year changes only by one unit at most (when the standard deviation of the benefits is high). Hence the systemic risk does not play an important role, a result at odds with the emphasis put on it in the literature.
The standard deviation of the benefit plays a more important role, but nevertheless rather a limited one: when it varies along its full range, the implementation is modified by a small number of years, generally less than 2.
Looking at Figure 3, which shows the variation of minimal FYBCR according to the growth rate of benefits, it is clear that the influence of this parameter has roughly the same magnitude as that of the standard deviation.
On the whole, the parameters of the project, in the range of their values for the sector under scrutiny, do not induce differences between each other. This conclusion also appears for some other sectors such as railway investments. If confirmed, it would mean that it is valid to determine the minimal FYBCR, not for each specific project, but by sector, within which the projects have similar costs and similar kinds of benefits.
3.2.2 Effect of construction cost parameters
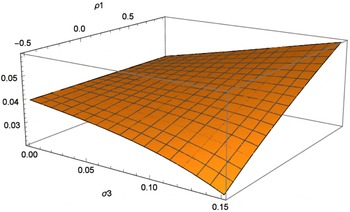
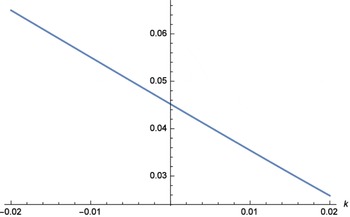
The data set contains just one time series on construction costs; this time series is the index of the price of public works in France; this index is known to be rather crude, especially given that, on one hand, it does not properly take into account the productivity increase over the years, and on the other hand, it replicates the common view that construction costs increase due to the increasing bargaining power of landowners (NIMBY syndrome); that is why it is interesting to check the sensitivity of the minimal FYBCR with the construction cost parameters. The following two figures provide information on this point. The first one (Figure 3) shows the dependence of minimal FYBCR on standard deviation and on the correlation between
 $\mathbf{GDP}$
and construction costs (the range has been chosen to replicate the range used for the parameters of benefits). The second figure (Figure 4) shows how the growth rate of construction costs impacts the minimal FYBCR. When comparing the construction cost parameters with the similar figures presented above for the sensitivity of minimal FYBCR to benefits, it appears clearly that they have a larger impact on minimal FYBCR than the benefit parameters, and especially on the growth rate of construction costs. This result points to the need for more studies on construction cost parameters, which are currently overlooked despite the fact that they can have a tremendous effect on the minimal FYBCR and thus on the implementation time.
3.2.3 Comparison with nonrandom criteria
It is also interesting to compare the minimal FYBCR given in the previous situations where benefits and costs follow a random walk to the criterion decision without randomness: what is the magnitude of the difference? Of course, this will depend on the size of the randomness. Let us take the average characteristics, given in Table 2, of the average random walks of benefits and construction costs in the case of roads, and let us compare the corresponding minimal FYBCR to the minimal FYBCR calculated when the corresponding random variables have null standard deviations. Table 3 presents the results. It appears that neglecting the randomness induces an error of about 20% on minimal FYBCR, which corresponds to about 6 years. Randomness cannot be neglected.
Comparison of minimal FYBCR with and without randomness in the case of roads (default characteristics drawn from Table 2).

3.3 Simulations for sectors other than roads
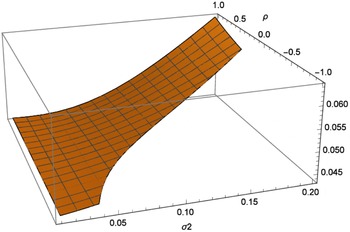
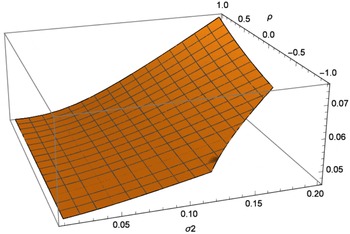
Up to now, we have explicitly only considered roads. As we have no data for other sectors, we will formulate a view of the possible differences with other sectors by enlarging the range of the variables relative to benefits. The following two figures provide the results. In both, the range of standard deviation and the correlation with
 $\mathbf{GDP}$
have been widely extended. In the first one (Figure 5) the rate of growth of the benefits is – relatively – high: 3% a year. In the second one (Figure 6) the rate of growth of the benefits is low (1% a year).
Dependence of minimal FYBCR with the standard deviation
 $\unicode[STIX]{x1D70E}_{2}$
and correlation with
 $\mathbf{GDP}\unicode[STIX]{x1D70C}$
of the benefits.

Dependence of minimal FYBCR with the rate of growth of the benefits.

Dependence of minimal FYBCR with the standard deviation
 $\unicode[STIX]{x1D70E}_{2}$
and correlation with
 $\mathbf{GDP}\unicode[STIX]{x1D70C}$
of the construction costs.

Dependence of minimal FYBCR with the rate of growth of the construction costs.

Dependence of minimal FYBCR with the characteristics of benefits; high rate of growth of benefits.

Dependence of minimal FYBCR with the characteristics of benefits; low rate of growth of the benefits.

The analysis of these two figures and their comparison with the previous ones (Figures 1 and 2) tend to suggest that the parameters of benefits become important through their effect on the minimal FYBCR only if the standard deviation of these benefits become very high and/or the correlation is very low. However, even in these cases, their influence is much lower than that of the construction costs. Another point which deserves more investigation is the fact that the set of admissible solutions excludes zones where standard deviation is high and correlation is low (negative), as it can be seen in the two Figures 5 and 6. In those forbidden zones, the parameter
 $\unicode[STIX]{x1D6FF}_{1}$
is negative and the mathematical solution is to infinitely delay the implementation as the
 $\mathbf{NPV}$
is infinitely increasing; this situation is of course impossible: if the benefits of an investment were infinite, they would cover the whole economy by themselves; this illustrates the fact that the growth at a constant rate is a nonrealistic assumption. This point encourages developing research on more realistic assumptions vis-à-vis the trends of the variables.
4 Conclusion
Investment decision rules in risk situations have been extensively analyzed for firms. Most research focuses on financial options and the range of methods based on dynamic programming; these methods are currently used by firms to decide on whether and when to implement an irreversible investment under uncertainty.
The situation is quite different for public investments, which are decided and largely funded by public authorities. These investments are assessed by public authorities, not through market criteria, but through public CBA procedures. Strangely enough, these procedures pay little attention to risk and uncertainty.
The present text aims at filling this gap. We address the classic problem of whether and when an investment should be implemented. This stopping time problem is established in a framework where the discount rate is typically linked to GDP, which follows a Brownian motion, and where benefits and the cost of implementation follow correlated Brownian motions.
Under such assumptions, it has been possible to establish decision rules based on a closed formula which expresses the value of the minimal FYBCR that triggers the implementation of the investment. This expression generalizes the standard rule that is well known in certain cases. Although it is not easy to determine the implications of the formula, which is rather complex, simulations based on sensible values of road sector parameters have shown various interesting results, which of course should be confirmed through other simulations.
-
∙ It appears that investments in the same sector differ only in the characteristics of the benefits: average growth rate, standard deviation, and correlation with
$\mathbf{GDP}$
. It appears that the minimal FYBCR is almost independent from the growth rate of benefits; that it depends to a very limited extent on the correlation coefficient between benefit and
$\mathbf{GDP}$
, showing that the so-called “systemic risk” plays a very limited role; and that it varies little from the standard deviation of the benefits. -
∙ The characteristics of the construction cost (rate of growth, standard deviation and correlation with
$\mathbf{GDP}$
) play a more important role, especially the rate of growth. This result casts light on variables to which little attention has been paid. -
∙ The formula of minimal FYBCR is valid only under a condition, which is the random situation pendant of the condition found in the case of certainty that the growth rate is lower than the discount rate. From this condition, the result is that risk narrows the set of implementable projects; in other words, some projects which should be implemented in a situation of uncertainty should not be in the presence of risk. Of course, this condition is due to the fact that growth rates are assumed to be constant, an assumption which is clearly unrealistic. More research on this point is required.


These results need to be confirmed and extended through further research in several directions, for instance:
-
∙ First, to enlarge the scope of stochastic motions. Studies on the discount rate (Barro, Weitzman, Gollier, Groom) use much more sophisticated motions than the pure Brownian motion, which is very crude, both regarding the stochastic term (no hysteresis, no memory, no jump) and the trend term: a constant growth rate is especially unrealistic in our period of transitions, both from a technical, economic, demographic, and sociological point of view; unfortunately no closed result can be found and numerical simulations are necessary to explore those situations.
-
∙ Second, to study other decision situations than just whether and when to carry out a project, for instance to study situations involving several technical variants and several linked projects.
-
∙ Third, to study the situation where the implementation does not take place all at once, but gradually over time.