Implications
Analyses of genetic trends help breeders to evaluate efficiency of their activities. Important components in driving the genetic progress are selection and import from other breeding programmes. Evaluating the value of imported germplasm and its contribution to the overall genetic trend is therefore important. This study conducts such analysis with the aim to evaluate the contribution of domestic and imported germplasm to genetic improvement in two pig populations. The results show significant genetic gain due to import in one population and no genetic gain in another population suggesting that both selection and sources of imported germplasm need to be re-evaluated.
Introduction
Genetic improvement of livestock is primarily based on identification of animals with superior genetic value in a population and their use as parents of next generation. In many pig breeding programmes, the standard pedigree-based evaluation, that is, pedigree BLUP (Henderson, Reference Henderson1973 and Reference Henderson1984), is still the method used for estimation of genetic merit of animals. In addition to domestic selection, many pig breeding programmes rely on gene flow from other breeding programmes via import of semen and sometimes animals. The pig breeding programme in Croatia is an example of such a programme, which aimed to improve pig production performance as quickly as possible to catch up other breeding programmes after a period of stagnation caused by political and social changes in the country. To this end significant import of foreign germplasm was carried out on a regular basis in certain period. Significant gene flow and reliance on the import pose questions about the effectiveness of domestic breeding activities and the quality of imported germplasm. These processes should be continually evaluated to assure breeding programmes are achieving the set objectives, especially in small scale and dispersed breeding programmes such as the one in Croatia.
However, analysis of the value of domestic and imported germplasm is not trivial, because foreign data is often not available in sufficient amounts or easy to integrate into domestic evaluations, although methodology for such integrations exists (e.g., Vandenplas and Gengler, Reference Vandenplas and Gengler2012). To estimate the average genetic merit of imported groups of animals the standard pedigree-based genetic evaluations can be extended with the so called genetic groups, which are commonly used to account for differences in mean between animals of different origin (Quaas and Pollak, Reference Quaas and Pollak1981; Quaas, Reference Quaas1988; Westell et al., Reference Westell, Quaas and van Vleck1988). Modelling differences in mean genetic merit between groups of animals also improves modelling of breeding values of their descendants (Quaas and Pollak, Reference Quaas and Pollak1981; Quaas, Reference Quaas1988; Westell et al., Reference Westell, Quaas and van Vleck1988), though it can also lead to the overestimation of the true genetic trend depending on the type of a breeding programme (Phocas and Laloe, Reference Phocas and Laloe2004). In pig populations with considerable reliance on import Peškovičová et al. (Reference Peškovičová, Groeneveld and Wolf2004) concluded that ignoring genetic groups in genetic evaluation leads to substantially reduced selection efficiency even after several generations of import.
While genetic groups allow for estimating the mean genetic merit of different germplasms, it does not provide means to monitor their use in domestic populations over generations to continuously evaluate efficacy of breeding activities. Such an analysis is possible with the method proposed by Garcia-Cortés et al. (Reference García-Cortés, Martinez-Ávila and Toro2008), who showed how to analyse the impact of domestic breeding activities by partitioning genetic trends according to these activities. This method has also been shown to be useful for partitioning international and national genetic trends by origin of germplasm in dairy cattle and the results of its application showed illuminating results on the contribution of domestic and imported germplasm on the overall genetic trends (Gorjanc et al., Reference Gorjanc, Potočnik, García-Cortés, Jakobsen and Dürr2011 and Reference Gorjanc, Hely and Amer2012).
The aim of this work was to analyse genetic trends in Landrace and Large-White breeds in Croatia and to partition these trends by origin of germplasm to evaluate effectiveness of domestic breeding activities and quality of imported germplasm.
Material and methods
Phenotype data were available for 25 553 Landrace (L) and 10 432 Large-White (LW) field-tested young boars and gilts in the period from 2002 to 2012. The data encompassed records from four large-scale farms and a group of 72 family farms that all form the national pig breeding programme in Croatia. A pedigree was available with 33 549 L and 13 494 LW animals including information about the origin of animals before the herdbook registration. The traits analysed were backfat thickness (BF) measured in millimetres and time on test (TT) defined as a number of days in the field test, from birth to ~100 kg. TT was pre-adjusted to the average BW of population, which is 105 kg.
The BF and TT were analysed with a standard bivariate pedigree-based linear mixed model (1), where ( y i ) is the vector of observations for the ith trait, the fixed effects were herd-year-month of test and sex ( b i ) and random effects were common litter environment ( w i ) and additive genetic effect ( a i ) with the corresponding incidence matrices X i , Z w,i and Z a,i . The effect of BW was included as a covariate in the model for BF:
 $${\mib y}_{i} ={\mib X}_{i} {\mib b}_{i} {\plus}{\mib Z}_{{w,i}} {\mib w}_{i} {\plus}{\mib Z}_{{a,i}} {\mib a}_{i} {\plus}{\mib e}_{i} $$
The model assumptions were:
 $$\eqalignno{ & \left( {\matrix{ {\mib y} \cr {\mib e} \cr {\mib w} \cr {\mib a} \cr } } \right)\!\sim\! N\left( {\left[ {\matrix{ {\mib Xb} \cr 0 \cr 0 \cr {\mib Qg} \cr } } \right],\left[ {\matrix{ {\mib V} & {\mib R} & {{\mib Z}_{w} {\mib G}_{w} } & {{\mib Z}_{a} {\bi G}_{a} } \cr {\mib R} & {\mib R} & 0 & 0 \cr {{\mib G}_{w} {\mib Z}'_{w} } & 0 & {{\mib G}_{w} } & 0 \cr {{\mib G}_{a} {\bi Z}_{a} } & 0 & 0 & {{\mib G}_{a} } \cr } } \right]} \right) \cr & {\mib V}={\mib Z}_{w} {\mib G}_{w} {\mib Z}'_{w} {\plus}{\mib Z}_{a} {\mib G}_{a} {\mib Z}'_{a} {\plus}{\mib R} \cr & {\mib R}=\,\oplus\,_{{i=1}}^{n} {\mib R}_{0} \cr & {\mib G}_{w} ={\mib I}_{w} \,\otimes\,{\mib G}_{{w0}} \cr & {\mib G}_{a} ={\mib A}\,\otimes\,{\mib G}_{{a0}} $$
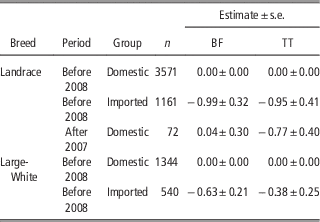
where Q is the incidence matrix relating all animals to respective genetic groups of unknown ancestors; g the vector of genetic group effects; A the additive numerator relationship matrix based on pedigree; R 0, G w0 and G a0 are, respectively, the 2×2 residual, common litter environment, and additive genetic covariance matrix between the traits; ⊗ and ⊕ are Kronecker product and direct sum. The genetic groups were defined for animals with unknown parents considering their origin (domestic v. imported) and the birth period. In total, three genetic groups were defined in L and two in LW breed by taking into account availability of pedigree information and a period with significant import activities in years before 2008 and after that year (Table 1). Models with and without genetic groups were fitted and estimated breeding values from each model were compared using Spearman and Pearson correlations.
Distribution of animals with unknown parents into genetic groups and their estimates expressed as a deviation from the group of domestic animals born before 2008

BF=backfat thickness; TT=time on test.
All model parameters were estimated with full Bayesian analysis using Markov chain Monte Carlo (MCMC) methods as implemented in the TM program (Leggara et al., Reference Legarra, Varona and Lopéz de Maturana2011). The number of MCMC samples drawn from posterior was 150 000 with first 20 000 discarded as burn-in and every 100th sample was saved for summarising posterior distributions of parameters with a mean and standard deviation (s.e.) or 95% interval. Full Bayesian analysis enabled straightforward inference of genetic trends including their partitions by origin following the method proposed by Garcia-Cortés et al. (Reference García-Cortés, Martinez-Ávila and Toro2008). Specifically, breeding values from each MCMC sample were partitioned by origin to evaluate the contribution of domestic selection and contribution of imported germplasm and finally summary (mean and 95% interval) of trends and partitions was obtained. Specifically, following the core equation of the pedigree model:
 $$a_{i} ={1 \over 2}a_{{s(i)}} {\plus}{1 \over 2}a_{{d(i)}} {\plus}w_{i} $$
where a i , a s(i) and a d(i) are, respectively, breeding values of individual animal and their parents, while w i is the individuals’ deviation from parent average, that is, the Mendelian sampling term. For base population animals a i =w i . For the whole population (3) can be written as
 $${\mib a}={\mib Tw}$$
where T describes the flow of genes through a pedigree (e.g., Henderson, Reference Henderson1976; Woolliams et al., Reference Woolliams, Bijma and Villanueva1999). Equation (4) shows that breeding values are a linear combination of Mendelian sampling terms of all animals, which implies that estimates of breeding values are also a linear combination of estimated Mendelian sampling terms
 $$\hat{{\mib a}}={\mib T}\hat{\mib w}$$
Following (5) and the fact that
 $\hat{w}=T^{{{\minus}1}} \hat{a}$
the vector of breeding values for whole population (4) can be partitioned into contributions due to domestic and imported germplasm
 $$\eqalignno{ \hat{\mib a} & ={\mib TP}_{{{\rm domestic}}} {\mib T}^{{{\minus}1}} \hat{\mib a}{\plus}{\mib TP}_{{{\rm imported}}} {\mib T}^{{{\minus}1}} \hat{\mib a} \cr & =\hat{\mib a}_{{{{{\rm domestic}}} }} {\plus}\hat{\mib a}_{{{{{\rm imported}}} }} $$
where
P
i
is a selector matrix used to allocate the Mendelian sampling terms of individuals born in origin i to the ith partition
 $${\hat{\mib a}}_{i} $$
. The computation of (6) involves computing the Mendelian sampling terms
 $(\hat{\mib w}={\mib T}^{{{\minus}1}} \hat{\mib a})$
and dropping them through a pedigree according to origin to account for the origin of inherited germplasm, but also for the breeding efforts, that is, phenotyping, to evaluate the value germplasm over generations (Gorjanc et al., Reference Gorjanc, Potočnik, García-Cortés, Jakobsen and Dürr2011). From (6) total and partitioned genetic trends were obtained and summarised. Estimates of genetic groups, breeding values and therefore also genetic trends were expressed in units of estimated additive genetic variance specific for each trait and breed to facilitate comparisons. Genetic trends were summarised and presented for the period with available phenotype data, that is, between years 2002 and 2012, with the mean in year 2002 set to zero. Finally, relative contribution of each origin to the total genetic trend was evaluated at the end of the period (year 2012) by summarising the MCMC samples for partitions divided by the MCMC samples of the total genetic trend.
Results and discussion
Genetic groups
Estimates of genetic groups indicated difference between the domestic and imported animals (Table 1). Genetic group representing the mean genetic merit of imported L animals born before 2008 was on average smaller (better) for nearly one unit of additive genetic variance (−0.99±0.32 for BF and −0.95±0.41 for TT) than for the domestic animals born in same period. Genetic group representing the mean of domestic L animals born after 2007 did not differ from those born before 2008 for BF (0.04±0.30), but it differed for TT (−0.77±0.40). Difference between genetic groups for the imported and domestic animals in LW breed was smaller and significant for BF (−0.63±0.21), but not for TT (−0.38±0.25). These estimates clearly show substantial difference in genetic merit of the imported and domestic animals suggesting that the import sources were well chosen, in particular for L breed, but less so for LW breed.
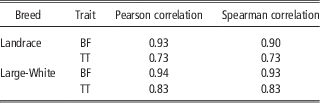
Inclusion of genetic groups in the model did not alter estimates of variance significantly as posterior distributions overlapped to a great extent (Supplementary Table S1). Additive genetic variance decreased slightly, but not significantly, with inclusion of genetic groups. Similar results were observed by Wolf and Wolfová (Reference Wolf and Wolfová2012). This reduction can be expected as a part of variation between individuals is explained by the difference between the genetic groups (Pieramati and Van Vleck, Reference Pieramati and Van Vleck1993). On the contrary, correlations between estimated breeding values from models with or without genetic groups indicated changes in estimated breeding values when genetic groups were included in the model (Table 2). While correlations were quite high for BF in both breeds (above 0.9), they were surprisingly low for TT in both breeds (0.73 in L and 0.83 in LW). These correlations indicate substantial changes in individual estimates of breeding values, particularly for TT, which lead to suboptimal ranking of selection candidates and reduced efficacy of selection. The substantial amount of import in the analysed population at different points in time and significant differences between genetic groups suggest that the model with genetic groups is more appropriate for the estimation of breeding values in this population, which is in line with previous work of Van Vleck (Reference Van Vleck1990) and Peškovičová et al. (Reference Peškovičová, Groeneveld and Wolf2004).
Pearson and Spearman correlations between estimated breeding values from a model with and without genetic groups

BF=backfat thickness; TT=time on test.
Genetic trends
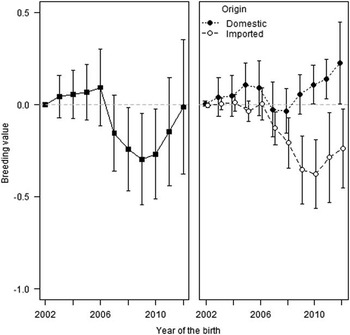
Overall genetic trends for BF and TT in L breed were negative (the desired direction for both BF and TT) and significantly different from zero by the end of analysed period (Figures 1 and 2). In contrast, the overall genetic trend for BF and TT in LW was not significantly different from zero by the end of analysed period (Figures 3 and 4). These results indicate that genetic improvement was successful in L breed, but not in LW breed. The trends in LW breed were in the desired direction, but not significant. In addition, uncertainty of the estimated trend in LW breed was much larger in L breed, which can be attributed to half smaller number of phenotyped animals in LW breed. Genetic trends from the model without genetic groups were in close agreement with genetic trends from the model with genetic groups (Supplementary Figures S1 to S4), but with less uncertainty due to smaller number of parameters that had to be estimated. Closer inspection of the overall genetic trends for both traits and breeds shows the most rapid change in trends after year 2006, which can be linked to the period of introducing BLUP in pig breeding in Croatia (Vincek et al., Reference Vincek, Gorjanc, Luković, Malovrh, Poljak and Kovač2003).
Overall genetic trend (left) and partitions by origin (right) for backfat thickness in Landrace breed (mean and 95% interval).

Overall genetic trend (left) and partitions by origin (right) for time of test in Landrace breed (mean and 95% interval).

Overall genetic trend (left) and partitions by origin (right) for backfat thickness in Large-White breed (mean and 95% interval).

Overall genetic trend (left) and partitions by origin (right) for time on test in Large-White breed (mean and 95% interval).

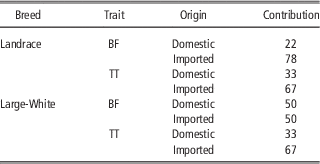
The comparison of partitions of the overall genetic trend by origin (domestic v. imported) showed significant differences for BF in L breed from the start of analysed period (Figure 1) and for BF in LW breed in the last part of analysed period (Figure 3). In contrast, both domestic and imported germplasm contributed significantly to achieved gain for TT in L breed (Figure 2), while differences between partitions were not overall significant for TT in LW breed though there is some indication that trend for the imported germplasm was always lower (better) (Figure 4). Analysis of relative contributions showed that by the end of analysed period imported germplasm contributed 78% and 66% to the overall genetic trend for BF and TT in L breed, respectively (Table 3). Relative contributions to the overall genetic trend in LW breed were 50% and 67% for BF and TT, respectively. These results indicate that imported germplasm had a strong impact on the overall genetic trend for BF and TT in both breeds, though results are much clearer in L breed. That imported germplasm had strong impact is expected as there was a substantial gene flow from foreign countries in the Croatian pig breeding programme. Presented results show that the main contribution to genetic improvement of BF in both breeds and for TT in L breed was due to utilisation of imported germplasm. These results show that decision to import germplasm from other populations was justified; especially for L breed, while better source of germplasm was needed for LW breed.
Relative contributions (%) to genetic trend by origin in the final year

BF=backfat thickness; TT=time on test.
Overall genetic improvement was successful in L breed, but not in LW breed, which suggests that breeding activities and import source in LW breed should be re-evaluated. Further partitions of genetic trends can be used to pinpoint, which breeding activities need most attention, for example, selection of sires or dams as originally suggested by Garcia-Cortés et al. (Reference García-Cortés, Martinez-Ávila and Toro2008) or contribution of different breeders and insemination centres. In addition, additional information about country or breeding programme of origin could be used to further dissect genetic trends and evaluate impact of each origin on the overall genetic trend. However, too fine-grained partitions are likely to have very uncertain estimates due to lack of information per each partition. In summary, partitioning of genetic trends by origin enables simple and quick evaluation of breeding activities and can be a useful tool for breeders to improve their programmes.
Supplementary Material
For supplementary material/s referred to in this article, please visit http://dx.doi.org/10.1017/S1751731115001056