Introduction
Autism spectrum disorder (ASD) is one of the most prevalent neurodevelopmental disorders characterized by deficits in social communication and restricted and repetitive patterns of behavior and interests (Baio et al., Reference Baio, Wiggins, Christensen, Maenner, Daniels, Warren and Dowling2018; Doernberg & Hollander, Reference Doernberg and Hollander2016). The ASD symptom complex emerges gradually, reflecting an increasingly multidimensional disruption in neurodevelopment over a dynamic and robust period of brain and behavior development encompassing the first two to three years of life (Knickmeyer et al., Reference Knickmeyer, Gouttard, Kang, Evans, Wilber, Smith and Gilmore2008; Yin et al., Reference Yin, Chen, Hung, Baluyot, Li and Lin2019). Considerable heterogeneity characterizes the ASD phenotype (Happé, Ronald, & Plomin, Reference Happé, Ronald and Plomin2006), even in identical twins where heritability is high (Hallmayer et al., Reference Hallmayer, Cleveland, Torres, Phillips, Cohen, Torigoe and Risch2011; Kates et al., Reference Kates, Burnette, Eliez, Strunge, Kaplan, Landa and Pearlson2004). In turn, it comes as no surprise that there is heterogeneity in the pathways to an ASD diagnosis (Constantino & Charman, Reference Constantino and Charman2016; Kim et al., Reference Kim, Bal, Benrey, Choi, Guthrie, Colombi and Lord2018), with no single behavioral profile in infancy being predictive of later ASD diagnosis (Szatmari et al., Reference Szatmari, Chawarska, Dawson, Georgiades, Landa, Lord and Halladay2016; Zwaigenbaum & Penner, Reference Zwaigenbaum and Penner2018). Research is needed to identify, at an early age, behavioral profiles associated with vulnerability and resiliency to later ASD diagnosis. Such data could inform early detection and screening recommendations, identification of novel treatment targets, and designs of pre-emptive interventions for children with ASD as well as those children with delays not meeting full criteria for ASD.
Prospective longitudinal research with younger siblings of children with ASD (hereafter high-familial risk (HR) siblings) affords the opportunity to employ a developmental, dimensional, data-driven approach to elucidate ASD-related developmental profiles early in life, and to examine how early profiles relate to later categorical clinical diagnostic classification. HR siblings, like their older siblings with a diagnosis of ASD, also exhibit significant heterogeneity in behavioral presentation, range of developmental trajectories (Bussu et al., Reference Bussu, Jones, Charman, Johnson and Buitelaar2019; Landa, Gross, Stuart, & Bauman, Reference Landa, Gross, Stuart and Bauman2012; Landa, Gross, Stuart, & Faherty, Reference Landa, Gross, Stuart and Faherty2013; Landa, Holman, & Garrett-Mayer, Reference Landa, Holman and Garrett-Mayer2007; Ozonoff et al., Reference Ozonoff, Iosif, Baguio, Cook, Hill, Hutman and Young2010), and outcomes (Landa & Garrett-Mayer, Reference Landa and Garrett-Mayer2006; Landa et al., Reference Landa, Holman and Garrett-Mayer2007). Specifically, 20% of HR infants will develop ASD (Landa et al., Reference Landa, Holman and Garrett-Mayer2007; Ozonoff et al., Reference Ozonoff, Young, Carter, Messinger, Yirmiya, Zwaigenbaum and Stone2011), and another 30% will exhibit milder delays in social and/or language development without fully meeting diagnostic criteria for ASD (Charman et al., Reference Charman, Young, Brian, Carter, Carver, Chawarska and Zwaigenbaum2017; Landa & Garrett-Mayer, Reference Landa and Garrett-Mayer2006; Messinger et al., Reference Messinger, Young, Ozonoff, Dobkins, Carter, Zwaigenbaum and Sigman2013).
Identifying which HR siblings will develop ASD is not yet possible during early infancy. Early in the second year of life, identifying ASD is only possible for a small proportion of HR siblings (Landa et al., Reference Landa, Gross, Stuart and Bauman2012) and very little is known about which HR siblings likely will be resilient to developing ASD. In an earlier study, we employed a developmental, dimensional, data-driven approach to delineate different developmental trajectories from ages six to 36 months in HR siblings (Landa et al., Reference Landa, Gross, Stuart and Bauman2012). Specifically, a latent class growth curve analysis was conducted, focusing simultaneously on language, cognitive, and motor dimensions of development (Landa et al., Reference Landa, Gross, Stuart and Bauman2012). Four trajectory classes were identified: accelerated rate of development (25.7% of the sample) representing developmental optimality; normative and stable rate of development with above-average nonverbal cognitive outcome (40% of the sample); development characterized by receptive language and motor delays (22.3% of the sample); and development characterized by multidimensional delay with declining rate of development (12% of the sample). Children whose ASD was identified early (age 14 months) were approximately evenly distributed across the latter three classes. Those whose ASD was identified after age 14 months were most densely represented (55%) in the declining trajectory class. The results of this study indicate that children having an accelerated rate of motor, cognitive, and language development from 6 to 36 months of age are resilient to the development of ASD. Further research is needed to understand early behavioral profiles that will inform the developmental dynamics underlying behavioral vulnerability and resilience to later ASD diagnosis. Here, we define resilience as a process that likely exists along a continuum (Pietrzak & Southwick, Reference Pietrzak and Southwick2011).
A key time in development to investigate behavioral profiles associated with vulnerability and resiliency to later ASD is the chronological juncture between the ASD prodromal phase in infancy and the symptom emergence phase in the second year of life. During the ASD prodromal period, subtle differences in development are observable in HR compared to infants at low familial risk (LR) for ASD. HR infants lag behind LR infants in motor development and object manipulation (Bhat, Galloway, & Landa, Reference Bhat, Galloway and Landa2012; Flanagan, Landa, Bhat, & Bauman, Reference Flanagan, Landa, Bhat and Bauman2012; Iverson et al., Reference Iverson, Shic, Wall, Chawarska, Curtin, Estes and Young2019; Libertus, Sheperd, Ross, & Landa, Reference Libertus, Sheperd, Ross and Landa2014), and in attention and social functions (Bhat, Galloway, & Landa, Reference Bhat, Galloway and Landa2010; Elison et al., Reference Elison, Paterson, Wolff, Reznick, Sasson and Gu2013; Elsabbagh et al., Reference Elsabbagh, Fernandes, Webb, Dawson, Charman and Johnson2013; Shic, Macari, & Chawarska, Reference Shic, Macari and Chawarska2014). These early distinguishing developmental features in HR siblings do not map neatly onto categorical outcomes of ASD versus non-ASD three years later. Yet their importance becomes clearer when brain development phenomena are taken into consideration. From late infancy through the second year of life in neurotypical development, core brain regions associated with visual, motor, language, and higher cognitive domains become increasingly well defined (Yin et al., Reference Yin, Chen, Hung, Baluyot, Li and Lin2019) and integrated across domains (Fair et al., Reference Fair, Cohen, Power, Dosenbach, Church, Miezin and Petersen2009). In HR siblings, prospective studies have identified structural and functional differences in brain development as early as the neonatal period compared to LR controls (Ciarrusta et al., Reference Ciarrusta, O'Muircheartaigh, Dimitrova, Batalle, Cordero-Grande, Price and McAlonan2019), as well as from age 6 through 24 months in HR siblings meeting criteria for ASD compared to those who do not (Girault & Piven, Reference Girault and Piven2020). These neural deviations observed in infant HR siblings early in development are posited to influence later emerging behavioral atypicalities in language, social, and cognitive functioning, regardless of whether ASD is identified later (Hazlett et al., Reference Hazlett, Gu, Munsell, Kim, Styner and Wolff2017). Defining the extent to which language, social, and play development matures and coheres from the infant prodromal period to the ASD-symptom emergent period (early in the second year of life) has the potential to inform early detection of vulnerability and resiliency to the ASD phenotype. Investigating this period prior to the consolidation of the ASD symptom complex into a clinically defined developmental disorder has substantial implications for timing, design, and targets of early intervention.
The early second year of life is of particular clinical importance with regard to ASD. By age 18 months, the ASD symptom complex usually has consolidated. Thus, ASD can be diagnosed at age 18 months, with considerable stability through age 36 months (Chawarska et al., Reference Chawarska, Shic, Macari, Campbell, Brian, Landa and Bryson2014). Eighteen months also marks the recommended start of formal ASD screening during pediatric well visits (American Psychiatric Association, 2013; Chawarska et al., Reference Chawarska, Shic, Macari, Campbell, Brian, Landa and Bryson2014). However, despite progress in screener development, ASD in children this young often is missed, possibly due to the subtlety of ASD symptoms and incomplete behavioral expression of the ASD symptom complex (Zwaigenbaum & Penner, Reference Zwaigenbaum and Penner2018). It is possible that multidimensional behavioral profiles may be identified prior to 18 months and could shed light on vulnerability or resiliency associated with later ASD diagnosis. Applying a data-driven, dimensional, developmental approach during this early developmental period is consistent with the developmental psychopathology framework (Sroufe & Rutter, Reference Sroufe and Rutter1984), and the National Institute of Mental Health (NIMH)'s Research Domain Criteria (RDoC) (Insel et al., Reference Insel, Cuthbert, Garvey, Heinssen, Pine, Quinn and Wang2010) initiative, where developmental divergence can be referenced against norms (Sroufe, Reference Sroufe1997) and insights into phenotypic variation can be obtained through examination of patterns emerging from developmental heterogeneity in the sample (Rutter & Sroufe, Reference Rutter and Sroufe2000).
In considering dimensions of development to examine early in the second year of life, the complex clinical phenotype of ASD can be deconstructed into components that are at once related to the diagnostic criteria for ASD (American Psychiatric Association, 2013), and also previously identified as distinguishing HR siblings from LR controls (reviewed below). These distinguishing features are distributed along a developmental continuum in one or more dimensions overlapping with normative development (Landa et al., Reference Landa, Gross, Stuart and Bauman2012, Reference Landa, Gross, Stuart and Faherty2013) thus obfuscating categorical classification as ASD versus non-ASD. The four dimensions examined in the present study include language, play, and social functioning as well as restricted and repetitive behaviors, aligned with RDoC cognitive systems (language, play), social processes, and sensorimotor systems (stereotypies). The well-characterized neurotypical developmental phenomena within these dimensions provide a benchmark for identifying phenotypic profiles in toddlers and identifying deflection from typical development that reflect disrupted neurobiological processes underlying the pathogenesis of ASD.
Age 14 months may be an ideal point in development to examine these dimensions of development to define profiles of vulnerability and resilience associated with 36-month classification of ASD versus non-ASD in HR siblings. By age 14 months, neurotypical communication involves initiation and directing of bids to others for social (e.g., initiating joint attention, commenting) and regulatory (e.g., requesting help, requesting objects) communicative purposes using spoken language and gestural forms of communication (Hughes, Hogan, Roberts, & Klusek, Reference Hughes, Hogan, Roberts and Klusek2019; Landa et al., Reference Landa, Holman and Garrett-Mayer2007). Representational play with objects is emerging, with toy use beginning to mirror use of the objects they represent (putting a toy cup to the mouth as if to drink from it). Socially, triadic gaze (shifting gaze from an object/event to another person and back again) occurs with increasing regularity. Triadic gaze reflects children's ability to sustain coordinated joint engagement, oftentimes simultaneously displaying shared positive affect (Mundy, Reference Mundy2018). Reciprocity and synchronicity during dyadic (adult–child) play is well-established by age 14 months. These communication, play, and social accomplishments demonstrate the cohering of development and integration of multiple developmental systems, reflecting underlying functional specialization (Yin et al., Reference Yin, Chen, Hung, Baluyot, Li and Lin2019) and inter-connection of networks in the brain (Fair et al., Reference Fair, Cohen, Power, Dosenbach, Church, Miezin and Petersen2009).
Against the backdrop of the developmental advances described above that are occurring in neurotypical development early in the second year of life, development in many HR siblings is lagging. In about half of the toddlers who will have confirmed ASD diagnosis at age 36 months, the full ASD symptom complex can be observed at age 14 months; the other half exhibit divergence from the norm in language and/or social domains but clinical thresholds for delays are not always met (Landa & Garrett-Mayer, Reference Landa and Garrett-Mayer2006; Landa et al., Reference Landa, Holman and Garrett-Mayer2007, Reference Landa, Gross, Stuart and Bauman2012, Reference Landa, Gross, Stuart and Faherty2013). Even HR siblings who do not later develop ASD may exhibit subclinical ASD symptomatology by 12 months of age. In a study of 12-month-old HR siblings who remained ASD-negative (ASD−) at age 36 months, Georgiades et al. (Reference Georgiades, Szatmari, Zwaigenbaum, Bryson, Brian, Roberts and Garon2013) conducted a cluster analysis using a single variable: the total score from the Autism Observation Scale for Infants (AOSI; Bryson, Zwaigenbaum, McDermott, Rombough, & Brian, Reference Bryson, Zwaigenbaum, McDermott, Rombough and Brian2008). Results revealed two clusters, one of which (14% of the sample) exhibited significantly more ASD traits than the other. At age 36 months, children in that small ASD trait-laden cluster exhibited significantly higher rates of social communication impairment, lower cognitive functioning, and more internalizing problems than children in the larger unaffected cluster, but there was no difference between clusters in 36-month Calibrated Severity Score (Shumway et al., Reference Shumway, Farmer, Thurm, Joseph, Black and Golden2012) from the Autism Diagnostic Observation Schedule (Georgiades et al., Reference Georgiades, Szatmari, Zwaigenbaum, Bryson, Brian, Roberts and Garon2013; Lord, Rutter, DiLavore, & Risi, Reference Lord, Rutter, DiLavore and Risi1999). Other prospective studies of 12- to 14-month-olds have identified developmental lags in HR siblings in comparison to LR children in language (Landa & Garrett-Mayer, Reference Landa and Garrett-Mayer2006; Landa et al., Reference Landa, Holman and Garrett-Mayer2007, Reference Landa, Gross, Stuart and Bauman2012), gesture inventory (Landa et al., Reference Landa, Holman and Garrett-Mayer2007, Reference Landa, Gross, Stuart and Faherty2013), frequency of gesture production for social communication purposes (Hughes et al., Reference Hughes, Hogan, Roberts and Klusek2019), frequency and consistency of initiating and responding to joint-attention (Landa et al., Reference Landa, Gross, Stuart and Faherty2013; Sullivan et al., Reference Sullivan, Finelli, Marvin, Garrett-Mayer, Bauman and Landa2007), frequency of self-generated shared positive affect, and diversity of play behaviors (Landa et al., Reference Landa, Holman and Garrett-Mayer2007). With regard to positive symptoms, a continuum of restricted and repetitive behaviors at this age is observable, occurring with the greatest frequency in HR siblings later meeting ASD criteria and, compared to LR controls, at an intermediate level in HR siblings who remain ASD− at age 24 months (Elison et al., Reference Elison, Wolff, Reznick, Botteron, Estes, Gu and Piven2014; Wolff et al., Reference Wolff, Botteron, Dager, Elison, Estes and Gu2014). Taken together, these prospective longitudinal studies of HR siblings highlight the developmental diversity within HR siblings as a group, and indicate that the emergence of the ASD phenotype reflects a disrupted process of development.
To our knowledge, no studies yet have used a data-driven approach to examine the implications for ASD-related vulnerability and resiliency of social, communication, and play development along with degree of restricted and repetitive behaviors, simultaneously, early in the second year of life. Because rate of brain and, hence, behavior development within and across such developmental domains is variable in children (Yin et al., Reference Yin, Chen, Hung, Baluyot, Li and Lin2019), regardless of familial risk for ASD, a data-driven approach to examining early developmental behavioral profiles could parse heterogeneity into subgroups of toddlers reflecting degree of developmental coherence within and across the domains examined herein. Implications for clinical decision-making and research direction could be substantial.
In the current study, we sought to identify early behavioral profiles indicative of vulnerability and resiliency to later manifestation of the ASD symptom complex. From a developmental psychopathology standpoint, an improved understanding of both typical and atypical developmental trajectories is mutually informative and has the potential to provide important insight into early influences and pathways to and away from pathology (Ciarrusta et al., Reference Ciarrusta, O'Muircheartaigh, Dimitrova, Batalle, Cordero-Grande, Price and McAlonan2019; Sroufe, Reference Sroufe1997). Here, we first focused on a single point in time: 14 months, the juncture between ASD prodromal and symptom-emergence periods, occurring early in the second year of life, well before the diagnosis of ASD is typically made (Baio et al., Reference Baio, Wiggins, Christensen, Maenner, Daniels, Warren and Dowling2018). We further examined the extent to which developmental profiles early in life relate to categorical ASD or non-ASD classification two years later, at which time the diagnosis of ASD is quite stable (Chawarska, Klin, Paul, & Volkmar, Reference Chawarska, Klin, Paul and Volkmar2007; Kim, Macari, Koller, & Chawarska, Reference Kim, Macari, Koller and Chawarska2016), and whether trajectories of ASD symptom severity from age 14 months to about age 36 months differed for children across clusters who had outcome diagnostic classification of ASD versus non-ASD.
Method
Participants
Participants were recruited for a prospective, longitudinal study of ASD. This study was approved by the Johns Hopkins Medicine Institutional Review Board. Families signed written informed consent for their participation and their children's participation in the study.
Four hundred twenty children participated in the current study, including 322 younger siblings of a proband with ASD (HR) and 98 children at low familial risk for ASD (LR). Participant characteristics are reported in Table 1. Details about ascertainment and proband ASD diagnosis are described in Landa et al. (Reference Landa, Holman and Garrett-Mayer2007). Exclusion criteria were as follows: non-primary English language speakers (language measures are normed on English speakers), birth weight <1,500 grams, severe birth trauma, severe birth defects, head injury, and prenatal illicit drug or alcohol exposure.
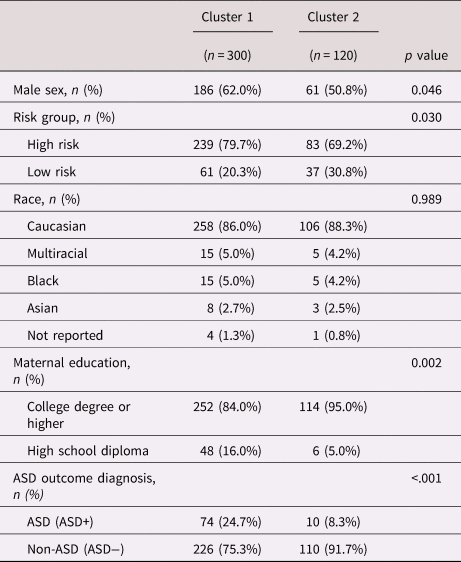
Participant characteristics by cluster.

Note. ASD+ = Outcome diagnosis of ASD at 36 months; ASD− = Outcome diagnosis of non-ASD at 36 months.
aChi-squared test results for cluster group differences for sex, risk group, race, maternal education, and ASD outcome diagnosis.
Participants were drawn from a larger prospective longitudinal study of infant siblings of children with ASD and LR controls beginning in infancy. Children were included in the current study if they completed the 14-month assessment (Mage = 14.53 months, SDage = .74 months) and the outcome assessment targeted for age 36 months (Mage = 36.37 months, SDage = 2.95 months). At the 14-month assessment, clinical judgment of ASD status (ASD+/−) was made by an expert clinical researcher conducting the child's assessment based on ADOS classification, the child's assessment data (including parent report forms), and the child's behavior during the evaluation session. Confirmatory diagnostic outcome classification of ASD+/− was made at the outcome evaluation for all participants (see below).
Measures and procedure
Mullen scales of early learning (MSEL; Mullen, Reference Mullen1995)
The MSEL is a standardized, norm-referenced developmental test for ages birth to 68 months. Four subscales were administered to assess children's development: fine motor, receptive language, expressive language, and visual reception, which measures nonverbal cognitive skills including visual processing, visual spatial, memory, and problem-solving skills (Stone, McMahon, Yoder, & Walden, Reference Stone, McMahon, Yoder and Walden2007). Raw scores convert to standardized T scores (M = 50, SD = 10), which served as dependent variables in the present study.
Communication and Symbolic Behavior Scales Developmental Profile Caregiver Questionnaire (CSBS CQ; Wetherby & Prizant, Reference Wetherby and Prizant2002)
The CSBS CQ is a standardized caregiver questionnaire that measures communicative, social-affective, and symbolic abilities and is normed for children ages 6–24 months. The CSBS CQ comprises seven scales that capture critical prelinguistic skills in early development. The scores derived from these scales are summed to create three composite scores. Specifically, the social composite comprises three scales that capture early social and affective development in infants and toddlers (Wetherby & Prizant, Reference Wetherby and Prizant2002): emotion and eye gaze, communication (rate and communicative function), and gestures. The speech composite consists of two behavior scales documenting diversity of children's communicative use of sounds and words. The symbolic composite consists of two behavior scales: Understanding (of language and gestures) and object use (symbolic and constructive play). The composite scores (social, speech, and symbolic) and their respective scales are reported as standard scores (M = 10, SD = 3) in which higher scores reflect more frequent and diverse communicative and symbolic behaviors. The CSBS CQ scores are highly correlated with parallel scores from the examiner-administered CSBS behavior sample (Wetherby, Allen, Cleary, Kublin, & Goldstein, Reference Wetherby, Allen, Cleary, Kublin and Goldstein2002).
Autism diagnostic observation schedule (ADOS-G: Lord et al., Reference Lord, Rutter, DiLavore and Risi1999; ADOS-2: Lord et al., Reference Lord, Rutter, DiLavore, Risi, Gotham and Bishop2012)
The ADOS is a standardized, semi-structured, play-based clinician-administered measure designed to assess ASD symptomatology related to communication, social interaction, play and restricted, repetitive behaviors (Lord et al., Reference Lord, Rutter, DiLavore, Risi, Gotham and Bishop2002). The ADOS consists of different modules, with module selection based on chronological age and language ability at time of testing. In the current study, the ADOS was administered by research-reliable staff in the first author's laboratory as part of a clinical research assessment. During the 14-month assessment, children completed the ADOS-2 Toddler Module or ADOS Module 1 (minimal to no language) depending on when they entered the study (before or after publication of the ADOS-2). At the outcome assessment, children completed the ADOS-G or ADOS-2 Module 1 or 2 (non-echoed phrase speech). Of interest in the current study, both ADOS versions yield a section total score that captures presence of restricted and repetitive behaviors (i.e., ADOS-G: Stereotyped Behaviors and Restricted Interests; ADOS-2: Restricted and Repetitive Behavior). Across all modules, an ADOS calibrated severity score (CSS; score 1 to 10) may be derived which reflects the relative severity of autism-specific symptoms and allows comparisons of the same child over time and comparisons across modules. The Toddler Module CSS score reported in the current study was calculated based on Esler et al. (Reference Esler, Bal, Guthrie, Wetherby, Weismer and Lord2015). Higher ADOS and CSS scores reflect greater ASD symptom severity.
Since joint attention limitations are often observed in young children with ASD (Mundy, Sigman, & Kasari, Reference Mundy, Sigman and Kasari1994) and joint attention skills strongly predict early language development (Baldwin, Reference Baldwin, Moore and Dunham1995) and later pragmatic communication skills (Greenslade, Utter, & Landa, Reference Greenslade, Utter and Landa2019), we examined 14-month initiation of joint attention (IJA) behavior in post hoc analyses. In preparation for such analyses, a composite variable was created for IJA using the sum of 14-month ADOS ratings from three items: Initiation of Joint Attention, Showing, and Giving. Because there are differences across the ADOS Toddler Module and Module 1 in range of possible ratings for these items and in the operational definitions of those ratings, recoding of items was necessary to align item ratings across modules. For the Initiation of Joint Attention and Showing items, we recoded such that ratings of 0 = 0 and ratings of 1, 2, and 3 were recoded to “2”. In terms of the Giving item, since the ratings were nearly identical across the modules we maintained 0 = 0, 1 = 1, and 2 = 2 for the Toddler Module and Module 1, but recoded Module 2 ratings of 3 to 2 (there is no rating of “3” on Module 1).
Outcome diagnostic classification
Confirmatory outcome classification was made by a research-reliable, clinical research examiner with a master's or doctoral degree and expertise in early diagnosis of ASD. A classification of ASD was made if the child was clinically judged to have ASD and met the Diagnostic and Statistical Manual of Mental Disorders (DSM-IV and DSM-V; American Psychiatric Association, 2013) criteria for ASD. Outcome diagnostic classification for all children was targeted for age 36 months, occurring at 30 (n = 46) or 36 months (n = 372), with the exception of two participants who completed their final assessment at age 24 months. Forty-three toddlers in the entire sample met criteria for ASD at age 14 months (early onset). Eighty percent of these early-onset cases retained the diagnosis through the outcome assessment. Eighty-four children had confirmatory outcome diagnostic classification of ASD+; five of these children's scores fell just below ADOS criteria for ASD or autism but were deemed to have ASD based on the DSM and expert clinical judgement.
Statistical analysis
Clustering analysis
A data-driven, multidimensional cluster analysis (Aldenderfer & Blashfield, Reference Aldenderfer and Blashfield1984), was implemented to examine profiles of vulnerability and resiliency related to later ASD diagnosis. The hierarchical method of clustering was used. This statistical method creates clusters of individuals based on the pattern of their scores on measures assessing multiple dimensions of development (Bergman & Magnusson, Reference Bergman and Magnusson1997). This data-driven approach to clustering does not require a preset number of clusters and assigns children into clusters based on their responses across a range of variables rather than using scores arbitrarily to divide the sample, resulting in a cluster solution that is the best fit to the data. Ward 's (Reference Ward1963) method, one of the most commonly used forms of hierarchical clustering, is designed to optimize the minimum amount of variance within clusters, by combining those entities that have the smallest squared Euclidean distances between them (Borgen & Barnett, Reference Borgen and Barnett1987). In order to investigate the developmental coherence across multiple dimensions of development at age 14 months, the following four variables were entered into Ward 's (Reference Ward1963) method: examiner administered measures of (a) Expressive Language [MSEL Expressive Language (EL) T score], and (b) restricted and repetitive behaviors [ADOS Restricted and Repetitive Behavior section total score (RRB)], as well as caregiver-reported measures of (c) constructive and symbolic play (CSBS CQ Object Use) and (d) social development (CSBS CQ Social composite). Measures were standardized prior to conducting the analysis to control for unequal scaling. Next, three strategies were applied to determine the optimal number of clusters that should be retained: examination of a dendrogram (providing a visual representation of the clustering process), application of Mojena's Rule One (Mojena, Reference Mojena1977) (using the distribution of within-cluster variance to determine when a jump in coefficients between stages is larger than the acceptable alpha level), and consideration of the proportional increase in the fusion coefficients. Finally, bootstrap resampling with 100 iterations was conducted using the Jaccard coefficient as the similarity measure between the resulting cluster solutions (Hennig, Reference Hennig2007).
Cluster comparisons of descriptive and developmental characteristics
The cluster analysis method is not an inferential technique and does not provide information about the statistical difference between the resulting set of clusters. To understand the developmental characteristics defining the behavioral profiles represented by the clusters, a multivariate analysis of variance (MANOVA) was performed on the four dependent variables representing the developmental dimensions examined herein (expressive language, social, play, and restricted and repetitive behaviors), with the cluster groups as independent variables. Where appropriate, we conducted univariate post hoc analyses using the Student's t test, correcting for inflated Type I error, using the Bonferroni correction within STATA. When homogeneity of variance assumption was not met, the Welch's test for unequal variances was used to correct for this violation, adjusting for degrees of freedom (Ruxton, Reference Ruxton2006).
ASD symptom trajectories by cluster and ASD diagnostic outcome status
A linear mixed-effects regression model was implemented to examine the effects of cluster groupings and ASD diagnostic outcome on patterns of change in ASD symptoms (as reflected by ADOS CSS) from 14 months to the outcome assessment (assessment timepoint). Analyses were carried out in R, an open source programming language for statistical computing (R Core Team, 2017). We used the lme4 package (Bates, Mächler, Bolker, & Walker, Reference Bates, Mächler, Bolker and Walker2015) and computed p values using the Satterthwaite's approximation for denominator degrees of freedom with the lmerTest package (Kuznetsova, Brockhoff, & Christensen, Reference Kuznetsova, Brockhoff and Christensen2015). The model included three fixed-effect factors: cluster group, ASD diagnosis, and assessment timepoint as well as their interactions. A by-subject random intercept was used to account for inter-subject variability. To investigate post hoc comparisons, tests of further contrasts were conducted with correction for multiple comparisons of means (Tukey contrasts) using the multcomp package (Hothorn et al., Reference Hothorn, Bretz, Westfall, Heiberger, Schuetzenmeister, Scheibe and Hothorn2016).
Results
Cluster analysis results and interpretation
The results of the cluster analysis yielded a dendrogram indicating that a two- to three-cluster solution might be optimal. Using Mojena's Rule One (Mojena, Reference Mojena1977), fusion coefficients prior to Stage 2 were found to be beyond the acceptable alpha level. This finding indicated greater dissimilarity in the clusters than in previous stages, such that fewer than two clusters should not be retained. The proportional increase in the fusion coefficients suggested relatively insignificant jumps in coefficients from all prior stages until Stage 2. Finally, the bootstrapping resampling revealed stable Jaccard coefficients of greater than .70 for the two-cluster solution only. From these strategies, the two-cluster solution was deemed the most optimal fit to the data and was retained as the grouping variable for all subsequent analyses. Cluster 1 was the larger of the two clusters (n = 300; 71% of the sample), with a significantly greater proportion of males relative to Cluster 2 [Cluster 1 = 186 males (comprising 62% of the cluster); Cluster 2 = 61 males (comprising 50.8% of the cluster); χ 2 (1, N = 420), 3.96, p = .046]; significantly greater proportion of HR siblings [Cluster 1 = 239 HR siblings (comprising 79.6% of the cluster); Cluster 2 = 83 HR siblings (comprising 69.1% of the cluster); χ 2 (1, N = 420), 4.71, p = .030]; and significantly lower proportion of mothers with a college degree or higher [Cluster 1 = 252 mothers with a college degree or higher (comprising 84.0% of the cluster); Cluster 2 = 114 mothers with a college degree or higher (comprising 95.0% of the cluster); χ 2 (1, N = 420), 9.26, p = .002]. (see Table 1).
Developmental characteristics of the cluster groups
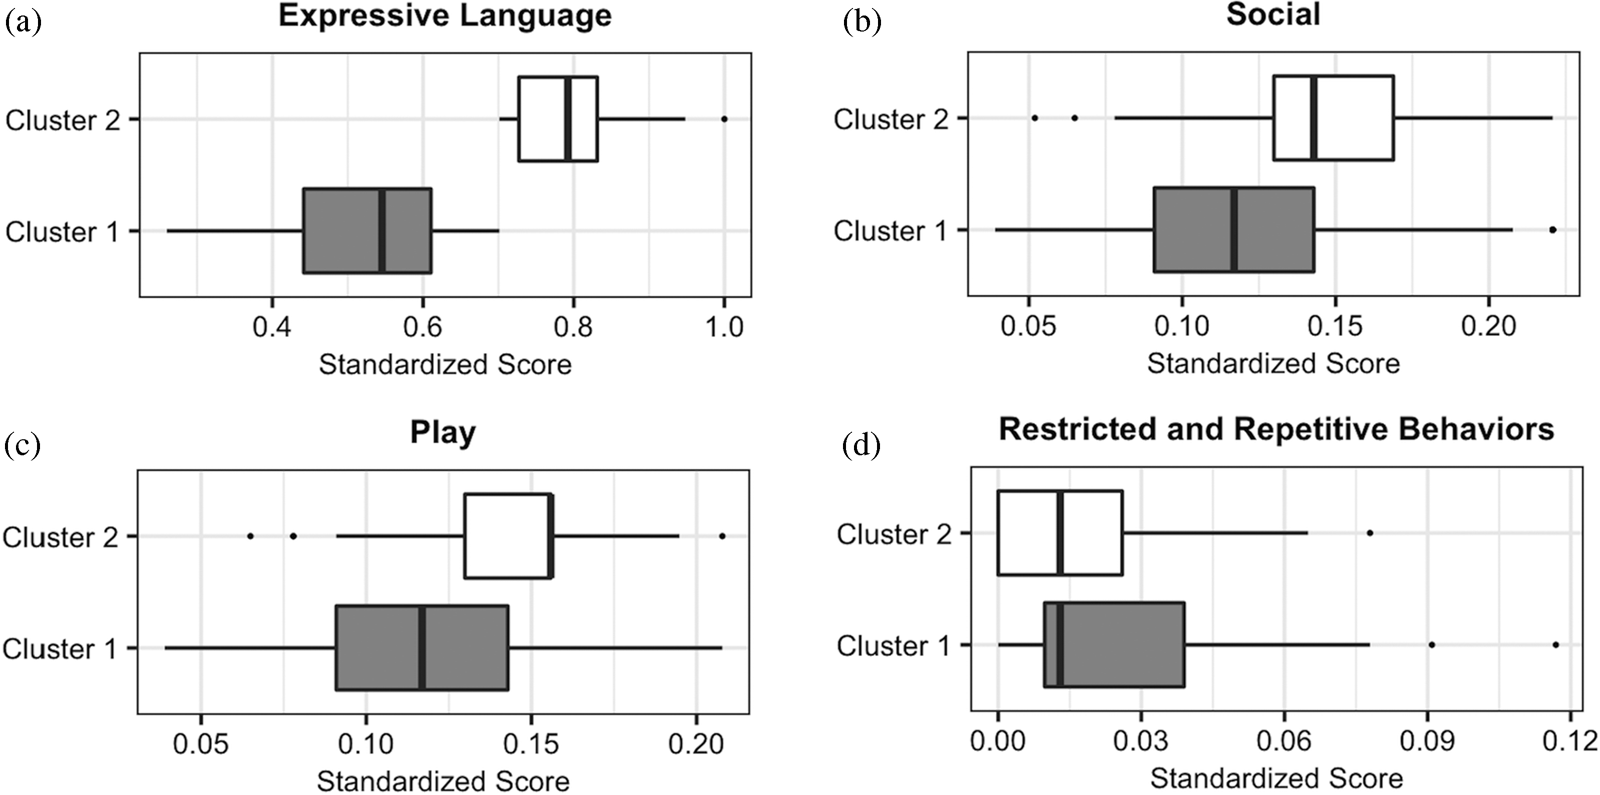
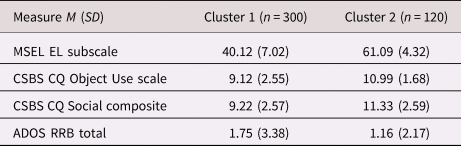
Next, we aimed to understand the developmental characteristics defining the behavioral profiles represented by the clusters. Results of the MANOVA comparing the two clusters revealed a significant multivariate effect [F (4, 415) = 176.33, p < .001, Wilks’ Λ = .370] accounted for by significant univariate effects on all four variables representing the dimensions of development examined herein (see Table 2 for means and standard deviations). The homogeneity of variance assumption was not met for the univariate effects of expressive language, play, and restricted and repetitive behaviors. As shown in Figure 1, Cluster 1 exhibited significantly lower scores in expressive language, [t (1, 359.36) = −32.44, p < .001], social, [F (1, 418) = 40.29, p < .001], and play [t (1, 272.47) = -7.78, p < .001] clustering variables, and higher (more atypical) on the restricted and repetitive behaviors clustering variable [t (1, 269.97) = -3.99, p < .001], compared to Cluster 2 at age 14 months. These results indicated that Cluster 1 exhibited significantly lower scores across critical domains of development and significantly higher levels of atypical behaviors, compared to Cluster 2. The greater variability in score distributions for Cluster 1 relative to Cluster 2 (see Figure 1) reflects the developmental diversity characterizing Cluster 1.
Developmental characteristics of the two-cluster solution at 14 months derived from the following clustering variables: (a) Expressive Language = Mullen Scales of Early Learning (MSEL) Expressive Language subscale. (b) Social = Communication and Symbolic Behavior Scales Caregiver Questionnaire (CSBS CQ) Social composite. (c) Play = CSBS CQ Object Use scale. (d) Restricted and Repetitive Behavior (RRB) = Autism Diagnostic Observation Schedule (ADOS) RRB total (higher scores indicating more severe RRB). All measures were scaled for comparison. The center line on each boxplot denotes the median, the edges of the box indicate the 25th and 75th percentiles, and the whiskers extend to data points that lie within 1.5× the interquartile range. Points outside this range represent outliers.

Means and standard deviations of clustering variables at 14 months.

MSEL EL = Mullen Scales of Early Learning Expressive Language; CSBS CQ = Communication and Symbolic Behavior Scales Developmental Profile Caregiver Questionnaire; ADOS RRB = Autism Diagnostic Observation Schedule Restricted and Repetitive Behavior
Proportion of ASD outcomes in the cluster groups
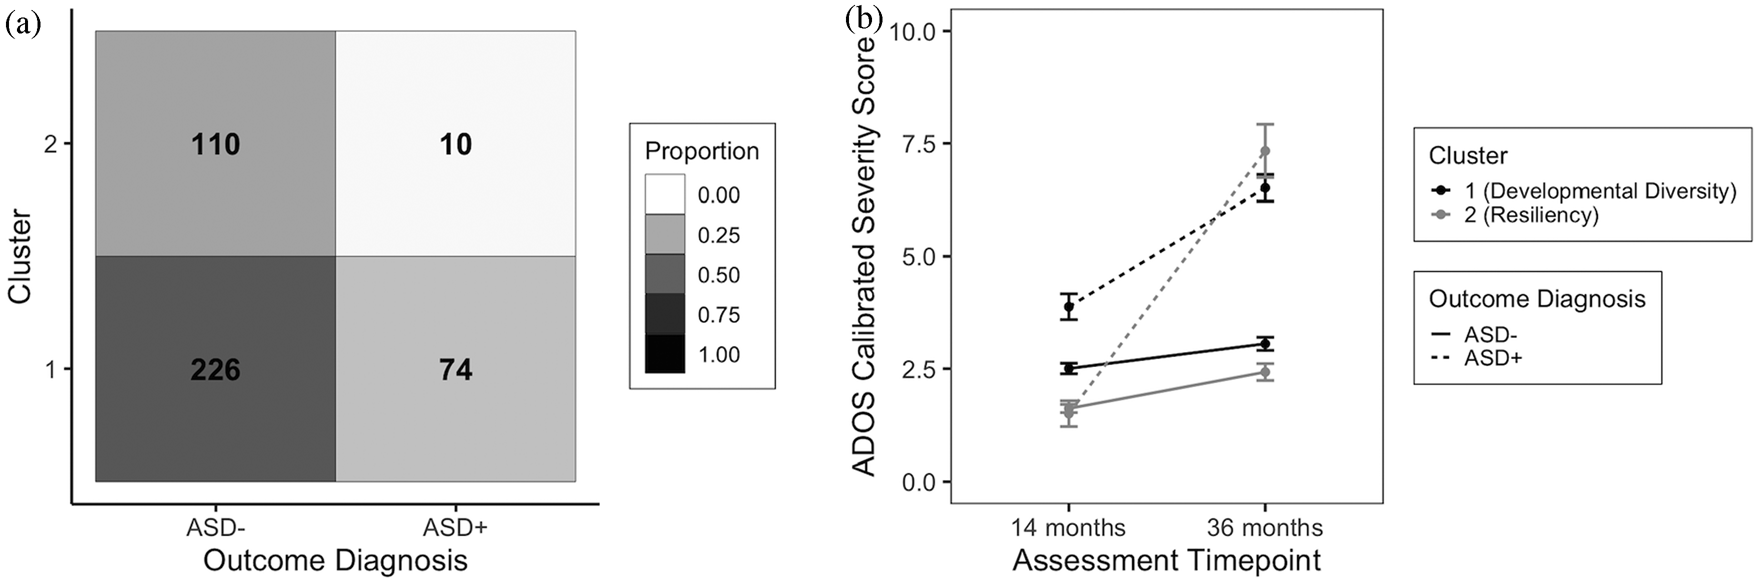
To understand whether the developmentally robust profile characterizing Cluster 2 conferred resiliency to later diagnosis of ASD, we examined the proportion of children having ASD outcome diagnosis in the two clusters (see Figure 2a). A significantly greater proportion of toddlers in Cluster 1 were identified as ASD+ at outcome (25%) compared to those in Cluster 2 (8%), [χ 2 (1) N = 420, 14.29, p < .001].
Autism spectrum disorder (ASD) outcome diagnostic status and symptoms across Behavioral Profile Clusters. (a) Confusion Matrix showing the classification of participants by Cluster and Outcome Diagnosis. The bolded numbers indicate the number of participants per group, with the shade of a given cell denoting the proportion of participants out of the total sample within a given cluster by outcome diagnosis subgrouping. Darker shades in a given cell indicate a higher proportion of children represented out of the total sample (Cluster 1, ASD− = 54%; Cluster 1, ASD+ = 18%; Cluster 2, ASD− = 26%; and Cluster 2, ASD+ = 2%). (b) ASD symptom trajectories of Cluster 1 (Developmental Diversity) and Cluster 2 (Resiliency Clusters) by ASD Diagnosis (ASD+/−), as measured by the ADOS Calibrated Severity Score (CSS), with higher CSS indicating more severe ASD symptoms. Error bars denote ± SEM.

Given the greater variability in the distribution of scores observed in Cluster 1 relative to that observed in Cluster 2, we interpreted Cluster 1 to reflect a Developmental Diversity Cluster, with a subset of this cluster being particularly vulnerable to developing ASD. Given the significantly lower proportion of children with ASD+ outcome in Cluster 2, we interpreted Cluster 2 to reflect a Resiliency Cluster.
Effects of cluster and ASD diagnosis on ASD symptom trajectories from 14 to 36 months
We next implemented a linear mixed-effects regression model to investigate the extent to which ASD symptoms (as reflected by ADOS CSS) change from age 14 months to the outcome assessment at target age 36 months across cluster group and ASD diagnosis status (ASD+/−), with the Resiliency Cluster and ASD− outcome as the reference levels. Results revealed a significant main effect of assessment timepoint [β = 0.81, SE = 0.23, χ 2 (1) = 90.17, p = <.001], suggesting that ASD symptoms significantly increased from the 14-month assessment timepoint to the 36-month assessment timepoint; a significant main effect of cluster group [β = 0.89, SE = 0.21, χ 2 (1) = 24.66, p < .001], with the Developmental Diversity Cluster exhibiting significantly more ASD symptoms relative to the Resiliency Cluster; and a significant main effect of ASD diagnosis [β = −0.11, SE = 0.61, χ 2 (1) = 188.98, p < .001], indicating that ASD symptoms, in general, were significantly higher in participants who received an ASD diagnosis at outcome (ASD+), relative to those who did not receive an ASD diagnosis (ASD−) (see Figure 2b). There was a significant three-way interaction between assessment timepoint, cluster, and ASD diagnosis [β = −2.92, SE = 0.87, χ 2 (1) = 11.28, p < .001].
Post hoc analyses were conducted to investigate the nature of the three-way interaction between assessment timepoint, cluster, and ASD diagnosis. The results indicated that, at the 14-month timepoint, significant differences were observed in ASD symptoms between the Resiliency ASD− group and the Developmental Diversity ASD− group [β = −0.89, SE = 0.188, t = −4.73, p = < .001]. A significant difference also was detected between the Resiliency ASD− group and the Developmental Diversity ASD+ group [β = −2.26, SE = 0.24, t = −9.33, p < .001]. Significant group differences were observed between the Resiliency ASD+ and Developmental Diversity ASD+ groups [β = −2.38, SE = 0.54, t = −4.38, p < .001]. In all three of the above analyses, the Resiliency ASD+ group showed fewer ASD symptoms relative to the Developmental Diversity ASD+ group. Significant group differences were observed between the Developmental Diversity ASD− group and the Developmental Diversity ASD+ group [β = −1.37, SE = 0.22, t = −6.36, p < .001], with the Developmental Diversity ASD− group showing fewer ASD symptoms relative to the Developmental Diversity ASD+ group. No group differences were observed in level of ASD symptoms between the Resiliency ASD− and the Resiliency ASD+ groups [β = 0.12, SE = 0.53, t = 0.22, p = .997], nor between the Developmental Diversity, ASD− group and the Resiliency ASD+ group [β = 1.005, SE = 0.521, t = 1.930, p = 0.2172].
Overall ASD symptoms were noted to increase from the 14-month assessment timepoint to the 36-month timepoint [β = −2.46, SE = 0.22, t = −11.29, p < .001]. At the 36-month assessment timepoint, comparison of the Developmental Diversity Cluster ASD− and Resiliency ASD− subgroups revealed that the level of ASD symptomatology in the Developmental Diversity Cluster was significantly higher compared to the Resiliency Cluster [β = −0.63, SE = 0.23, t = −2.63, p = .044], retaining the pattern reported for the cluster subgroup contrasts at 14 months. Results of the 36-month contrasts that differed from reported 14-month contrasts included a significant difference in level of ASD symptomatology between the Developmental Diversity ASD− and Resiliency ASD+ groups [β = −4.279, SE = 0.692, t = −6.184, p < .0001], with the Developmental Diversity ASD− group showing fewer ASD symptoms relative to the Resiliency ASD+ group. Furthermore, at the outcome timepoint, there was no significant group difference observed between the Resiliency ASD+ group and Developmental Diversity, ASD+ group [β = 0.820, SE = 0.718, t = 1.142, p = .664].
Post hoc analyses at 14 months within the developmental diversity cluster
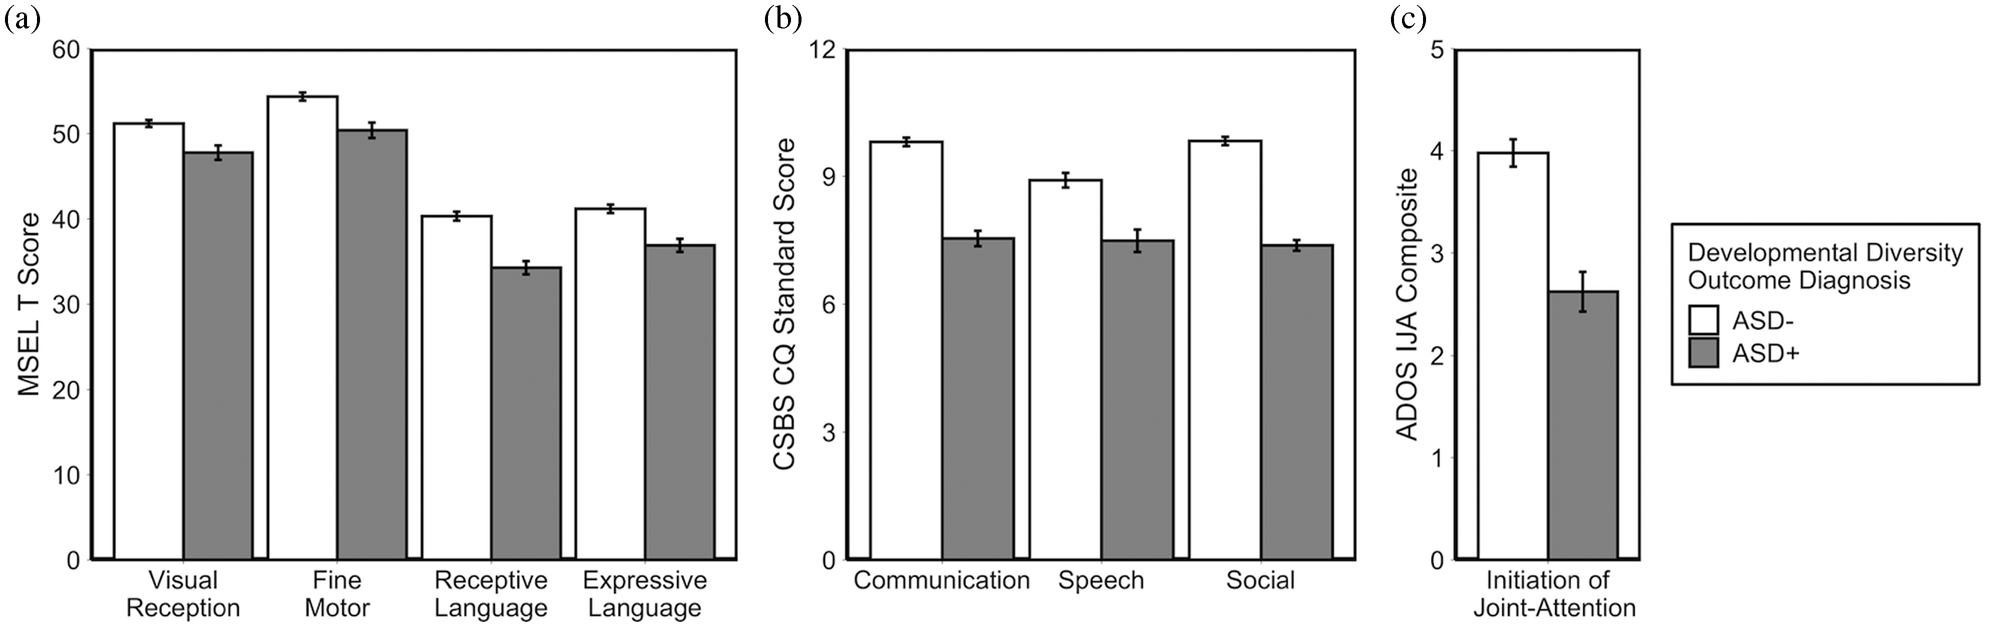
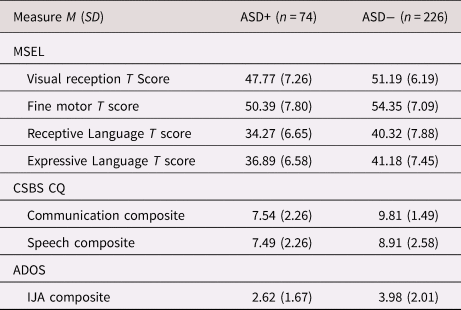
Due to the apparent heterogeneity observed within the Developmental Diversity Cluster, we hypothesized that children having ASD+ outcome would exhibit less robust development than those having an ASD− outcome at age 14 months. Thus, we subgrouped the children in the Developmental Diversity Cluster based on their ASD+ and ASD− outcomes for further analyses to investigate whether 14-month-olds later diagnosed with ASD display developmental lags compared to those 14-month-olds who do not receive a later ASD diagnosis (see Table 3 for means and standard deviations of measures). As shown in Figure 3, within the Developmental Diversity Cluster, the ASD+ subgroup scored significantly lower on all variables examined relative to the ASD− subgroup, as specified here: CSBS CQ Social composite [F (1,298) = 37.18, p < .001, d = .82], Symbolic composite, [F (1,297) = 33.22, p < .001, d = .77], and Speech composite, [F (1,297) = 17.45, p < .001, d = .56]. Similarly, 14-month-olds in the Developmental Diversity Cluster ASD+ subgroup scored significantly lower on all four MSEL scales compared to those in the Developmental Diversity Cluster with ASD− subgroup. Specifically, compared to 14-month-olds in the Developmental Diversity ASD+ subgroup, 14-month-olds in the Developmental Diversity Cluster ASD− subgroup exhibited significantly lower: nonverbal cognitive skills as reflected by the Visual Reception scale (Stone et al., Reference Stone, McMahon, Yoder and Walden2007) [F (1,298) = 8.09, p = .005, d = 0.38]; fine motor skills [F (1,298) = 10.43, p = .001, d = 0.43]; receptive language skills [F (1,298) = 20.28, p < .001, d = 0.60]; and expressive language skills [F (1,298) = 16.29, p < .001, d = 0.54]. In addition, 14-month-olds in the Developmental Diversity ASD+ subgroup had significantly lower initiation of joint-attention skills (as reflected by the derived ADOS IJA composite described in the Methods section), relative to 14-month-olds in the Developmental Diversity ASD− subgroup [F (1,298) = 39.97, p < .001, d = .85].
Developmental Diversity Cluster characteristics across developmental dimensions. (a) MSEL Visual Reception, Fine Motor, Receptive Language, and Expressive Language subscales. (b) CSBS CQ Communication, Speech, and Social composites. (c) ADOS Initiation of Joint-Attention (IJA) Composite, reverse scored with higher value indicating better IJA skills. Error bars denote ± SEM.

Means and standard deviations of post hoc dependent variables investigating developmental differences within the Developmental Diversity Cluster.

Note: ADOS = Autism Diagnostic Observation Schedule; IJA = Initiation of Joint-Attention composite score (higher scores indicate better IJA skills); ASD+ = Outcome diagnosis of ASD at 36 months; ASD− = Outcome diagnosis of non-ASD at 36 months; MSEL = Mullen Scales of Early Learning Expressive Language; CSBA CQ = Communication and Symbolic Behavior Scales Developmental Profile Caregiver Questionnaire
Discussion
To our knowledge, this is the first study to investigate developmental profiles associated with vulnerability and resiliency related to ASD early in the second year of life using a developmental, dimensional data-driven approach to parse heterogeneity. The results from the hierarchical agglomerative cluster analysis on developmental measures collected from 14-month-olds at HR and LR for ASD revealed a two-cluster solution. One cluster (28.6% of the sample), the Resiliency Cluster, showed more advanced expressive language, social, and play development, as well as lower levels of restricted and repetitive behaviors, than the larger cluster (the Developmental Diversity Cluster). The proportion of HR siblings in the Developmental Diversity cluster was significantly greater than in the Resiliency cluster, and the sex ratio across the two clusters differed, with proportionally more males in the Developmental Diversity Cluster relative to the Resiliency Cluster. No toddlers in the Resiliency Cluster were judged by expert clinical researchers to exhibit ASD at age 14 months. In the Developmental Diversity Cluster, 43 toddlers received a clinical judgment of ASD at age 14 months, with 80% stability in ASD diagnosis through age 36 months. Nearly all of the toddlers who ultimately received ASD diagnosis were in the Developmental Diversity Cluster that was defined using developmental data from age 14 months, nearly two years before the confirmatory ASD diagnosis was made. Indeed, 25% of children in the Developmental Diversity Cluster, compared to 8% in the Resiliency Cluster, were later diagnosed with ASD. Severity of ASD symptoms, overall, were higher in the Developmental Diversity Cluster than in the Resiliency Cluster at age 14 months, and this finding remained stable through the outcome assessment at 36 months. These findings show promise that resiliency to later ASD diagnosis, at least through age 36 months, may be identified as early as age 14 months, though not with 100% accuracy.
Our finding of two clusters, one large and one small, in the current study including children with and without outcome diagnosis of ASD at the juncture between the prodromal and symptom emergence periods of ASD aligns with the finding of two clusters by Georgiades et al. (Reference Georgiades, Szatmari, Zwaigenbaum, Bryson, Brian, Roberts and Garon2013). Yet some major differences exist. First, in the Georgiades et al. (Reference Georgiades, Szatmari, Zwaigenbaum, Bryson, Brian, Roberts and Garon2013) study, only children in whom ASD had been ruled out were included. Second, the small cluster in the Georgiades et al. (Reference Georgiades, Szatmari, Zwaigenbaum, Bryson, Brian, Roberts and Garon2013) study consisted of toddlers showing high levels of ASD traits, while in the present study, the smaller cluster consisted of toddlers with negligible ASD traits and resiliency to later ASD diagnosis, though not complete resiliency to ASD (discussed further below). While both studies used a similar data-driven analytic approach with a focus on toddlers early in the first year of life, there are several methodological differences that could contribute to dissimilarities in results across the studies. Perhaps the most noteworthy difference involves the dependent variable(s). Georgiades et al.'s (Reference Georgiades, Szatmari, Zwaigenbaum, Bryson, Brian, Roberts and Garon2013) cluster analysis was based on a single dependent variable, the total score from the Autism Observation Scale for Infants (Bryson et al., Reference Bryson, Zwaigenbaum, McDermott, Rombough and Brian2008), which measures ASD symptomology. That approach afforded confirmation of others’ findings regarding the heterogeneity within ASD− HR siblings early in the second year of life (e.g., Landa & Garrett-Mayer, Reference Landa and Garrett-Mayer2006; Landa et al., Reference Landa, Holman and Garrett-Mayer2007, Reference Landa, Gross, Stuart and Bauman2012). In turn, that approach potentially constrained results to differentiation of clusters based on degree of expressed autism symptomatology. In the present study, the features of development that were selected for examination in the cluster analysis were measured using three non-ASD-specific developmental measures, each assessing a different dimension of development, and one measure of an ASD symptom dimension (restricted and repetitive behaviors). Thus, results were not constrained by child performance on a single score, nor did our results solely reflect degree of ASD traits. Three additional differences between the current study and Georgiades et al. (Reference Georgiades, Szatmari, Zwaigenbaum, Bryson, Brian, Roberts and Garon2013) study include child age (12 months in Georgiades et al., Reference Georgiades, Szatmari, Zwaigenbaum, Bryson, Brian, Roberts and Garon2013, 14 months herein), our inclusion of LR controls (HR only in Georgiades et al., Reference Georgiades, Szatmari, Zwaigenbaum, Bryson, Brian, Roberts and Garon2013), and our inclusion of children with ASD+ and ASD− outcome diagnoses whereas only children with ASD− outcomes were included in Georgiades et al.'s (Reference Georgiades, Szatmari, Zwaigenbaum, Bryson, Brian, Roberts and Garon2013) study. Including the LR group in the current investigation provided the opportunity to index development of the HR group, and further investigate developmental differences in LR infants. Indeed, the findings revealed that only 37.75% of the LR sample was represented in the Resiliency Cluster. This result provided a frame of reference for interpreting our finding that 25.77% of the HR sample was represented in the Resiliency Cluster. Without the LR group, one may inaccurately presume that most LR infants will have a developmental outcome that is reflective of the Resiliency Cluster in the current investigation, which is not the case in the current investigation. Together, these differences likely contributed to detection of a resiliency cluster in the present study, and of an ASD-trait laden cluster in the Georgiades et al. (Reference Georgiades, Szatmari, Zwaigenbaum, Bryson, Brian, Roberts and Garon2013) study.
The developmental profile characterizing the Resiliency Cluster consists of a multidimensional (language, social, play) cohering of development aligned with normative expectations and a low level of atypical (restricted and repetitive behaviors) behavior. Compared to the Developmental Diversity Cluster, children in the Resiliency Cluster exhibited lower ASD symptomatology (per mean ADOS CSS) at age 14 months, regardless of whether the children later met criteria for ASD. Strong expressive language development (one standard deviation above the mean) was a particularly noteworthy characteristic of this cluster. Toddlers having the strong language, social, and play skills that characterized the Resiliency Cluster likely are equipped with effective means of eliciting development-enriching adult input and capitalizing on the bi-directional influences of caregiver-child transactional events (Sameroff, Reference Sameroff and Sameroff2009). In addition to transactional processes, a dynamic systems model is relevant to understanding ASD resiliency. The dynamic systems model posits that, in real time, there is coupling between a child's internal and external experiences. The child's multisystem intrinsic experiences (motor, cognitive, and social) interact with external experiences with the environment and, together, facilitate children's detection of regularities that support language learning in a dynamic interplay of events (Hockema & Smith, Reference Hockema and Smith2009). From a dynamic systems perspective, language development not only reflects what children know about the organization of their environment, it also changes how children learn (Hockema & Smith, Reference Hockema and Smith2009; Kuhl, Reference Kuhl2000; Spencer, Perone, Smith, & Samuelson, Reference Spencer, Perone, Smith and Samuelson2011). Thus, strong early language skills may create a developmental landscape for optimizing development, thereby protecting against factors that could perturb the developmental process. Strong coherence in development across language, social, and play dimensions, as observed in the 14-month-olds in the Resiliency Cluster, likely reflects maturation in parallel processing and brain development involving processes such as increases in cortical thickness and surface area (Lyall et al., Reference Lyall, Shi, Geng, Woolson, Li, Wang and Gilmore2014), differentiation (Yin et al., Reference Yin, Chen, Hung, Baluyot, Li and Lin2019), and integration (Fair et al., Reference Fair, Cohen, Power, Dosenbach, Church, Miezin and Petersen2009) that likely function in a protective manner.
The larger Developmental Diversity Cluster consisted of more than two thirds of the 14-month-olds, with 73 HR siblings and 1 LR control having an ASD diagnosis at the outcome assessment. Comparison of toddlers within the Developmental Diversity Cluster who were later classified as ASD+ versus ASD− revealed that, even within this cluster, there is considerable heterogeneity. More specifically, toddlers later diagnosed with ASD exhibited lower levels of receptive and expressive language, fine motor, and nonverbal cognitive functioning, as well as lower diversity in the functions of their communicative bids and types of gestures and play acts produced, less mature social use of gaze and well-regulated emotion expression, and lower levels of IJA. The greatest degree of divergence from expected developmental level was observed in symbolic representational domains (gestures, object use, receptive and expressive language), diversity of communicative functions, and maturity of IJA (including social giving, showing, and pointing with eye contact). Dimensions that were least severely affected at age 14 months in the ASD+ outcome subgroup were fine motor and nonverbal cognitive functioning, where standard scores fell within the average range for chronological age. This finding suggests that strengths in these areas at age 14 months are not sufficient for resiliency to an ASD+ outcome.
Change in ASD symptomatology in the second and third years of life
An overall increase in ASD symptoms was detected over time, with ASD symptomatology consolidating in a subgroup of children across the two clusters. While children with ASD+ outcomes in the Resiliency Cluster displayed less ASD symptomatology at age 14 months compared to those in the Developmental Diversity Cluster, the level of ASD symptomatology exhibited by these subgroups of children did not differ at age 36 months. This finding is consistent with reports from our prior work and that of other groups (e.g., Ozonoff et al., Reference Ozonoff, Iosif, Baguio, Cook, Hill, Hutman and Young2010) and demonstrates that strengths in social, language, and play development along with low levels of restricted and repetitive behaviors at age 14 months is not fully protective against the emergence of ASD, nor its level of severity at age 36 months. Furthermore, this finding may reflect the phenomenon of equifinality, whereby individuals, at some point in development share characteristics, but may have reached such phenotypic similarity through different processes. The finding that ASD emerged in some children in the Resiliency Cluster highlights several factors to consider: (a) development is a dynamic process, and later functioning (or diagnostic outcomes) cannot be fully predicted by defining developmental characteristics earlier in development; and (b) genetic factors may disrupt biological pathways, and hence, development (Geschwind, Reference Geschwind2011). More neurobiological research is needed to interrogate this developmental heterochronicity. For the ASD− subgroups within the two clusters, level of ASD symptomatology at 36 months was greater in the Developmental Diversity than in the Resiliency Cluster, retaining the pattern identified at age 14 months. This finding further supports the concept of resiliency generated by 14-month data for Cluster 2.
Clinical implications
Prospective longitudinal studies of HR siblings to date largely have endeavored to identify early markers for ASD. Yet given the prevalence of ASD, the public awareness efforts focused on early detection of ASD, and many parents’ concerns that their child may develop ASD (MacDuffie et al., Reference MacDuffie, Turner-Brown, Estes, Wilfond, Dager and Pandey2019), empirically generated information about developmental indicators of resiliency to ASD is needed. Our results indicate that a developmental profile associated with low risk for ASD may be identified by age 14 months, even in HR siblings. Toddlers exhibiting accelerated language development, along with developmentally appropriate social and play skills and low levels of restricted and repetitive behaviors, have low likelihood of developing ASD by the third birthday. Nevertheless, parents should complete developmental screeners at the ages recommended by the American Academy of Pediatrics even if their child passed prior screenings or exhibits a developmental profile characteristic of the Resiliency Cluster identified in the present study because our data show incomplete resiliency to later ASD diagnosis even when development at age 14 months appears accelerated. As children progress through the second and into the third year of life without declines in development or emergence of clinical signs of ASD, parents may experience reduction in stress, regardless of whether they already have a biological child with ASD (Neece, Green, & Baker, Reference Neece, Green and Baker2012). Transactional models suggest that reduced level of parent stress is likely to result in improved quality of parent–child engagement and child development (Davlantis, Estes, Dawson, & Rogers, Reference Davlantis, Estes, Dawson and Rogers2019).
For children in the Developmental Diversity Cluster, there is greater likelihood of developing ASD even when the disorder is not fully manifest at age 14 months. ASD appears to be most probable when a child has an older sibling with ASD, is male, and displays expressive and receptive language skills falling more than a standard deviation below the norm, infrequent IJA, diminished diversity of communicative functions and gestures, and presence of restricted and repetitive behaviors even when fine motor and nonverbal cognitive functioning is within normal limits. These developmental vulnerabilities, if untreated, could cascade into developmental challenges later in life. For example, reduced levels of IJA and expressive language functioning at ages 14 and 24 months, respectively, are predictive of pragmatic communication difficulties during adolescence (Greenslade et al., Reference Greenslade, Utter and Landa2019). These findings may provide useful guidance for primary care providers’ decision-making related to early intervention referrals. Children having such a profile should be assessed by an expert in early development and, regardless of whether they meet criteria for early intervention services, their parents should be provided with guidance on use of evidence-based, child-responsive enrichment strategies within daily home routines (see Wetherby et al., Reference Wetherby, Woods, Guthrie, Delehanty, Brown, Morgan and Lord2018 regarding parent education opportunities through the Autism Navigator). Important skills to target in enriched caregiver–child interactions include gestures (i.e., pointing, showing and giving for IJA as well as other conventional and symbolic gestures), language, play, and social interaction. Together, advancements in these dimensions may promote the development of a distributed network of skills that could strengthen development later (Landa & Kalb, Reference Landa and Kalb2012). Prior research has identified diversity of gestures and frequency of IJA as being particularly associated with receptive and expressive language outcomes (Watt, Wetherby, Barber, & Morgan, Reference Watt, Wetherby, Barber and Morgan2008). Play experiences provide the opportunity to learn about how objects relate to one another, and how language maps onto objects and object relations (e.g., pour milk in the cup) (Laakso, Poikkeus, Eklund, & Lyytinen, Reference Laakso, Poikkeus, Eklund and Lyytinen1999). Indeed, play skills are predictive of language development in the second year of life (Laakso et al., Reference Laakso, Poikkeus, Eklund and Lyytinen1999). In turn, there is empirical evidence that early social and language development is associated with later language and reading success (Rescorla, Reference Rescorla2009). In sum, our findings indicate that a proactive approach to development is advisable, where early social, communication, and play development are intentionally enriched.
Readily accessible resources for educating families, childcare providers, and primary care providers about development, early indicators of ASD and communication delay, and development-enriching child-responsive engagement strategies include:
• the Center for Disease Control's Learn the Signs Act Early materials (www.cdc.gov/ncbddd/childdevelopment/features/key-finding-ltsae);
• US Department of Education (https://www2.ed.gov/about/inits/list/watch-me-thrive/index.html);
• American Speech-Language Hearing Association (ASHA);
• the Hanen Centre (hanen.org), Autism Speaks; and
• a 9-minute video-guided tutorial about the early signs of ASD (Bringing the Early Signs of Autism Spectrum Disorder into Focus, https://www.youtube.com/watch?v=YtvP5A5OHpU).
A public health approach, where a universal design for child developmental and behavioral health is established as a priority, could be transformative for early detection, access to early intervention, reducing early education disparities, and ultimately improve outcomes for children.
Methodological strengths and limitations
A major strength of the present study is the application of a developmental, multidimensional, data-driven approach to identify early behavioral profiles indicative of vulnerability and resiliency to later manifestation of the ASD symptom complex. Dependent variables for the cluster analysis were generated from three non-ASD-specific developmental measures, each assessing a salient dimension of early development relevant to the ASD phenotype, and one measure of an ASD symptom dimension: repetitive and stereotyped patterns of behavior and interests. Thus, the results in the current study were not constrained by child performance on a single score, nor did the results solely reflect degree of ASD symptomology. Another strength is the use of a large, expertly phenotyped sample of children at high and low familial risk for ASD. An additional strength is our use of normed measures that concurrently capture parent insights (parent-report measures) and researcher clinical insights (researcher-administered) about children's development. There was strong agreement between dependent variables generated by parent report (CSBS CQ) and researcher direct assessment (MSEL). For example, the mean standard scores generated from the parent-completed CSBS CQ Understanding scale and researcher-administered MSEL receptive language subscale fell at least one standard deviation below the test mean for the ASD+ outcome subgroup in the Developmental Diversity Cluster. This consistency across measures engenders confidence in the developmental dimensional metrics used in this study.
While the current study is one of the first to identify behavioral profiles associated with vulnerability and resiliency to later ASD diagnosis in younger siblings at familial risk for ASD, a few limitations are noted. First, our hierarchical agglomerative cluster analysis approach requires independent replication through additional experimentation and additional data collection. The current results may be used to generate important hypotheses regarding the neurodevelopmental processes undergirding early resilient and vulnerable behavioral profiles. Another limitation is that the conclusions may not be fully generalizable to the general population since the sample was enriched with infant siblings at familial risk for ASD. In addition, the findings herein are linked to development at age 14 months and additional research is needed using approaches similar to ours but focused on younger and older children. Future research also is needed to examine neurobiological and neurobehavioral measures (e.g., eye tracking) to further understand mechanisms that confer early vulnerability and resiliency related to ASD. Finally, it would be remiss not to acknowledge the difference in maternal education observed between the two clusters. Since examination of effects of maternal education was beyond the scope of the current investigation, future work should investigate whether, and the extent to which, maternal education mediates resiliency in infants at risk for ASD.
Conclusion
The developmental, dimensional, data-driven RDoC approach of the present prospective, longitudinal study of a HR sibling enriched sample generated findings that not only parsed developmental heterogeneity at age 14 months into two clusters, but also revealed that one of the clusters was associated with resiliency to ASD. ASD outcomes did occur in the Resiliency Cluster, though at a much lower rate than in the Developmental Diversity Cluster. The developmental coherence observed in the Resiliency Cluster of expressive language, social, and play development, with minimal evidence of restricted and repetitive behaviors, at age 14 months equips children with the skills needed to elicit development-enhancing interpersonal engagement that likely will further enrich development. Early lags across multiple dimensions of development were observed in children with particular vulnerability to later ASD diagnosis, most of whom belonged within the Developmental Diversity Cluster. In both clusters, children with ASD+ outcomes showed increasing ASD symptoms from age 14 to 36 months, a period of ASD symptom consolidation. In contrast, children in the two clusters whose outcome classification was ASD− showed slightly increasing but rather low levels of ASD symptomatology. Findings highlight the importance of a public health approach to child developmental health, the need for a broader community-based (e.g., child care centers) developmental screening system, the need for a multidimensional set of goals to be targeted within early intervention, and a direction for hypothesis generation for neurobiological and neurodevelopmental research endeavors.
Acknowledgements
The authors would like to thank the families who participated, our dedicated staff, and our funding source (NIH: 5R01Mh059630-08, PI: Rebecca Landa).
Financial conflicts of interest
The authors have no financial conflicts of interest to report.