Self-regulation develops rapidly in early childhood (Rothbart, Ziaie, & O'Boyle, Reference Rothbart, Ziaie and O'Boyle1992) and is implicated in socially valued outcomes, such as positive peer relations in childhood and high educational attainment in adulthood (Lengua, Reference Lengua2003; Sitzmann & Ely, Reference Sitzmann and Ely2011). Regulatory abilities, such as internally modulating physiological arousal caused by strong emotions, restraining approach and reward seeking when required, inhibiting frustration, focusing attention, and organizing goal-directed behaviors, predict positive social adjustment, and dysregulation is associated with negative adjustment outcomes (Althoff, Verhulst, Rettew, Hudziak, & Van der Ende, Reference Althoff, Verhulst, Rettew, Hudziak and Van der Ende2010; Biederman, Spencer, et al., Reference Biederman, Spencer, Petty, Hyder, O'Connor, Surman and Faraone2012).
Dysregulation has been found to be relatively stable over time, highly heritable (approximately 54%–68% additive genetic factors), and to have fairly substantial shared environmental factors (approximately 18%–30%; Althoff, Rettew, Faraone, Boomsma, & Hudziak, Reference Althoff, Rettew, Faraone, Boomsma and Hudziak2006; Boomsma et al., Reference Boomsma, Rebollo, Derks, Van Beijsterveldt, Althoff, Rettew and Hudjiak2006; Hudziak, Althoff, Derks, Faraone, & Boomsma, Reference Hudziak, Althoff, Derks, Faraone and Boomsma2005). Recent studies have also demonstrated positive associations between dysregulation and risk for suicidality (Althoff et al., Reference Althoff, Rettew, Faraone, Boomsma and Hudziak2006, Reference Althoff, Rettew, Ayer and Hudziak2010; Ayer et al., Reference Ayer, Althoff, Ivanova, Rettew, Waxler, Sulman and Hudziak2009; Holtmann et al., Reference Holtmann, Becker, Banaschewski, Rothenberger and Roessner2011; Mbekou, Gignac, MacNeil, Mackay, & Renaud, Reference Mbekou, Gignac, MacNeil, Mackay and Renaud2014; Volk & Todd, Reference Volk and Todd2007), bipolar disorder (Althoff et al., Reference Althoff, Rettew, Ayer and Hudziak2010; Biederman et al., Reference Biederman, Petty, Monuteaux, Evans, Parcell, Faraone and Wozniak2009; Diler et al., Reference Diler, Birmaher, Axelson, Goldstein, Gill, Strober and Keller2009), aggression (Doerfler, Connor, & Toscano, Reference Doerfler, Connor and Toscano2010), oppositional defiant disorder, conduct disorder, attention deficit hyperactivity disorder (Volk & Todd, Reference Volk and Todd2007), anxiety (Althoff et al., Reference Althoff, Rettew, Ayer and Hudziak2010), and substance use disorders (Holtmann et al., Reference Holtmann, Becker, Banaschewski, Rothenberger and Roessner2011). Particular combinations of the widely used anxious/depressed, attention, and aggression subscales (AAA; Achenbach, Reference Achenbach1991) are often used to index dysregulation because of the associations between elevation on these scales and psychiatric outcomes and impairment (Ayer et al., Reference Ayer, Althoff, Ivanova, Rettew, Waxler, Sulman and Hudziak2009). Despite clear movement toward a construct of dysregulation, the construct has not been operationalized in a standard way across studies. This is likely due to differences in the samples used and in the conceptualization of dysregulation, but does limit the conclusions that can be drawn about the implications of dysregulation (Deutz, Geeraerts, van Baar, Dekovic, & Prinzie, Reference Deutz, Geeraerts, van Baar, Deković and Prinzie2016). We asked four main questions in the present study:
1. How should dysregulation be measured, and relatedly, do different measures of dysregulation show different results?
2. What are the developmental origins of dysregulation?
3. What are the implications of dysregulation for adult functioning?
4. Do the implications of dysregulation differ from those of the broader indexes of externalizing and internalizing problems?
Measurement of Dysregulation
Previous studies have primarily employed categorical measures, classifying individuals as dysregulated or not by using a profile of Achenbach's normative T score cutoffs on the anxious/depressed, attention problems, and aggression subscales of the Child Behavior Checklist (CBCL; Diler et al., Reference Diler, Birmaher, Axelson, Goldstein, Gill, Strober and Keller2009; Jucksch et al., Reference Jucksch, Salbach-Andrae, Lenz, Goth, Döpfner, Poustka and Holtmann2011; Mbekou et al., Reference Mbekou, Gignac, MacNeil, Mackay and Renaud2014). Others have used cutoffs based on standard deviations from the sample mean (Biederman et al., Reference Biederman, Petty, Monuteaux, Evans, Parcell, Faraone and Wozniak2009; Biederman, Petty, et al., Reference Biederman, Petty, Day, Goldin, Spencer, Faraone and Wozniak2012; Biederman, Spencer, et al., Reference Biederman, Spencer, Petty, Hyder, O'Connor, Surman and Faraone2012) or latent class analysis (Althoff et al., Reference Althoff, Rettew, Ayer and Hudziak2010; De Caluwé, Decuyper, & De Clercq, Reference De Caluwé, Decuyper and De Clercq2013). We nevertheless chose to primarily use continuous measures of dysregulation, based on the methodological advances of dimensional over categorical models (Kraemer, Noda, & O'Hara, Reference Kraemer, Noda and O'Hara2004). We judged this of particular value in our community sample, with its various degrees of dysregulation, ranging from not dysregulated to severely dysregulated. Such dimensional measures are approximately 40% more predictive of later outcomes, compared to categorical measures (Fergusson & Horwood, Reference Fergusson and Horwood1995), perhaps because a categorical approach may mistakenly overlook children who do not meet full criteria for dysregulation, while subthreshold levels of dysregulation may still predict negative adjustment outcomes.
Studies indexing dysregulation dimensionally have typically used summed T scores (Holtmann et al., Reference Holtmann, Becker, Banaschewski, Rothenberger and Roessner2011; Volk & Todd, Reference Volk and Todd2007) or summed raw scores (Boomsma et al., Reference Boomsma, Rebollo, Derks, Van Beijsterveldt, Althoff, Rettew and Hudjiak2006; Hudziak et al., Reference Hudziak, Althoff, Derks, Faraone and Boomsma2005) from the AAA subscales (Ayer et al., Reference Ayer, Althoff, Ivanova, Rettew, Waxler, Sulman and Hudziak2009). Aggregating information across AAA subscales without evenly weighting each subscale by its number of items may produce uneven, biased estimates of dysregulation because the scales differ in number of items. In particular, the aggression subscale, which also includes disruptive and noncompliant behaviors, has more items than the other scales (20 items compared to 11 for attention problems and 14 for anxious/depressed). To increase conceptual precision in indexing dysregulation, we chose to compute an index in which each subscale contributes equally to the overall dysregulation index. The AAA subscales were evenly weighted by calculating an average rating per item, summing the items for each subscale, and then dividing that sum by the number of completed items in the subscale, as was done by McGuire et al. (Reference McGuire, Small, Lewin, Murphy, De Nadai, Phares and Storch2013). We are apparently the first to test empirically how this even-weighting approach to the dysregulation profile compares with a more commonly used approach of averaging the raw scores or T scores of the three subscales.
We also compared this continuous, evenly weighted dysregulation index to a categorical index in order to determine if capitalizing on the information provided by the dysregulation profile itself (i.e., elevation on all three of the AAA subscales) adds significant value and meaning to the dysregulation index, relative to averaging linear scores. Consistent with previous research (e.g., Meyer et al., Reference Meyer, Carlson, Youngstrom, Ronsaville, Martinez, Gold and Radke-Yarrow2008; Spencer et al., Reference Spencer, Faraone, Surman, Petty, Clarke, Batchelder and Biederman2011), children were categorized as dysregulated if they had elevated t scores (≥60) on each of the three AAA subscales. We also tested a more dimensional, multiplicative index of dysregulation, taking into account all three subscales to form a continuous profile. A multiplicative index of dysregulation can better account for anxious and depressed symptoms by using the product of the average item ratings for each subscale. With the additive index, a child with no anxious/depressed symptoms could have a high dysregulation score that is purely driven by elevation on the aggression and attention problems scales. With the multiplicative index, however, a child with symptoms of aggression, attention problems, and anxiety/depression would be rated as more severe than a child with no anxious/depressed symptoms. Similar to the calculation of performance, which is the product of motivation and ability (Anderson & Butzin, Reference Anderson and Butzin1974), and the calculation of attitudes, as the product of expectancies and values (Ajzen & Fishbein, Reference Ajzen and Fishbein1981), dysregulation can be indexed as the product of attention problems, aggression, and anxious/depressed symptoms, such that all three contribute to the overall profile score in an interactive manner. Through the use of a continuous, evenly weighted score, simple averages, a categorical index, and a multiplicative score, the present study tested various ways of forming the dysregulation index to advance understanding of how dysregulation should be conceptualized and operationalized to glean maximal information and predictive value.
The present study also used both mother and teacher reports to offer multiple perspectives on children's dysregulation in a variety of settings. There are a number of ways to incorporate information from multiple sources, with simple combinations performing just as well as more complex combination schemes (Bird, Gould, & Staghezza, Reference Bird, Gould and Staghezza1992). There are three main simple combination schemes: compensatory (simple average across raters), conjunctive (“and rule”), and disjunctive (“or rule”; Youngstrom, Findling, & Calabrese, Reference Youngstrom, Findling and Calabrese2003). The disjunctive approach counts symptom endorsement from either rater, generating a broader, more heterogeneous group of identified cases compared to the more stringent conjunctive approach, which has lower sensitivity for detecting problematic behavior, but higher specificity by only identifying those cases who have symptom endorsement across raters. The disjunctive technique is particularly useful for sensitively detecting target behaviors with a low base rate, and it is widely used in clinical practice. In order to sensitively detect elevation on the AAA scales in a community sample with as few false negatives as possible, the disjunctive combination approach was deemed appropriate. In summary, we measured dysregulation in seven ways: (a) evenly weighted per-item average of mother report on the AAA index, (b) evenly weighted teacher report, (c) maximum score using the disjunctive “or rule” to combine information across raters, (d) simple averages of the raw scores, (e) simple averages of t scores, (f) a categorical index, and (g) a multiplicative index. The first three primary measures were compared to the remaining four measures to determine if they were substantially different from each other in their predictive utility.
Origins of Dysregulation
Beyond examining and clarifying best measurement practices for dysregulation, we also aimed to advance understanding of the origins of individual differences in dysregulation. We have not found studies that consider the important developmental question of whether individuals differ not only in their initial levels of dysregulation but also in changes over time in dysregulation problems. How individual growth patterns develop is the next question. Although dysregulation problems, as with other behavior problem indexes, have been shown to be stable in childhood, levels of problem behaviors in general can change in both severity and manifestation across development (Achenbach, Howell, McConaughy, & Stanger, Reference Achenbach, Howell, McConaughy and Stanger1995; Miller, Vaillancourt, & Boyle, Reference Miller, Vaillancourt and Boyle2009; Olson et al., Reference Olson, Sameroff, Davis-Kean, Lansford, Sexton, Bates and Dodge2013). Changes in problem levels can themselves involve meaningful individual differences. For example, we have previously found externalizing problems, on average, decrease from childhood to adolescence, when they peak again, before declining once more through adulthood, following a curvilinear trajectory (Petersen, Bates, & Staples, Reference Petersen, Bates and Staples2014). Petersen et al. also found that individuals who were temperamentally resistant as young children and who experienced harsh parenting and lower peer social preference in early childhood had higher initial values of externalizing behavior and smaller increases or greater decreases in externalizing problems over time compared to their peers. We have not found similar analyses of growth curves of dysregulation. We expected that dysregulation would, like externalizing behavior growth curves, show meaningful individual differences that may be influenced by child temperament and social factors. Previous research has shown that (a) children who are temperamentally low in effortful control and high in negative emotionality tend to later show more dysregulation (Althoff et al., Reference Althoff, Ayer, Crehan, Rettew, Baer and Hudziak2012; Caro-Canizares, Garcia-Nieto, & Carballo, Reference Caro-Cañizares, García-Nieto and Carballo2015; Kim et al., Reference Kim, Carlson, Meyer, Bufferd, Dougherty, Dyson and Klein2012, Peyre, Speranza, Cortese, Wohl, & Purper-Ouakil, Reference Peyre, Speranza, Cortese, Wohl and Purper-Ouakil2015); (b) children who are elevated on this dysregulation profile are also more likely to have experienced parental hostility and punitive, controlling parenting behavior, compared to children who are not classified as dysregulated (Basten et al., Reference Basten, Althoff, Tiemeier, Jaddoe, Hofman, Hudziak and van der Ende2013; Caro-Canizares et al., Reference Caro-Cañizares, García-Nieto and Carballo2015; Kim et al., Reference Kim, Carlson, Meyer, Bufferd, Dougherty, Dyson and Klein2012); and (c) dysregulated children tend to have experienced more stressful life events and chronic interpersonal difficulties compared to other clinical samples (Jucksch et al., Reference Jucksch, Salbach-Andrae, Lenz, Goth, Döpfner, Poustka and Holtmann2011). The present study extends this past work by simultaneously testing the influences of temperament, parenting, stressful life events, peer relations, as well as language ability on the development of dysregulation both between and within children across time.
Implications of Dysregulation
Existing studies show that dysregulation predicts suicidality, bipolar disorder, anxiety, substance use disorders, and other externalizing disorders. These findings are important, and we attempt to replicate them. We also go beyond most of the existing literature to consider how predictions from dysregulation compare to predictions from the more standard CBCL constructs of externalizing and internalizing behavior, and to consider how dysregulation predicts functional outcomes, in addition to psychiatric diagnoses, in social, educational, occupational, and civic domains.
No previous studies have compared dysregulation and internalizing constructs, and only one study has compared the predictive utility of dysregulation to that of the overarching externalizing CBCL scale: Youngstrom, Meyers, Youngstrom, Calabrese, and Findling (Reference Youngstrom, Meyers, Youngstrom, Calabrese and Findling2006) found that the externalizing scale and the dysregulation profile were not significantly different in their prediction of juvenile bipolar disorder diagnoses. Two other studies compared dysregulation and its component subscales. When children with clinical levels (t ≥ 70) on all three AAA scales were compared to healthy controls and those with elevated aggression only, attention problems only, anxious/depressed only, or their combinations, dysregulated children received more severe ratings of psychosocial impairment compared to controls, but their impairment ratings were not significantly different from those of children with elevated aggression or elevated aggression and attention problems (Jucksch et al., Reference Jucksch, Salbach-Andrae, Lenz, Goth, Döpfner, Poustka and Holtmann2011). In another recent study, the dysregulation profile was shown to be more predictive of suicidality than its three component scales, but this was only true when mother, father, and youth reports were used. With teacher report, aggression was predictive of suicidality, but not dysregulation (Deutz et al., Reference Deutz, Geeraerts, van Baar, Deković and Prinzie2016). In a related study, Kahana, Youngstrom, Findling, and Calabrese (Reference Kahana, Youngstrom, Findling and Calabrese2003) found that parent report on the aggression scale was the most significant predictor (relative to other parent-reported CBCL scales and teacher-reported Teacher Report Form [TRF] scales) when distinguishing between children with bipolar spectrum disorders and children with disruptive behavior disorders and between children with and without bipolar spectrum disorders. Taken together, these studies not only illustrate the importance of incorporating information from multiple sources but also offer preliminary evidence suggesting that the CBCL externalizing scale may perform similarly to, if not outperform, the dysregulation scale in predicting outcomes. Comparing dysregulation to externalizing and internalizing problems can help explicate the developmental implications of dysregulation for adult functioning.
In addition, relatively few studies have examined functional impairment associated with dysregulation, other than psychiatric outcomes. Of those that have, few have used rich, comprehensive measures. For example, Jucksch et al. (Reference Jucksch, Salbach-Andrae, Lenz, Goth, Döpfner, Poustka and Holtmann2011) found that dysregulated children, relative to controls, had more severe psychosocial impairment, as measured by the Global Assessment of Psychosocial Disability. This single item assessed an individual's apparent adjustment in family, social, school, and/or work domains, ranging from 0 (superior/good functioning) to 8 (profound and pervasive psychosocial disability). Other studies have shown that higher scores on the AAA subscales are associated with worse child- and parent-reported psychosocial impairment, increased need for family accommodations, more treatment discontinuation, less social competency, and poorer academic performance (Ayer et al., Reference Ayer, Althoff, Ivanova, Rettew, Waxler, Sulman and Hudziak2009; McGuire et al., Reference McGuire, Small, Lewin, Murphy, De Nadai, Phares and Storch2013; Spencer et al., Reference Spencer, Faraone, Surman, Petty, Clarke, Batchelder and Biederman2011). The present study builds on these prior findings by examining associations between childhood dysregulation and a comprehensive variety of functional adult outcomes, including self-reported friendship quality, employment, educational attainment, arrests, convictions, and problems due to substance use.
The Present Study
In a community sample of children followed annually from age 5 to age 28, we tested a continuous measure of dysregulation, with even weighting of the AAA subscales and multiple informants (i.e., mother and teacher), among other indexes of dysregulation, to answer a methodological question of how dysregulation should be measured and three substantive questions:
1. What theoretically relevant factors (i.e., temperament, parenting strategies, stressful life events, language ability, peer acceptance, and potential interactions between them) are involved in individual differences in the development of dysregulation?
2. What are the developmental implications of childhood dysregulation for a broad range of adult outcomes?
3. How do these dysregulation outcomes compare to those for more widely studied externalizing and internalizing factors, because we wished to learn what unique information, if any, is gained by studying the combination of anxious/depressed, attention, and aggression problems relative to the two main Achenbach factors, externalizing and internalizing?
For the antecedents of dysregulation, we hypothesized that child temperament would partially explain individual differences in dysregulation over time, as suggested by prior studies (Caro-Canizares et al., Reference Caro-Cañizares, García-Nieto and Carballo2015; Kim et al., Reference Kim, Carlson, Meyer, Bufferd, Dougherty, Dyson and Klein2012). In particular, we expected children who are highly unadaptable, difficult, or resistant to control to have higher initial levels of dysregulation and possibly steeper growth curves, compared to their peers. We also anticipated significant interactions between these temperament constructs and environmental factors included in our model. Based on prior work, we expected parenting strategies, especially the critical dimensions of warmth, effective control, and harsh control, to affect the trajectory of dysregulation in childhood (Jucksch et al., Reference Jucksch, Salbach-Andrae, Lenz, Goth, Döpfner, Poustka and Holtmann2011; Kim et al., Reference Kim, Carlson, Meyer, Bufferd, Dougherty, Dyson and Klein2012). We hypothesized that stressful life events in the family would affect dysregulation, but we anticipated this effect would be amplified in the context of ineffective parenting strategies (Pettit, Bates, & Dodge, Reference Pettit, Bates and Dodge1997; Schermerhorn et al., Reference Schermerhorn, Bates, Goodnight, Lansford, Dodge and Pettit2013). In addition, because children advanced in language may use this skill for adaptive self-regulatory strategies (Petersen, Bates, & Staples, Reference Petersen, Bates and Staples2014), we hypothesized that language ability would also affect individual differences in the trajectories of dysregulation. Finally, we hypothesized that peer acceptance would modulate individual growth trajectories, especially because dysregulated children may become even more anxious, withdrawn, or aggressive as they experience more peer rejection (Laird, Jordan, Dodge, Pettit, & Bates, Reference Laird, Jordan, Dodge, Pettit and Bates2001).
For the consequences of dysregulation, we hypothesized that childhood dysregulation would be associated with DSM-IV psychiatric disorders, replicating past research, as well as the various other functional outcome measures. Finally, we also asked whether the association between dysregulation and adult outcomes would be as strong as or stronger than the correlation between the more established scales of externalizing and internalizing problems and adult outcomes. To our knowledge, only one study has conducted a related comparison between the dysregulation and externalizing constructs (Youngstrom et al., Reference Youngstrom, Meyers, Youngstrom, Calabrese and Findling2006), but no studies have compared predictions from dysregulation, externalizing, and internalizing to a variety of adult outcomes. This comparison could further enrich the construct of dysregulation for the study of developmental psychopathology. In addition to considering a scale's links and nonlinks to other conceptually relevant measures, for practical purposes it could also be useful to consider how a scale might equal, surpass, or complement a more established scale.
Method
Participants
Children (N = 585) were recruited for the Child Development Project (Dodge, Bates, & Pettit, Reference Dodge, Bates and Pettit1990) in 1987 and 1988 from three sites: Nashville, Tennessee; Knoxville, Tennessee; and Bloomington, Indiana. Parents preregistering their child for kindergarten were approached at random, and by design, parents of later enrollees were approached on the first day of class, and by phone or mail. Approximately 75% of those approached agreed to participate. The sample reflected a broad range of Hollingshead socioeconomic levels, representative of the populations at the respective sites (M = 39.53, SD = 14.01, range = 8–66). The sample was 52% male, 81% European American, 17% African American, and 2% other ethnicity. The rates of missingness for each measure are provided in online-only supplementary Table S.1.
Measures
Dysregulation
Mothers annually completed the CBCL in the summer or fall and teachers annually completed the TRF (Achenbach, Reference Achenbach1991) in the spring when children were aged 5–13. The construct of dysregulation can be operationalized in multiple ways, even using just the Achenbach AAA subscales. We operationalized dysregulation in three primary ways, using separate analyses for each: one with mother report, a second with teacher report, and a third (maximum score) using the higher per-item rating (either mother's or teacher's), in accordance with the disjunctive “or” rule described previously (Youngstrom et al., Reference Youngstrom, Findling and Calabrese2003). The Cronbach α internal consistency values of the dysregulation scales ranged from 0.90 to 0.94 for mothers on the CBCL, and 0.94 to 0.97 for teachers on the TRF, depending on the year. The Cronbach α values for the maximum dysregulation score, using the disjunctive “or” rule, ranged from 0.92 to 0.95, depending on the year. Given the uneven numbers of items on the subscales and our failure to find a theoretical argument in the literature for differentially weighting the subscales, we divided the summed subscale scores by the number of items contained in each subscale, creating an average rating per item on each of the three subscales. The per-item subscale scores were then summed to create the final, evenly weighted AAA mother score, teacher score, and maximum score, each of which could theoretically range from 0 (no dysregulation) to 6 (extreme dysregulation), consistent with previous research (McGuire et al., Reference McGuire, Small, Lewin, Murphy, De Nadai, Phares and Storch2013). The observed range was 0 to 4.56 for mother report, 0 to 4.88 for teacher report, and 0 to 4.95 for the maximum score. If only one informant (either mother or teacher) reported on child behavior during a wave of data collection, the maximum score was composed of the available report by default. The majority of the sample, 65%, had mother, teacher, or both reports at every wave of data collection for child ages 5–13.
For the sake of evaluating our three primary, evenly weighted indexes, we also formed and tested a continuous simple dysregulation average (i.e., the typical AAA aggregate index in which scales with more items count more), as well as a continuous T score (the average T score for the three AAA subscales), a categorical index, and a multiplicative profile score. Both mother and teacher report were used separately for all four of these additional dysregulation measures. For the categorical index, children were classified as either dysregulated (1) or not (0) based on whether their T score for each AAA scale was ≥60. We elected to use a T score of 60, rather than the clinical cutoff of 70, based on the characteristics of the present community sample. Individuals with a T score ≥70 were extremely rare (i.e., in the 99th percentile for our sample), whereas using a T score ≥60 encompassed the top quartile of the sample and is consistent with previous studies conducted with similar samples (Meyer et al., Reference Meyer, Carlson, Youngstrom, Ronsaville, Martinez, Gold and Radke-Yarrow2008; Spencer et al., Reference Spencer, Faraone, Surman, Petty, Clarke, Batchelder and Biederman2011). For the multiplicative dysregulation index, the average per-item ratings for each subscale, ranging from 0 to 2, were rescaled to range from 1 to 3 and then multiplied together (rescaled average item rating for aggression × r-scaled average item rating for attention problems × rescaled average item rating for anxious/depressed symptoms). The final multiplicative index could therefore theoretically range from 1 to 27. The observed range was 1.01 to 10.40 for mother report and 1.00 to 7.78 for teacher report.
Externalizing and internalizing symptoms
Derived from the CBCL and TRF, the externalizing scale was comprised in the standard way of the aggression, attention problems, and rule-breaking (delinquency) subscales, and the internalizing scale was composed of the anxious/depressed, withdrawn, and somatic complaints subscales. The Cronbach α values of externalizing problems ranged from 0.88 to 0.92 for mothers on the CBCL, and 0.94 to 0.96 for the teachers on the TRF, depending on the year. Cronbach α values for internalizing problems ranged from 0.81 to 0.90 for mothers and 0.85 to 0.91 for teachers, depending on the year.
Potential predictors of change in dysregulation
Child temperament
At the start of the study, when children were 5 years old, mothers reported on child temperament during infancy, using the Retrospective Infant Characteristics Questionnaire (Bates, Pettit, Dodge, & Ridge, Reference Bates, Pettit, Dodge and Ridge1998). We used three subscales from this measure: difficult, unadaptable, and resistant to control. Difficult temperament (α = 0.86) was measured by nine items related to the child's negative emotionality (e.g., how easily upset and how often fussing/crying). Unadaptable temperament (α = 0.72) was measured by four items related to negative reactions to novelty (new food, people, places, and adaptation in general). Resistance to control (α = 0.83) was measured by how often the child persisted in playing with objects when told to leave them alone, continued to go someplace even when told to stop, and got upset when removed from something he or she was interested in but should not have been getting into. Ratings on each item ranged from 1 to 7, with higher values representing less optimal temperament traits (more difficultness, unadaptability, or resistance to control).
Early parenting strategies
At Wave 1 of data collection (child age 5), three measures of parenting were used: mother interview on typical responses to misbehavior (Lansford, Staples, Bates, Pettit, & Dodge, Reference Lansford, Staples, Bates, Pettit and Dodge2013), observer report on parenting tactics witnessed during a home visit (Pettit et al., Reference Pettit, Bates and Dodge1997), and a Concerns and Constraints mother interview (Deater-Deckard, Dodge, Bates, & Pettit, Reference Deater-Deckard, Dodge, Bates and Pettit1996).
In the Response to Misbehavior Self-Report Interview, mothers reported their use of time-out and removal of privileges (r = .27, p < .001), as well as spanking and scolding (r = .18, p < .001), summed into scales of effective control and harsh control, respectively. Two research assistants visited the home and recorded the occurrence (occurred = 1, did not occur = 0) of maternal warmth (i.e., mother accepting positive physical contact from the child, mother initiating positive physical contact with the child, mother using a positive tone toward the child, and mother's positive attitude). Interrater agreement was substantial (r = .58), so the eight items (four from each of the two visitors) were averaged, in accordance with the procedure used by Pettit et al. (Reference Pettit, Bates and Dodge1997). The Cronbach α internal consistency value for these items was 0.62. In the Concerns and Constraints Interview, mothers heard five hypothetical scenarios about child misbehavior and were asked how they would typically respond. Research assistants coded mothers’ responses as either proactive (i.e., prevention and proactive guidance) or reactive (i.e., do nothing, power assertion, punishment, or reasoning with the child), and we summed these ratings across the five stories. The Cronbach α internal consistency value for the proactive score was 0.53 and 0.87 for the reactive score.
Stressful life events
Family stress was measured at child ages 5–13, using maternal report on the Changes and Adjustments Questionnaire (Dodge, Pettit, & Bates, Reference Dodge, Pettit and Bates1994). A list of 17 stressful life events (e.g., moving, home repair, birth of a child, marital separation, and death in the family) was provided, and mothers were asked to indicate whether each had occurred in the past year. The sum of endorsed stressors was used in all subsequent analyses.
Early social preference
During the spring of kindergarten and Grades 1, 2, and 3, all classroom peers of each child participant (for whom written parental consent was obtained) were asked to nominate up to three peers whom they liked the most and three other peers whom they liked the least. Following procedures used by Coie, Dodge, and Coppotelli (Reference Coie, Dodge and Coppotelli1982) and Dodge, Lochman, Harnish, Bates, and Pettit (Reference Dodge, Lochman, Harnish, Bates and Pettit1997), nomination scores received by each classroom peer were summed and standardized within each classroom. We computed a standardized social preference score for each year by subtracting the disliking score from the liking score, and then averaged across the 4 years to yield a single score for early social preference (α = 0.70).
Child language ability
Language ability was measured as the child's percentile score on the language sections of a nationally normed standardized academic achievement test, collected annually via official school records. The composite language ability score reflected the average of two types of subtests: language mechanics and language expression. Language mechanics assessed children's use of Standard English through correct grammar and conventions, usage of words and phrases, and sentence structure. Language expression assessed children's ability to communicate effectively through rules of writing. Standardized tests were administered during the school year, and with parent permission, school administrators allowed us to record achievement test scores at the end of the school year. School records from ages 7 to 10 years were collected when the children were 10 years old, and school records from ages 11 to 13 years were collected in the summer after each school year. In the present study, the correlations between language mechanics and language expression scores ranged from .57 to .78 (p < .001), depending on the year of data collection. Because the sample reflected students in different schools, school districts, and states, the actual standardized test administered differed between participants, but all students’ scores were scaled according to national norms for their test. Language ability scores across ages were averaged to create a single language ability score.
Outcomes
Psychiatric disorders
Trained, advanced assistants used the Diagnostic Interview Schedule (Robins, Reference Robins1985), a semistructured, DSM-IV diagnostic interview, when participants were 18 years old. We counted the number of disorders on which a participant met diagnostic criteria. Partial diagnostic criteria were also counted for conduct disorder, bulimia nervosa (when all diagnostic criteria were met except for the exclusion criteria), alcohol abuse (when all diagnostic criteria were met except for the exclusion criteria), and alcohol dependence (when all diagnostic criteria were met but the participant reported no impairment). We counted these partial diagnoses to be inclusive of all psychiatric conditions and to avoid overlooking important, but subthreshold, patterns of adjustment. We further grouped the disorders into internalizing (i.e., anxiety, depressive, and somatic disorders) and externalizing (i.e., substance abuse, attention-deficit/hyperactivity disorder, aggression, antisocial personality disorder, conduct disorder, and oppositional defiant disorder) categories, and counted the number of disorders in each category.
Friendships
At ages 19–20 and 22–24, participants annually reported whether or not they had a best friend, which we then averaged across the five waves. At ages 19–20, participants also annually rated the quality of their friendship on a 5-point Likert scale, where 1 indicated strongly disagree and 5 indicated strongly agree on four items (i.e., whether they felt they had a friend who would help them, to whom they could tell their problems, who makes them happy, and with whom they spend free time). Internal consistency for friendship quality was 0.74 at age 19, and 0.90 at age 20. We averaged the scores from the two waves to create a quality of friendship variable.
Employment
At ages 19–24, participants reported whether they were unemployed (and not a student), working part time (less than 35 hours per week), or working full time (more than 35 hours per week), scored as 0, 1, and 2, respectively, and averaged across waves. Participants’ occupation scores could range from 0 (unemployed at all waves) to 2 (working full time at all waves). When participants were 28 years old, they retrospectively reported their longest period of unemployment in months, how many times they had been promoted at a job, and how many times they had been fired or laid off from a job.
Educational attainment
Participants rated their highest level of education at age 28; we scored high school diploma or a GED as 1, associate's or technical degree as 2, bachelor's degree as 3, and postgraduate degree as 4. Participants who did not complete high school received a score of 0. A few participants were scored as 2 for obtaining a technical degree, even though they had not reported obtaining a high school diploma or GED.
Criminal history
At age 27, participants reported whether they had ever been arrested, and if so, whether they were convicted of a crime. Participants also reported their age at first arrest, if applicable.
Suicidality
At ages 20–24, participants reported suicidality (i.e., suicidal ideation and self-harm behaviors) via two questions (i.e., “Do you ever think about killing yourself?” and “Do you ever harm yourself?”) on the Youth Self-Report form for ages 20–22 (Achenbach & Rescorla, Reference Achenbach and Rescorla2001) and the Young Adult Self-Report form for ages 23–24 (Achenbach, Reference Achenbach1998), with responses not true (0), sometimes true (1), or often true (2). We dichotomized the outcome of suicidality by assigning 1 to individuals who endorsed sometimes true or often true, and 0 to not true. We then summed the scores across the 4 years.Footnote 1
Services used
When participants were aged 22, 23, and 24, they completed the Brief Services Assessment for Children and Adolescents (Stiffman et al., Reference Stiffman, Horwitz, Hoagwood, Compton, Cottler, Bean and Weisz2000) to report ever: (a) staying overnight in an inpatient mental health service, treatment center, foster home, or juvenile justice facility; (b) receiving help from counselors or therapists for behavioral or drug problems; or (c) receiving school services for behavioral or emotional problems. We summed the endorsement of the three questions over the 3 years.
Problems due to substance use
Participants completed the Tobacco, Alcohol, and Drugs Survey (Center for Human Resource Research, Ohio State University; http://bls.gov.nls/) when they were 27 years old. We asked participants if they had ever experienced impairment in daily functioning due to alcohol or drug problems, such as unhappiness, financial problems, accidents, and interpersonal relationship difficulties. We summed the endorsed responses on these 15 items.
Results
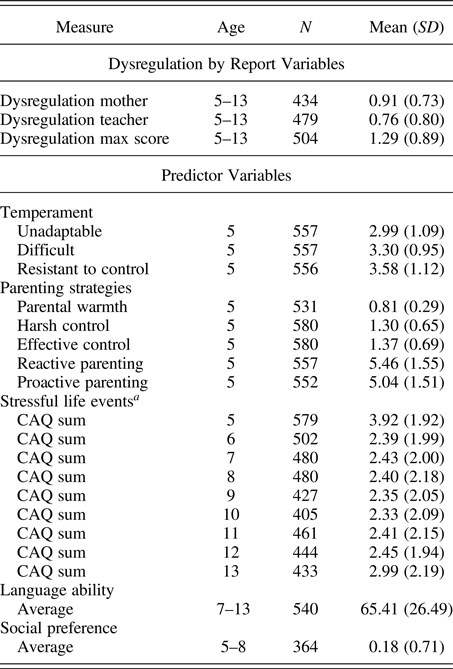
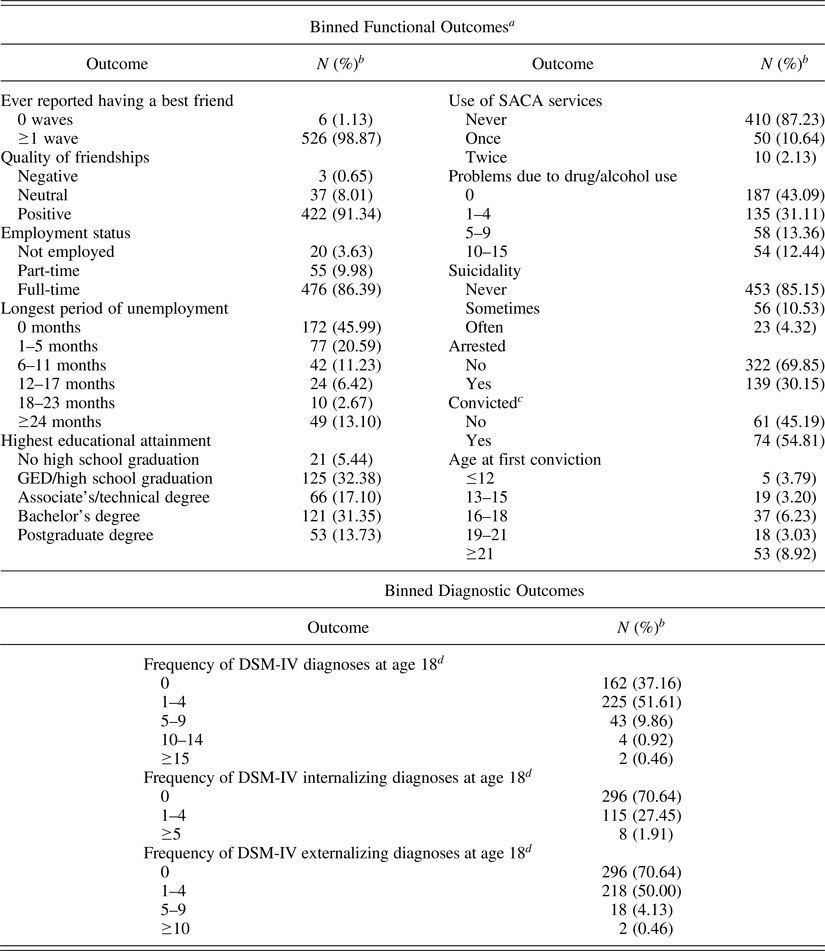
Descriptives of child dysregulation from mother, teacher, and maximum scores averaged across ages 5–13, as well as descriptives for all predictor variables (i.e., child temperament, parenting practices, stressful life events, early social preference, and language ability), are provided in Table 1. The correlations between these predictor variables and dysregulation are provided in online-only supplementary Table S.4. Outcome measures are described in Table 2 and online-only supplementary Table S.3.
Descriptives of dysregulation by reporter and predictor variables

Note: Descriptives for dysregulation at each age are provided in online-only supplementary Table S.2.
aRepresents a time varying predictor; all other predictors are time invariant.
Distribution of impaired functioning and diagnostic outcomes
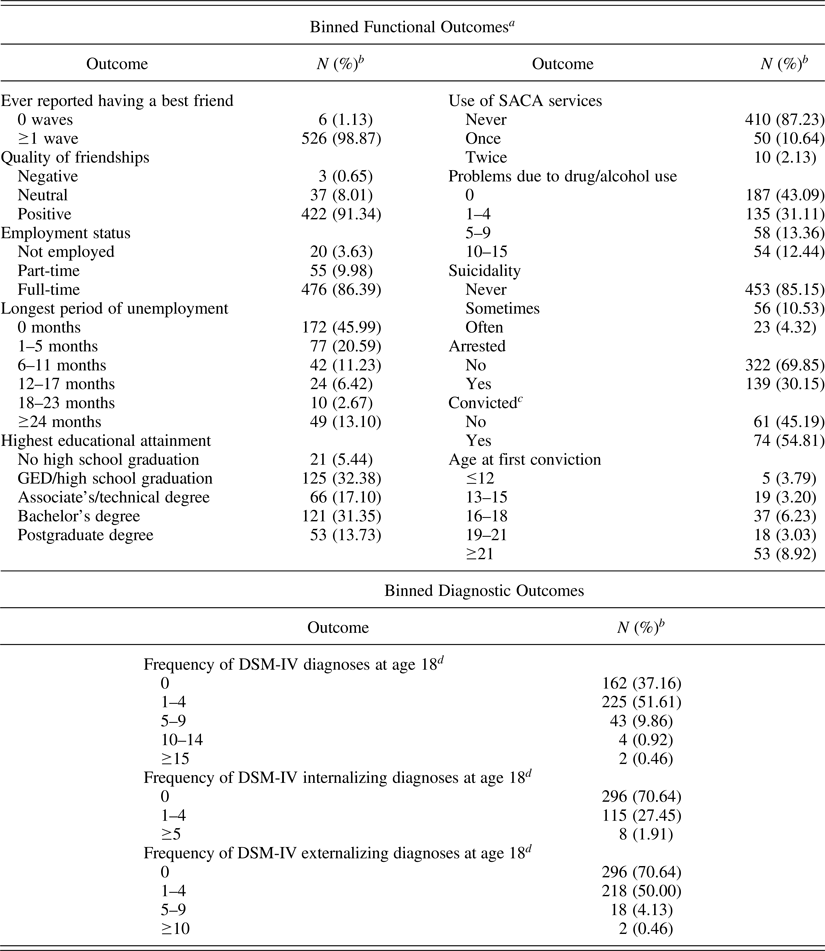
aAll variables were continuous for analyses. They were only categorized/binned by response option for the purposes of this table. Descriptives of continuous variables are provided in online-only supplementary Table S.3.
bPercentages based on the available number of participants for each outcome (see online-only supplementary Table S.3 for sample sizes and average ratings for each measure).
cOnly individuals who had been arrested indicated whether they had been convicted of a crime.
dThe frequency of DSM-IV diagnoses was determined by counting the number of disorders on which a participant met partial or full diagnostic criteria.
Growth curve models of dysregulation
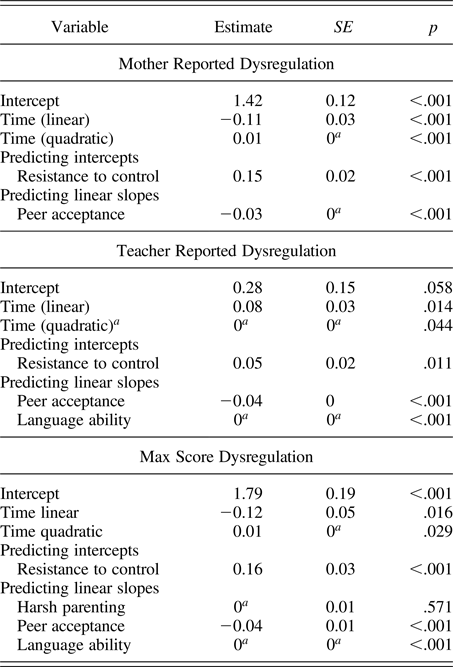
Hierarchical linear modeling was conducted in SAS 9.4 (SAS Institute, 2013) using the proc-mixed procedure for modeling dysregulation differences between and within children across time. Iterative model building was conducted separately for mother-reported, teacher-reported, and maximum score dysregulation, and the final model for each measure of dysregulation is reported in Table 3.
Final models of antecedents of dysregulation
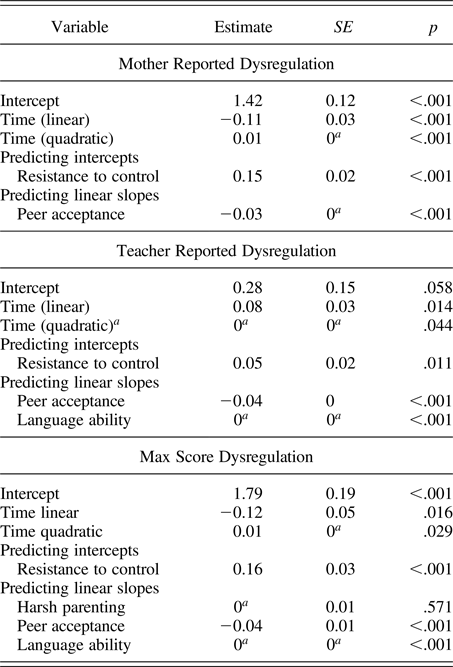
aThe estimate for language ability predicting teacher-reported dysregulation (–0.001) was too small to be visible with two decimal places, as was the fixed quadratic effect for time (–0.004). For the maximum dysregulation score, the estimates for harsh parenting (0.004) and language ability (–0.001) were also too small to be visible with two decimal places. Predictors were added using forward selection. The model building process and summary of modeling decisions is outlined in online-only supplementary Table S.6.
bIndicates a fixed effect.
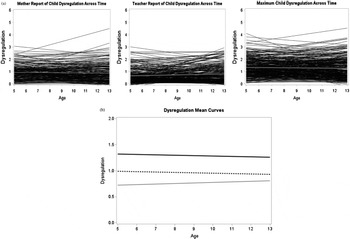
We first computed an unconditional means model with random intercepts for each measure of dysregulation. We found considerable variance between children and within children (see online-only supplementary Table S.5), suggesting that the average child's level of dysregulation varies over time and that the mean levels of dysregulation differ between children. Approximately half of the variability in dysregulation was between children (intraclass correlation values ranged from .48 to .65, depending on the measure of dysregulation), warranting a multilevel modeling approach. To account for change in dysregulation over time, we fit unconditional growth models for each measure of dysregulation, using random intercepts and a linear random slope for time. For all measures of dysregulation, the unconditional growth model fit better than the unconditional means model, χ2 (3) = 122.5, 288.2, and 81.3, with p < .001, for maximum score, mother report, and teacher report, respectively, indicating that dysregulation changes over time. We also found that trajectories of dysregulation differed between children because, for each measure of dysregulation, the model with a random effect of time fit better than a model with a fixed effect for time, χ2 (2) = 118.2, 281.9, and 58.5, with p < .001, for maximum score, mother report, and teacher report, respectively. Given this evidence for random intercepts and random linear slopes (reflected graphically in Figure 1), all subsequent models included these parameters.
Linear regression lines of mother, teacher, and maximum dysregulation scores and child age. (a) The black lines represent individual trajectories; overlaid gray lines represent the average trajectory for the whole sample. Linear trajectories are displayed, as this form of growth was used in all subsequent models. (b) The solid black line represents the mean linear curve for maximum score, the dashed black line represents the mean linear curve for mother-reported dysregulation, and the solid gray line represents the mean linear curve for teacher-reported dysregulation.

Next, we examined quadratic forms of change to determine whether dysregulation follows a curvilinear trajectory. For maximum and mother-reported dysregulation, random quadratic forms of change fit significantly better than a random linear model, χ2 (4) = 54.1 and 103.5, p < .001, for maximum score and mother report, respectively. For teacher-reported dysregulation, there was not adequate variability across children in the quadratic curves for the quadratic model to converge so a fixed quadratic effect was evaluated. The model with a fixed quadratic effect fit significantly better than the model without this quadratic term, χ2 (4) = 830.5, p < .001, meaning that the inclusion of a quadratic form of growth improved model fit for all three measures of dysregulation, but this quadratic term did not vary randomly across children when teacher report was modeled. All subsequent models included a linear and quadratic effect for time, indicating that although change in dysregulation across time is minimal, it seems to follow a curvilinear trajectory. One noteworthy difference between measures of dysregulation, in addition to the fixed quadratic effect used for teacher-reported dysregulation, is that teacher-reported dysregulation followed a positive linear trend with a negative quadratic (convex) curve, while the other two measures of dysregulation followed opposite trajectories, with a negative linear trend and a positive quadratic (concave) curve. This means that, on average, teacher-reported dysregulation increased slightly until early adolescence, when this growth leveled out, while mother-reported and maximum dysregulation declined slightly with age until early adolescence when dysregulation stabilized.
Once the best forms of growth were determined, we then tested predictors of the linear growth parameters, using centered predictors for the sake of meaningful interpretation of the intercept (i.e., the average level of dysregulation at age 5). Centering is critical for interpretation of the intercept when the raw metric of a predictor variable does not have a meaningful zero point (Enders & Tofighi, Reference Enders and Tofighi2007). We grand-mean centered time invariant predictors (i.e., child temperament, exposure to various parenting practices at age 5, average social preference across ages 5 to 8, and average language ability across ages 7 to 13) so that the intercept would reflect average dysregulation at age 5 for an average child, as time-invariant predictors were estimated relative to the sample average. This grand-mean centering approach is standard for time-invariant predictors in multilevel models (Enders & Tofighi, Reference Enders and Tofighi2007) and is consistent with general recommendations in ordinary least squares regression (Aiken & West, Reference Aiken and West1991). The time-varying predictor of stressful life events was group-mean centered using Time 1 centering to reflect each individual's frequency of stressful life events at Time 1 (child age 5) and the increment or decrement from that initial value at each subsequent time point (Singer & Willett, Reference Singer and Willett2003). Centering time-varying predictors around a fixed point in time in this way is recommended for longitudinal studies (Enders & Tofighi, Reference Enders and Tofighi2007). These centering decisions provide a meaningful intercept that reflects a child's initial value of dysregulation at age 5 with substantively interpretable parameter estimates and standard errors for the intercepts (Biesanz, Deeb-Sossa, Aubrecht, Bollen, & Curran, Reference Biesanz, Deeb-Sossa, Aubrecht, Bollen and Curran2004; Singer & Willett, Reference Singer and Willett2003).
Each predictor was examined in relation to dysregulation via forward selection in hierarchical linear modeling growth curves, which tends to be a more accurate and conservative procedure for predictor selection compared to backward elimination (Derksen & Keselman, Reference Derksen and Keselman1992). The forward selection model building steps are summarized in online-only supplementary Table S.6. We first tested the effect of child temperament on randomly varying intercepts to determine how temperamental predispositions may predict individual differences in initial levels of dysregulation. The correlations listed in online-only supplementary Table S.4 demonstrate that resistance to control and difficultness were more strongly associated with dysregulation than was unadaptability (with average r values across time points and measures of dysregulation = .23, .14, and .04 respectively). Consistent with these bivariate correlations, only resistance to control and difficultness were significantly predictive of initial levels of dysregulation, while unadaptability was not. Across measures of dysregulation, the best fitting models included resistance to control and excluded difficultness. This too was not surprising, given the preliminary correlations demonstrating stronger associations between dysregulation and resistance to control than those between dysregulation and difficultness.
Differences in the intercept of dysregulation were thus explained by resistant temperament, and predictors of differences in the linear trajectories of dysregulation were examined next. We focused on explaining individual differences in linear growth for consistency across measures and ease of interpretation because each of the three primary measures of dysregulation included random linear time effects, and not all of the measures included the same quadratic effect. We examined the extent to which linear change in dysregulation depended upon early exposure to various parenting practices, stress, social preference, and language ability. For mother-reported dysregulation, no measure of parenting practices (i.e., harsh discipline, reactive parenting, proactive parenting, effective control, or observed warmth) affected growth in dysregulation. Moreover, interactive effects between these parenting practices and stress or child temperament also did not significantly predict change in mother-reported dysregulation. For teacher-reported dysregulation, however, children whose parents were proactive and warm had less growth in dysregulation, although these effects diminished and were no longer significant when all other predictors were added to the model (including random linear and fixed quadratic effects for time, resistance to control explaining the intercept, and peer acceptance and language ability explaining linear change in dysregulation). Harsh parenting significantly predicted growth in dysregulation defined by the maximum score. Adding harsh parenting to the model significantly improved fit compared to a model that only included resistance to control and random time effects, χ2 (1) = 4,196.3, p < .001. When other predictors were added to the model, namely, child language ability and peer acceptance, harsh parenting was no longer predictive of growth in dysregulation to a statistically significant degree. However, the final model fit better when harsh parenting was still included as a predictor compared to when a simpler model was used, χ2 (1) = 2,122, p < .001. Thus, parenting practices were overall not significantly associated with linear change in dysregulation, although harsh parenting was retained in the final model for the maximum score of dysregulation because the inclusion of this predictor significantly improved model fit.
Stressful life events had no effect on change in dysregulation over time, regardless of the measure of dysregulation used. In contrast, peer acceptance was associated with less growth in dysregulation, across the three primary measures of dysregulation. Finally, the linear growth of dysregulation further depended upon child language ability, such that children with more advanced language skills had less growth in dysregulation, when dysregulation was defined by the maximum score or teacher report. It is important to note the substantially lower intercept in teacher-reported dysregulation (i.e., 0.23 compared to 1.42 and 1.79 for mother-reported and maximum score dysregulation, respectively). As expected, the maximum score dysregulation had the highest intercept, and the low intercept for teacher-reported dysregulation suggests that teachers report few signs of dysregulation at child age 5, when we statistically control stress, peer acceptance, language ability, and parenting practices. In short, lower peer acceptance was associated with growth in dysregulation across measures, and poor language skills in early childhood further predicted growth in dysregulation as defined by teachers and the disjunctive “or” rule, despite the notable distinctions between these measures.
We calculated a pseudo-R 2 value for each final model by examining the squared correlation between predicted and observed values (Singer & Willett, Reference Singer and Willett2003). The pseudo-R 2 for the final maximum score and teacher-reported models of dysregulation were .257 and .259, respectively, while the model with mother-reported dysregulation had a pseudo-R 2 value of only .156, suggesting that more of the variability in dysregulation could be explained when measures of dysregulation included the perspective of the teacher. The models with teacher-reported and maximum score dysregulation fit the data well and accounted for about 26% of the variability in dysregulation over time.
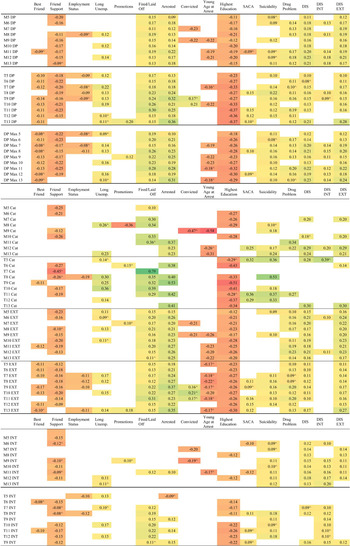
Correlation heat maps
We used a heat map to visualize and examine the associations between dysregulation and clinical and nonclinical outcomes, and compare the strength of these correlations to those with teacher- and mother-reported externalizing and internalizing CBCL and TRF scales (see Figure 2). Sixty-four percent of the tested correlations between our three primary measures of dysregulation and adjustment outcomes were statistically significant. The patterns of significant associations suggest that children who displayed higher levels of dysregulation, as indicated by mother-reported, teacher-reported, and the maximum score, were less likely to report having a best friend, having supportive friendships, being employed, or attaining higher education. Children with higher levels of dysregulation were also more likely to report longer periods of unemployment, getting fired or laid off, being arrested, being a young age at first arrest, using social services, and having suicidal thoughts or actions, drug problems, or DSM-IV diagnoses. Relative to the links between the three primary measures of dysregulation and adult outcomes (r range = .09–.37 across measures for statistically significant associations), the categorical measure of dysregulation had stronger associations with promotions (r = –.36), young age at first arrest (r = –.58), friend support (r = –.45), getting fired or laid off (r = .79), education attainment (r = –.51), and suicidality (r = .53), such that children who were categorically classified as dysregulated at certain ages by teacher or mother report tended to have fewer promotions, be arrested at a younger age, report less supportive friendships, experience more job loss, attain lower levels of education, and report more suicidality. However, there were no statistically significant differences in the associations between dysregulation measures and the outcomes when collapsed across ages (see online-only supplementary Table S.7), except for highest level of educational attainment, which actually showed that the teacher-reported per-item rating of dysregulation was more strongly associated with lower levels of educational attainment (r = –.39) than the link between teacher-reported categorical index and education attainment (r = –.27), as confirmed by Fisher's (Reference Fisher1921) r-to-z transformation (z = 2.29, p < .05). The multiplicative measure of dysregulation was highly correlated with our other measures of dysregulation (see online-only supplementary Table S.9) and had similar associations with adjustment outcomes as those described above (see online-only supplementary Table S.10).
(Color online) Heat map of correlations by age between dysregulation, externalizing, and internalizing scales and outcomes. All correlations are significant at p < .05, two-tailed. Correlations trending toward significance are represented by a small caret (^). Green (online only) represents stronger positive correlations, and red (online only) indicates stronger negative correlations. M DP, mother-reported dysregulation profile; T DP, teacher-reported dysregulation profile; DP Max, maximum score for the dysregulation profile; M and T Cat, mother- and teacher-reported categorical dysregulation indexes, respectively; M EXT, mother-reported externalizing; T EXT, teacher-reported externalizing; M INT, mother-reported internalizing; T INT, teacher-reported internalizing score; DIS, Diagnostic Interview Schedule, which was used to determine the number of psychiatric disorders for which participants met full or partial diagnostic criteria. See online-only supplementary Table S.7 for a summary table of average correlations across ages.
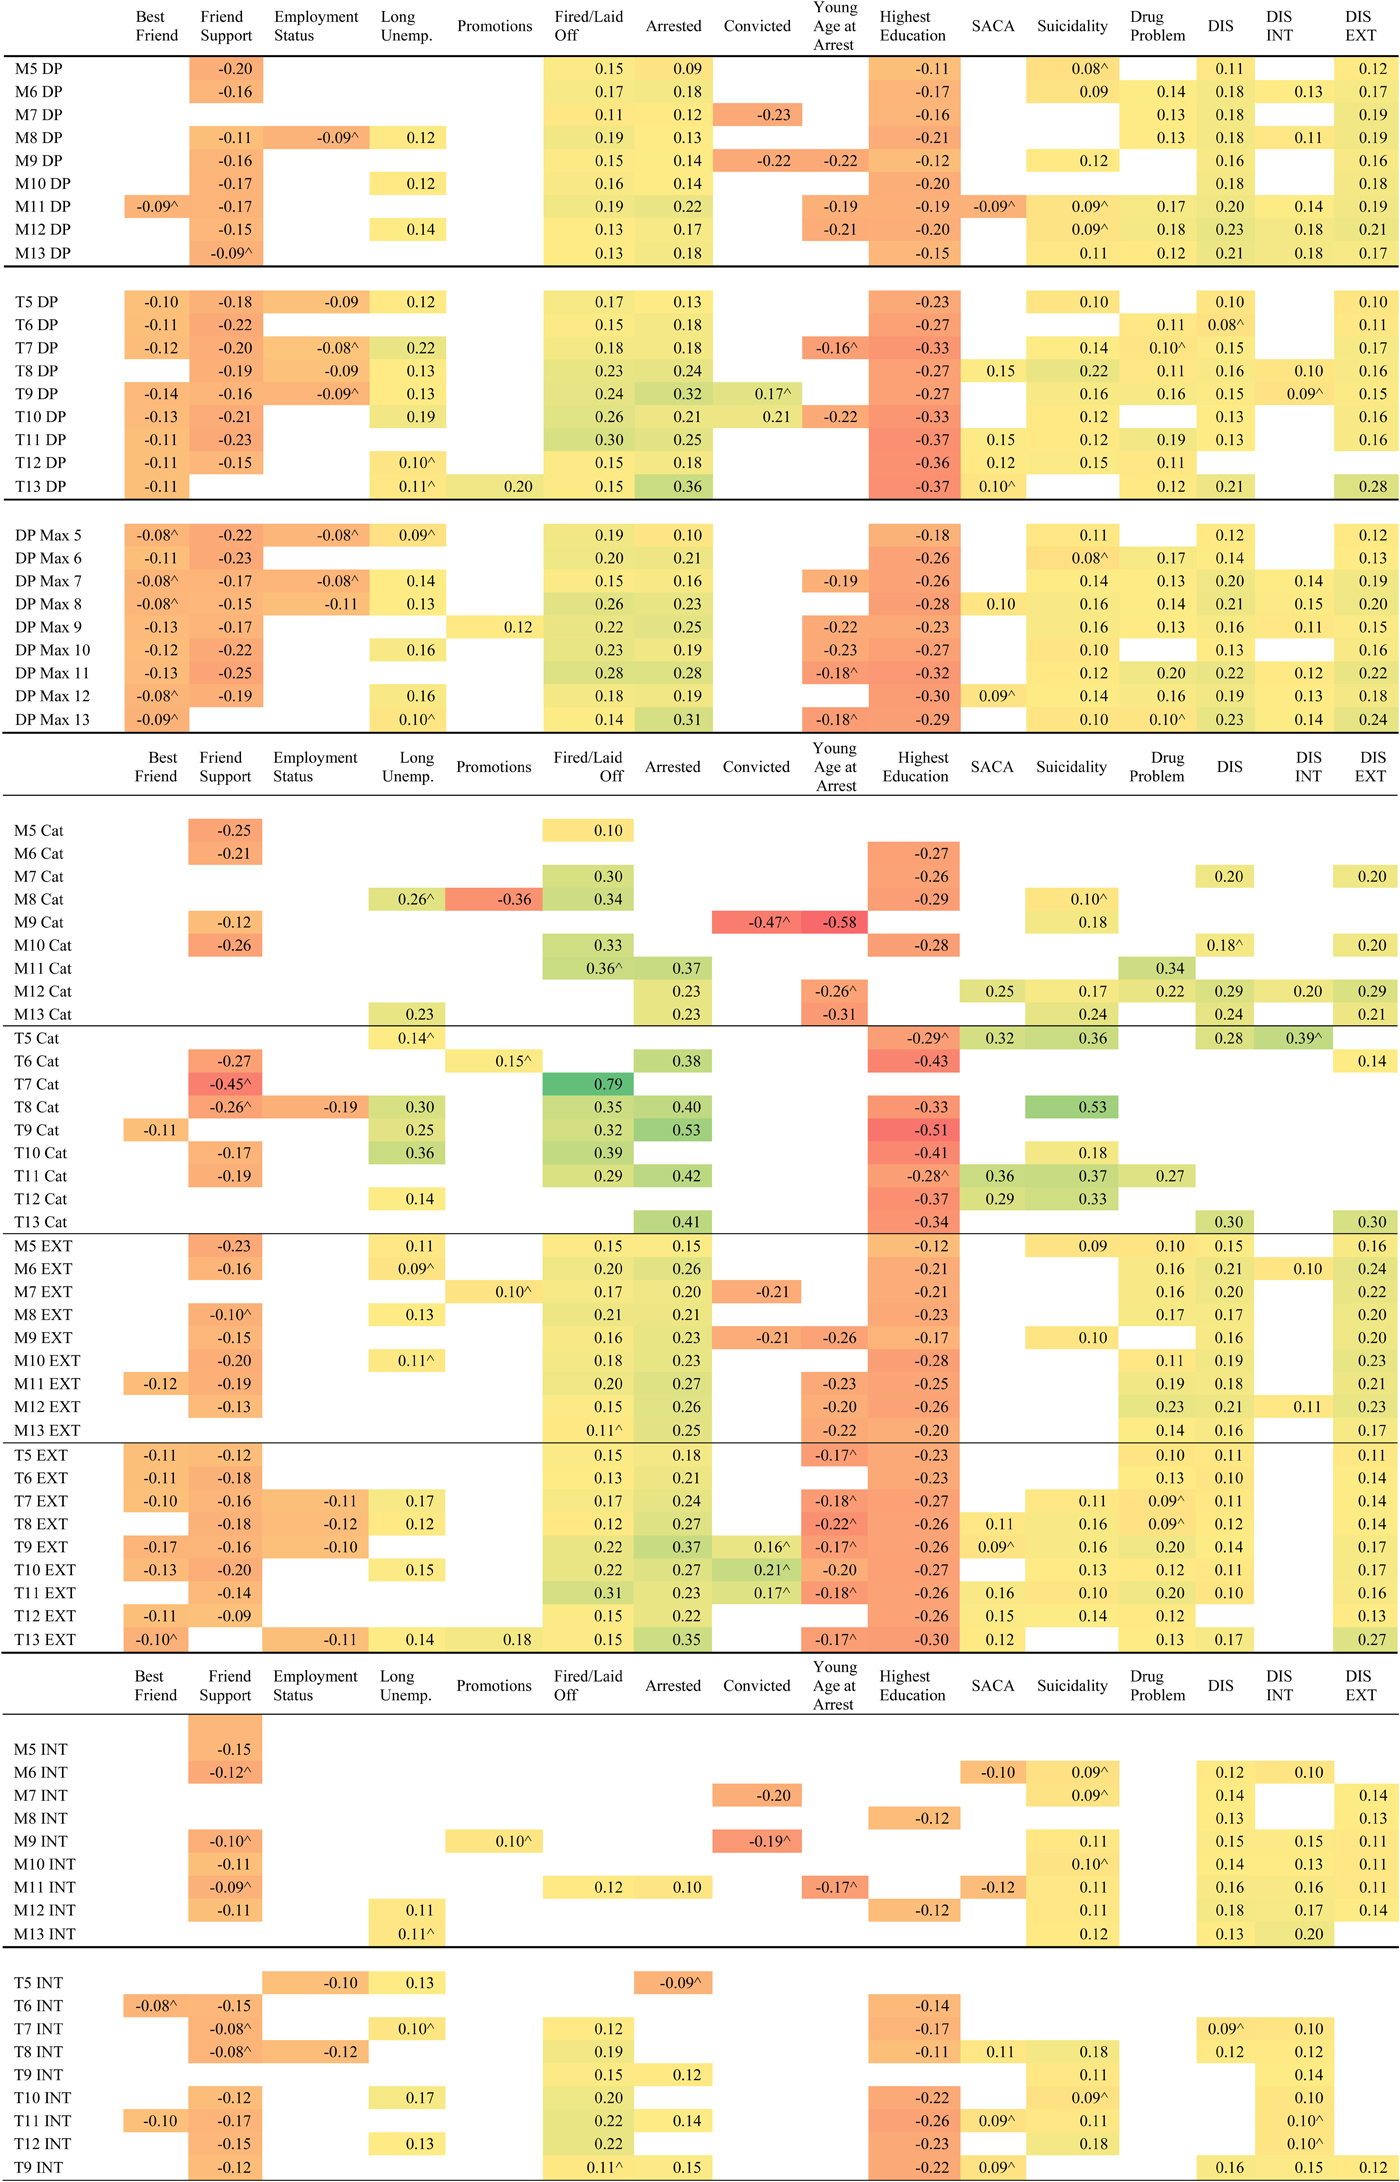
Figure 2 suggests several other patterns. There were more significant correlations for the maximum dysregulation score (101) compared to teacher (95) or mother reports (81) alone, but the strength of the associations between dysregulation and adjustment outcomes was similar with either the maximum score or teacher report, both of which were slightly stronger than the average association between mother-reported dysregulation and adjustment outcomes (r = .18 on average for maximum score and teacher report, but only .16 on average for mother report). Dysregulation (from mother, teacher, or maximum score) was not more strongly predictive of outcomes than mother or teacher externalizing was, but dysregulation was more highly predictive than internalizing. The dysregulation and externalizing problems scales seem to be equally related to psychiatric and functional outcomes, which would be expected given the high correlation between these two measures (r = .87 between mother-reported dysregulation and externalizing, r = .88 between teacher-reported dysregulation and externalizing, and r = .80 and .70 between maximum score dysregulation and mother-reported and teacher-reported externalizing, respectively; see online-only supplementary Table S.8). These high correlations between measures suggest that dysregulation and externalizing, as measured by Achenbach scales, are difficult to distinguish. Overall, in this set of analyses, dysregulation was not more strongly associated with friendship quality, arrests, education attainment, or clinical outcomes than was the more general externalizing problems score, which was unsurprising given the high correlations between the measures themselves. Fisher's r-to-z transformations (1921) were used to confirm that the strength of these associations, on average, did not differ to a statistically significant degree (average z = –0.18, p = .48). On average, the association between dysregulation and employment difficulties in adulthood was slightly stronger (r = .16) than the association between general externalizing behavior problems and these employment difficulties (r = .13), but this difference was not statistically significant (z = 0.87, p = .30). The overall conclusion remains that the dysregulation index and the externalizing scale were associated with adult outcomes to a similar extent.
Discussion
This study accomplished four main aims: (a) several operational definitions of dysregulation, using Achenbach AAA subscales, were tested; (b) individual growth curves of dysregulation were computed and predictors of growth differences were considered; (c) a variety of functional outcomes of dysregulation in young adulthood were examined; and (d) the predictive utility of the dysregulation indexes was compared to that of standard externalizing and internalizing indexes.
Origins of dysregulation
The present study's growth curve models of dysregulation, using multiple reporters, replicated prior findings by observing dysregulation to be fairly stable across time and reporters (as also shown by Boomsma et al., Reference Boomsma, Rebollo, Derks, Van Beijsterveldt, Althoff, Rettew and Hudjiak2006; Holtmann, Becker, Banaschewski, Rothenberger, & Roessner, Reference Holtmann, Becker, Banaschewski, Rothenberger and Roessner2011; Hudziak et al., Reference Hudziak, Althoff, Derks, Faraone and Boomsma2005; Peyre et al., Reference Peyre, Speranza, Cortese, Wohl and Purper-Ouakil2015). This pattern suggests that dysregulation is a stable trait (De Caluwé et al., Reference De Caluwé, Decuyper and De Clercq2013). Identification of traitlike phenomena can inform treatment strategies by providing a transdiagnostic description of certain children who may differentially need and respond to treatment. The dysregulation measure, with its inclusion of both internalizing and externalizing scales, is relevant to recent considerations about general factors in psychiatric disorders (Caspi et al., Reference Caspi, Houts, Belsky, Goldman-Mellor, Harrington, Israel and Moffitt2014; Lahey et al., Reference Lahey, Applegate, Hakes, Zald, Hariri and Rathouz2012). Perhaps ultimately, the dysregulation construct could provide a way for clinicians to identify children who would benefit from general training in self-regulation skills. Children with elevated scores on the AAA subscales are more likely to prematurely discontinue treatment, potentially due to complications with therapeutic compliance (McGuire et al., Reference McGuire, Small, Lewin, Murphy, De Nadai, Phares and Storch2013). It also would be quite possible for such children's treatment to be disrupted due to family problems, such as disorganization, stressors, and associated genetic risks. Perhaps general self-regulation skills could be relatively easy to enhance for some children, leading to better ability to reduce problem behaviors in everyday life.
The high stability in dysregulation left limited room for individual differences in growth of dysregulation, resulting in small effect sizes for the statistically significant predictors of linear change. Nevertheless, we identified four key patterns with our different indexes of dysregulation: (a) noteworthy differences across measures in growth parameters, (b) the effect of language ability on change in dysregulation, (c) consistent findings across measures for resistance to control and early social preference, and (d) consistent nonfindings with parenting practices and stressful life events.
Differences across measures in growth parameters
The maximum index of dysregulation started at a relatively high level at age 5, as expected, and decreased very slightly across time. The same was true for mother-reported dysregulation. Teacher-reported dysregulation, however, started at a relatively low level at age 5 and increased very slightly across time. Dysregulated behaviors occurring in the home thus appear to decline with age, while symptoms in the school appear to increase with age. As children develop, it may be that teachers enforce stricter expectations, and thus, disruptive behavior may be more problematic over time in the classroom setting. It may also be that because mothers are reporting about the same child over time, they become accustomed to the child's dysregulated behaviors and perceive them as less severe over time, whereas, because a teacher only has a child for 1 year, the teacher does not become accustomed to a given child's dysregulated behavior over time.
Language ability and change in dysregulation
Teachers’ reports of dysregulation also showed stronger associations with child language ability than did mother reports of dysregulation. With teacher-reported and maximum scores on dysregulation, poorer child language ability was associated with greater growth in dysregulation. This effect corresponds to previous findings not only in the Child Development Project sample but also in two other samples, that children's limited language ability at a given point in time predicts behavior problems over time, even controlling for initial levels of problem behavior (Petersen, Bates, Dodge, Lansford, & Pettit, Reference Petersen, Bates, Dodge, Lansford and Pettit2014; Peterson et al., Reference Petersen, Bates, D'Onofrio, Coyne, Lansford, Dodge and Van Hulle2013). Language may help children self-regulate, and this effect of verbal ability may be particularly relevant in school because regulation deficits at school are especially salient and problematic. The language-centered nature of school may also make it a more rewarding place for children with relatively advanced language, which may reduce misbehavior. It is notable that language ability did not significantly explain differences in trajectories of dysregulation when mothers’ reports of dysregulation were modeled.
Resistance to control and early social preference: Consistent findings across measures
Across our three primary measures of dysregulation, we consistently found that children who were rated by their mothers as resistant to control in early childhood had higher initial levels of dysregulation and that children with low social preference in the early grades tended to show steeper growth in dysregulation defined by mother, teacher, and the maximum reported dysregulation. These findings parallel a previous finding demonstrating that temperamental resistance to control and social preference significantly predict profiles of externalizing behavior problems longitudinally (Petersen, Bates, Dodge, et al., Reference Petersen, Bates and Staples2014). Resistance to control appears to be an early, temperamental indicator of later dysregulation and externalizing behavior problems. Among possible practical implications, children high in resistance to control could be targeted early with consistent parental use of effective discipline (Bates et al., Reference Bates, Pettit, Dodge and Ridge1998). We also speculate that early social skills training could be useful for these children, since positive social interactions and peer acceptance appear to prevent or limit the growth of dysregulation, based on the present findings. In contrast, peer neglect or rejection could produce disrupted attention, poor emotion regulation, behavioral impulsivity, and insufficient socializing experiences with peers. Further research is needed on these postulated processes, but they are consistent with previous research, which has linked psychosocial adversity and dysregulation (Jucksch et al., Reference Jucksch, Salbach-Andrae, Lenz, Goth, Döpfner, Poustka and Holtmann2011).
Nonfindings with parenting practices and stressful life events
Dysregulation growth curves were not significantly affected by parenting practices or stressful life events. This study primarily measured parenting with a few observational items and parent report, but future research could use richer parenting measures to determine if parental encouragement of prosocial behavior through warmth and positive interactions helps to increase and extend prosocial behavior to the school context. Future research should also test for potential child effects because children who interact in positive ways with their families may also have the skills and disposition necessary to treat people well at school. Stressful life events also had no main or interactive effects on dysregulation, but our measure of stress, like our measure of parenting, although fairly standard in the literature, was limited. We only considered the summation of stressful life events (coded as binary yes or no occurrences) without an estimate of the impact of these events on the child. Certain stressful life events (e.g., changes in employment or finances) may partially represent other chronic stressors, such as chaotic home environments with little order and few routines. Such stressors could directly and repeatedly affect children's self-regulation development. Future research with measures of mild but chronic stressors and more detailed measures of parenting practices will help evaluate effects of stress and parenting on the development of child dysregulation.
Implications of dysregulation
Prior studies of dysregulation have examined its association with DSM disorders, substance abuse, criminality, and suicidality (Althoff, Rettew, Ayer, & Hudziak, Reference Althoff, Rettew, Ayer and Hudziak2010; Holtmann, Buchmann, et al., Reference Holtmann, Buchmann, Esser, Schmidt, Banaschewski and Laucht2011). The present study replicated these associations and extended them by demonstrating that dysregulation is associated with broader psychosocial impairment, particularly friendship difficulties, less educational attainment, unemployment, and job loss. These negative adjustment outcomes are problematic for individuals as well as society, and they may be more common than psychiatric diagnoses in community samples.
Heat maps of the associations between multiple early measures of dysregulation, internalizing symptoms, and externalizing symptoms and later outcomes revealed that teacher-reported and maximum scores of dysregulation were associated with employment difficulties, which is consistent with recent findings demonstrating a relation between poor self-regulation in childhood and employment difficulties in adulthood (Daly, Delaney, Egan, & Baumeister, Reference Daly, Delaney, Egan and Baumeister2015). Higher levels of teacher-reported and maximum score dysregulation, compared to mother-reported dysregulation, were also more highly correlated with lower levels of educational attainment and quality of friendships. This is not only consistent with recent findings pertaining to the importance of self-regulation for later positive outcomes (De Ridder, Lensvelt-Mulders, Finkenauer, Stok, & Baumeister, Reference De Ridder, Lensvelt-Mulders, Finkenauer, Stok and Baumeister2012), but it suggests that teachers may be particularly able, compared to mothers, to identify dysregulated children at risk for subsequent lower educational attainment and less friend support.
Our study appears to be the first to test whether the dysregulation scales would relate more strongly to negative adjustment than the broader internalizing and externalizing scales did. Because dysregulation involves insufficient modulation of attention, emotion, and behavior, we expected that it would be more strongly and broadly related to difficulties in adulthood than the externalizing and internalizing scales. Our results, however, showed that dysregulation was more strongly associated with negative outcomes only in comparison to teacher- and mother-reported internalizing, and dysregulation was not more broadly predictive than the externalizing behavior scales. Dysregulation and broader externalizing symptoms were highly correlated with each other and equally associated with most negative outcomes. A key conceptual difference between dysregulation and the broader externalizing scale of the CBCL is that dysregulation should also incorporate the presence of internalizing symptoms. We further explored the concept of dysregulation by testing categorical and multiplicative indexes of dysregulation. The categorical and multiplicative indexes were highly correlated with the other dysregulation measures (average r = .64 for categorical and .90 for multiplicative), and had similar associations with adjustment outcomes. Taken together, our findings suggest that the standard index of externalizing symptoms may have asymptotic predictive accuracy for various outcomes for which the addition of the anxious/depressed and attention problems scales simply cannot add predictive accuracy. Children who were elevated on the dysregulation index tended to have outcomes similar to those rated as high in externalizing behavior problems, which suggests that the predictive value of the dysregulation scale may be due to the measured aggression symptoms and not the anxious and depressed symptoms. Future research is needed to determine how a general inability to self-regulate or high levels of negative emotionality could drive both externalizing behavior problems and dysregulation, as well as to highlight differences between the two concepts, such as how dysregulation may differ from pure externalizing behavior problems through its simultaneous inclusion of internalizing symptoms. To consider pure externalizing problems, one could model externalizing with internalizing partialled out (Keiley, Lofthouse, Bates, Dodge, & Pettit, Reference Keiley, Lofthouse, Bates, Dodge and Pettit2003). This research could clarify the clinical significance of a spectrum of dysregulation for understanding differences in the course, outcomes, and treatment of externalizing disorders. Future research could also examine how dysregulation growth, or change in dysregulation across childhood, predicts adult adjustment outcomes, and how these links compare to those between child externalizing problems and adult outcomes.
Conclusion
The present study used a large community sample and a dimensional, evenly weighted measure of dysregulation from multiple informants to model individual differences in the development of dysregulation from age 5 to 13. Little agreement exists about the preferred operationalization of dysregulation (Geeraerts et al., Reference Geeraerts, Deutz, Deković, Bunte, Schoemaker, Espy and Matthys2015), but our maximum score measure of dysregulation provides an evenly weighted, multiple-informant, continuous measure of self-regulatory difficulties across domains of functioning, particularly attention, behavior, and emotion. Moreover, our measure converges well with other measures of dysregulation used in previous studies (see online-only supplementary Table S.9). The present study also tested the association between this and other measures of dysregulation and a range of difficulties in young adulthood, and compared these associations to those between internalizing and externalizing symptoms and adjustment outcomes. It replicated previous findings by demonstrating the traitlike nature of dysregulation and its association with psychiatric diagnoses (especially externalizing disorders), substance abuse, criminality, and suicidality. It added to prior work by demonstrating the roles of child temperament (i.e., resistance to control), early peer acceptance, and language ability in explaining differences in initial levels and change in dysregulation. Further, this study added to the existing body of literature on dysregulation by also finding that childhood dysregulation is associated with psychosocial impairment and daily functioning difficulties, particularly unemployment and job loss. It also showed that mother and teacher report of externalizing problems may be as useful as reports of dysregulation for identifying negative outcomes.
Our findings about the origins and implications of dysregulation in general do support impaired self-regulation as a candidate process through which risk factors such as poor language ability and peer rejection lead to poor friendships, employment difficulties, arrests, and psychiatric disorders. It remains plausible that interventions targeting deficits in general self-regulatory abilities may help at-risk children make better progress in social behavior (Sonuga-Barke, Thompson, Abikoff, Klein, & Brotman, Reference Sonuga-Barke, Thompson, Abikoff, Klein and Brotman2006). Further research on the similarities and differences in the origins and implications of dysregulation and externalizing problems could help to advance understanding of how these problems develop and change over time, clarify the equifinality and multifinality of dysregulation and externalizing problems, and refine prevention and early intervention strategies to reduce the burden of these potentially adverse outcomes.
Supplementary Material
To view the supplementary material for this article, please visit https://doi.org/10.1017/S0954579417001572.