1 Introduction: a style of speech in a diverse range of languages
Its users treat whistled speech as an integral part of a local language since it fulfils the same aim of communication as spoken speech while encoding the same syntax and vocabulary. Its function is to enable dialogues at middle or long distances in conditions where the normal or the shouted voice, masked by ambient noise, would not be intelligible. The linguistic information is adjusted and concentrated into a phonetic whistle thanks to a natural oral acoustic modification of the voice that is shown in this study to be similar to, but more radical than, what occurs in shouting. The whistled signal encodes selected key traits of the given language through modulations in amplitude and frequency. This is sufficient for trained whistlers to recognise non-stereotyped sentences. For example, non-words could be recognised in 70% of the cases in Busnel (Reference Busnel1970), and sentences at a level of 90% in Turkish (Busnel Reference Busnel1970) or Greek (Meyer Reference Meyer2005). As we will see (in section 3.1), such performance depends on the phonological role – different in each language – of the acoustic cues selected for whistles. Moreover, several sociolinguistic considerations also need to be taken into account, in particular the extent of use of whistled speech in everyday life.
Contrary to a ‘language surrogate’, whistled speech does not create a substitute for language with its own rules of syntax or the like, and contrary to Morse code it does not rely on an intermediary code, like the written alphabet. In 1976, Busnel and Classe explained; ‘when a Gomero or a Turk whistles, he is in effect still speaking, but he modifies one aspect of his linguistic activity in such a way that major acoustic modifications are imposed upon the medium’ (Busnel & Classe Reference Busnel and Classe1976: 107). All the whistlers interviewed for the present paper emphasised that they whistle exactly as they think in their language and that an equivalent process is at play when they receive a message. They agreed that ‘at the receiving end, the acoustic signal is mentally converted back into the original verbal image that initiated the chain of events’ (ibid: 107). In brief, whistled speech is a style of speech. The pioneers in the study of whistled languages concur in defining the whistled form of a language as a style of speech. Cowan (Reference Cowan1948: 284) observed that ‘[t]he whistle is obviously based upon the spoken language’ (cited in Sebeok & Umiker-Sebeok Reference Sebeok and Umiker-Sebeok1976: 1390) and described a high degree of intelligibility and variability in the sentences of whistled Mazatec. Later he said about whistled Tepehua: ‘The question might be well asked, if whistled Tepehua should not be considered a style of speech (as whisper is, for example), rather than a substitute for language’ (Cowan Reference Cowan, Sebeok and Umiker-Sebeok1976: 1407). Busnel and Classe found the classification of whistled languages among ‘surrogates’ as improper: ‘Whereas the sign language of deaf-mutes, for instance, is truly a surrogate since it is a substitute for normal speech, whistled languages do not replace but rather complement it in certain specific circumstances. In other words, rather than surrogates, they are adjuncts’ (Busnel & Classe Reference Busnel and Classe1976: 107). The direct drawback is that any language could be whistled, provided that the ecological and social conditions favour such linguistic behaviour. Indeed, the phenomenon is to be found in a diverse range of languages and language families, including tonal languages (Mazatec, Hmong) as well as non-tonal languages (Greek, Spanish, Turkish). Moreover, the present study expands the range of linguistic structures that are known to have been incorporated into whistles, for example, in Akha, Siberian Yupik, Surui, Gaviaõ and Mixtec, and including incipient tonal languages (Chepang).Footnote 1
In this article, a broad overview of the phenomenon of whistled languages is first given by explaining their acoustic strategy and the role of auditory perception in their adaptation to different types of linguistic systems. On this basis, a typology of the languages in question is presented. In particular, a comparative description of the whistled transpositions of several non-tonal languages is developed using a statistical analysis of the vowels. Finally, an experiment in which whistled vowels are identified by non-whistlers is summarised, providing new insights into the perceptual cues relevant in transposing spoken formants into simple whistled frequencies. Most of the whistled and spoken material analysed here was documented beginning in 2003 during fieldwork projects in association with local researchers.
2 A telecommunication system in continuity with shouted voice
2.1 From spoken to shouted voice . . . towards whistles
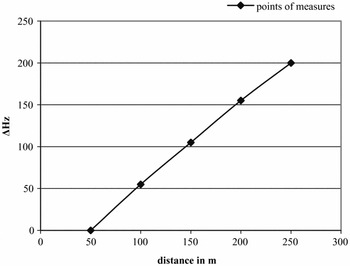
Nearly all the low-density populations that have developed whistled speech live in biotopes of mountains or dense forests. Such ecological milieux predispose the inhabitants to several relatively isolated activities during their everyday life, e.g. shepherding, hunting and harvesting in the field. The rugged topography increases the necessity of speaking at a distance, and the dense vegetation restricts visual contact and limits the propagation of sound in the noisy environment. Usually, to increase the range of the normal voice or to overcome noise, individuals raise amplitude levels in a quasi-subconscious way. During this phenomenon, called the ‘Lombard effect’ (Lombard Reference Lombard1911), the spoken voice progressively passes into the register of shouted voice. But if noise or distance continually increases, the shouter's vocal mechanism will soon tire and reach its biological limit. Effort is intensified with the tendency to prolong syllables and reduce the flow of speech (Dreher & O'Neill Reference Dreher and O'Neill1957). For this reason, most shouted dialogues are short. For example, in a natural mountain environment, such as the valley of the Vercors (France), the distance limit of intelligibility of the normal spoken voice has been measured to be under 50 m (figures 1 and 2) while the limit of intelligibility of several shouted voices produced at different amplitude levels could reach up to 200 m (figure 2) (Meyer Reference Meyer2005). At a distance of 200 m, the tiring of the vocal folds was reached at around 90–100 dBA. The experiment consisted of recording a male shouted voice targeted at reaching a person situated at distances progressing from 20 m to 300 m. The acoustic strategy at play in shouted speech showed a quasi-linear increase of the frequencies of the harmonics emerging from the background noise and a lengthening of the duration of the sentences (figures 2 and 3).
Typical distance limits of intelligibility of spoken, shouted, and whistled speech in the conditions of the experiment.

Extracts of the same sentence spoken at 10 m and then shouted at 50, 100, 150, 200 m. One can notice a strong degradation of the harmonics of the voice with the preservation of some which are essential to the speaker in distant communication.

Median frequency of the second harmonic of vowels as a function of distance for four shouted sentences (reference at 50 m).

By comparison, whistled speech is typically produced between 80 and 120 dBA in a band of frequencies going from 1 to 4 kHz, and its general flow is from 10% to 50% slower than normal speech (Moles Reference Moles1970, Meyer Reference Meyer2005, Meyer & Gautheron Reference Meyer and Gautheron2006). As a consequence, whistling implements the strategy of shouted speech without requiring the vibration of the vocal folds. It is a natural alternative to the constraints observed for shouted speech in the above experiment. Amplitude, frequency and duration, which are the three fundamental parameters of speech, can be more comfortably adapted to the distance of communication and to the ambient noise. Whistled speech is so efficient that full sentences are still intelligible at distances ten times greater than shouted speech (Busnel & Classe Reference Busnel and Classe1976, Meyer Reference Meyer2005).
2.2 Adaptation to sound propagation and to human hearing
A close look at the literature in bioacoustics and psychoacoustics shows that enhanced performance is also possible because whistled frequencies are adapted to the propagation of sounds within the favoured static and dynamic range of human hearing. In terms of propagation in forests and open habitats, the frequencies from 1 to 4 kHz are the ones that best resist reverberation variations and ground attenuation as distance increases (Wiley & Richards Reference Wiley and Richards1978, Padgham Reference Padgham2004). In terms of perception, the peripheral ear enhances the whistled frequency domain, for which, at a psychoacoustic level, the audibility and selectivity of human hearing are also best (Stevens & Davis Reference Stevens and Davis1938). Moreover, up to 4000 Hz the ear performs the best temporal analysis of an acoustic signal (Green Reference Green and Michelsen1985). Whistled languages are also efficient because the functional frequencies of whistling are largely above the natural background noise, and these frequencies are concentrated in a narrow band, resulting in reducing masking effects and lengthening transmission distances of the encoded information without risk of degradation. At a given time the functional bandwidth was found to be less than 500 Hz, activating a maximum of four perceptual hearing filters,Footnote 2 optimizing the signal to noise ratio (SNR) and the clarity of the syllables. Finally, whistled speech defines a true natural telecommunication system spectacularly adapted to the environment of its use and to the human ear thanks to an acoustic modification of speech mainly in the frequency domain.
3 Language-specific frequency choices imposed by whistled speech
3.1 General production and perceptual aspects
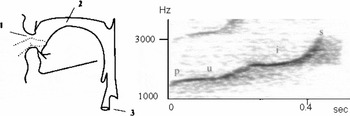
A phonetic whistle is produced by the compressed air in the cavity of the mouth, forced either through the smallest hole of the vocal tract or against an edge (depending on the technique). The jaws are fixed by the tightened lips, the jaw and neck muscles, and even the finger (point 1, figure 4). The movements of the tongue and of the larynx are the principal elements controlling the tuning of the sound to articulate the words (points 2 and 3, figure 4). They enable regulation of the pressure of the air expelled and variation in the volume of the resonance cavity to produce modulations both in the frequency and amplitude domains.
Position of whistling and example of production of the Greek syllable /puis/.

The resulting whistled articulation is a constrained version of the one used for the equivalent spoken form of speech. For non-tonal languages, whistlers learn to approximate the form of the mouth of the spoken voice while whistling; this provokes an adaptation of vowel quality into a simple frequency. For tonal languages, the control of a transposition of the fundamental frequency of the normal voice is favoured in the resonances of the vocal tract to encode the distinctive phonological tones carried by vowel nuclei. In both cases, acute sounds are produced at the high front part of the mouth at the palate, while lower sounds come from further back in the mouth. Therefore, whistlers make the choice to reproduce definite parts of the frequency spectrum of the voice as a function of the phonological structure of their language.
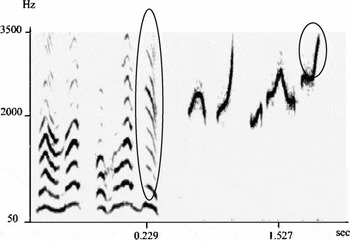
The psychoacoustic literature concerning complex sounds like those of the spoken voice provides an explanation for the conformation of whistles to the phonology: human beings perceive spontaneously and simultaneously two qualities of heights (Risset Reference Risset1968) in synthetic listening (Helmholtz Reference von Helmholtz1862). One is the perceptual sensation resulting from the complex aspects of the frequency spectrum (timbre in music); it strongly characterises the quality of a vowel through the formants. The other is the perceptual sensation resulting from the fundamental frequency (pitch). In the normal spoken voice, these two perceptual variables of frequency can be combined to encode phonetic cues. But a whistled strategy renders the two in a unique frequency, which is why whistlers must adapt their production to the rules of organisation of the sounds of their language, selecting the most relevant parts to optimise intelligibility for the receiver (figure 5 and 6).
An example of the formant distribution strategy: the Turkish sentence /mehmet okulagit/ (lit. ‘Mehmet goes to school’) spoken and then whistled. The final /t/ in the word /okulagit/ is marked with an elliptical line in both spoken voice (left) and whistled speech (right).

Tonal Mazatec sentence spoken and then whistled. The whistles reproduce mainly F0.

3.2 Typology
The reduction of the frequency space in whistles divides whistled languages into typological categories. As stated above, the main criterion of distinction depends on the tonal or non-tonal aspect of the given language. The two oldest research papers on whistled languages reveal this difference, as Cowan first described the Mexican Mazatec four-tone whistled form (Cowan Reference Cowan1948), and Classe then described the Spanish whistled form of the Canary islands (Classe Reference Classe1956). The papers on Béarnais (Busnel, Moles & Vallancien Reference Busnel, Moles and Vallancien1962), Turkish (Busnel Reference Busnel1970), Hmong (Busnel, Alcuri, Gautheron & Rialland Reference Busnel, Alcuri, Gautheron and Rialland1989) or Greek (Xirometis & Spyridis Reference Xiromeritis and Spyridis1994) have shown that there is a large variability in each category. Furthermore, Caughley (Reference Caughley1976) observed the Chepang whistled language with a behaviour differing from the former ones described. I have proposed a general typology of languages as a function of their whistled speech behaviour (Meyer Reference Meyer2005): for each language, whistlers give priority in frequency to a dominant trait that is carried either by the formant distribution of the spoken voice (type I: most non-tonal languages, example figure 5) or by the fundamental frequency (type II: most tonal languages, figure 6), but in the case of a non-tonal language with an incipient tonal behaviour like Chepang, the contribution of both is balanced, which explains its intermediate strategy in whistles (type III). As shown later in this paper, this third type of tendency was also observed in the rendering of stress in some non-tonal whistled languages like Siberian Yupik (whereas in other languages like Turkish or Spanish, stress only slightly influences whistled frequencies and is therefore a secondary whistled feature). Some tonal languages also show an intermediate strategy to emulate the voice in whistles; for example, the Amazon language Surui, in which the influence on resulting whistled frequencies has been described at the level of the formant distribution of some whistled consonants (Meyer Reference Meyer2005).
Whistled consonants in all languages are rapid modulations (transients) in frequency and/or amplitude of the narrow-band of a whistled signal. In an intervocalic position, a consonant begins by modulating the preceding vowel and ends by modulating the following vowel. When the amplitude modulation shuts off the whistle, consonants are characterised by silent gaps. For the tonal languages of the first typological category (type I), most of the time only the suprasegmental traits of the consonants are transposed into whistles. For the non-tonal languages of the second category (type II), the whistled signal is a combination of frequency and amplitude modulations. It reflects acoustic cues of the formant transients of the voice (see figure 4 and figure 5). The resulting simple frequency shape highlights categories of similarities, mostly confined to sounds formed at close articulatory loci (Leroy Reference Leroy1970, Meyer Reference Meyer2005, Rialland Reference Rialland2005). These categories have been shown to be similar in Greek, Turkish and Spanish, despite differences of pronunciation in each language and the influence of their respective vowel frequency distributions (Meyer Reference Meyer2005). Moreover, the languages of the intermediate category (type III) render consonants in a language-specific balance between the strategies of type I and type II. This intermediate category of languages illustrates that from tonal to non-tonal languages, there is a continuum of variation in frequency adaptation strategies.
4 Comparative description of vowels in non-tonal whistled languages
The adaptation of the complex spectral and formant distribution of spoken voice into whistles in non-tonal languages is one of the most peculiar and instructive aspects of whistled speech. This phenomenon illustrates extensively the process of transformation of speech from the multidimensional frequency space of spoken voice to a monodimensional whistled space. In the present study, the detailed results obtained for Greek, Spanish, and Turkish whistled vowels have been taken as a basis. Complementary analyses of Siberian Yupik and Chepang vowels extend the insight on the kind of whistled speech strategies that are adopted by non-tonal languages.
4.1 General frequency distribution of whistled vowels
The vowels are the most stable parts of a whistled sentence; they also contain most of its energy. Their mean frequency is much easier and precise to measure than spoken formants because of the narrow and simple frequency band of whistles. The statistical analyses of an original corpus of Greek and Spanish natural sentences on the one hand, and lists of Turkish wordsFootnote 3 on the other hand, show that for a given distance of communication and for an individual whistler, each vowel is whistled within a specific interval of frequency values. A whistled vocalic space is characterised by a band of whistled frequencies corresponding to the variability of articulation of the vowel. The limitations of this articulation define the frame in which the relative frequencies can vary. This indicates that the pronunciation of a whistled vowel is in direct relation to the specificities of the vocal tract manoeuvres occurring in spoken speech (to the extent that they can be achieved while maintaining an alveolar/apical whistle source). The whistled systems of vowels follow the same general organisation in all the non-tonal languages. The highest pitch is always attributed to /i/. Its neighbouring vowels in terms of locus of articulation and pitch are for example /ʏ/ or /ɨ/. /o/ is invariably among the lowest frequencies. It often shares its interval of frequencies with another vowel such as /a/ in Greek and Turkish or /u/ in Spanish. /e/ and /a/ are always intermediate vowels, /e/ being higher in frequency than /a/. Their respective intervals overlap more or less with neighbouring vowels, depending on their realisation in the particular language. For example, when there are a number of intermediate vowels, as in Turkish, their frequencies will overlap more, up to the point where they seem not to be easily distinguished without complementary information given by the lexical context or eventual rules of vowel harmony. Finally, the vowel /u/ has a particular behaviour when whistled: it is often associated with an intermediate vowel in Turkish and Greek, but in Spanish it is the lowest one. One reason for this variation is that the whistled /u/ loses the stable rounded character of the spoken equivalent because the lips have a lesser degree of freedom of movement during whistling.
Finally, each language has its own statistical frequency distribution of whistled vowels. As these language-specific frequency scales are the result of purely phonetic adaptations of normal speech, the constraints of articulation due to whistling exaggerate the tendencies of vocalic reductions already at play in the spontaneous spoken form. They also naturally highlight some key aspects of the phonetic–phonological balance in each language. The analysis of the functional frequencies of the vowels shows that some phonetic reductions characterise the whistled signal when compared to the spoken signal.
4.2 Spanish Silbo
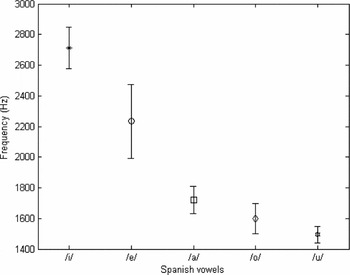
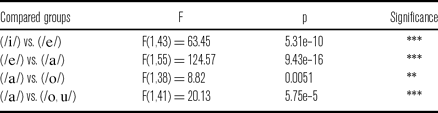
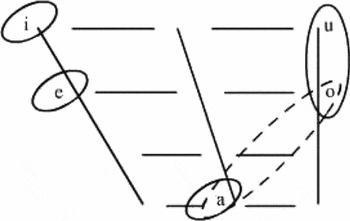
The Silbo vocalic system is based on the spoken Spanish dialect of the island of La Gomera, for which /o/ and /a/ are sometimes qualitatively close together and /u/ is very rare (7%) and often pronounced as /o/ (Classe Reference Classe1957). The spoken vowels /i, e, a, o, u/ are therefore whistled in five bands, some of which overlap strongly. All the whistlers have the same frequency scale pattern. Four intervals are statistically different (/i/, /e/, /a/ and /o, u/) in a decreasing order of mean frequencies (figure 7, table 1 and figure 8). Moreover, some very good whistlers distinguish clearly /u/ from /o/ when necessary by lowering the /u/ and using the extremes of the frequency intervals. These results confirm the analysis of Classe (Classe Reference Classe1957, Busnel & Classe Reference Busnel and Classe1976) and at the same time contradict the theory of Trujillo (Reference Trujillo1978) which stated that only two whistled vowels (acute and low) exist in Spanish Silbo. Later in this study (see section 5.2), perceptual results will confirm that at least four whistled vowels are perceived in the Spanish whistled language of La Gomera. Unfortunately, the erroneous interpretation of Trujillo was taken as a reference both in Carreiras et al. (Reference Carreiras, Lopez, Rivero and Corina2005) for carrying out the first perception experiment on whistled speech and in a teaching manual intended to be used by teachers of Silbo taking part in a process of revitalisation through the schools of La Gomera (Trujillo et al. Reference Trujillo, Morera, Guarro, Padrón and Ortíz2005). However, most of the native whistlers still contest Trujillo's point of view – even one of the pioneer teachers of Silbo in the primary schools (Maestro de Silbo). To solve the problem, he prefers to rely only on the traditional form of teaching by imitation (personal communication Rodriguez 2006).
Frequency distribution of Spanish whistled vowels (produced by a Maestro de Silbo teaching at school).

One-way ANOVA comparison of some vocalic groups in whistled Spanish (cf. data in figure 7).

Vocalic triangle of Spanish with statistical groupings outlined (solid line = highly significant; dashed line = less significant).

4.3 Greek
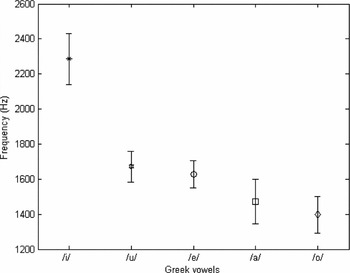
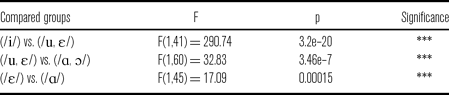
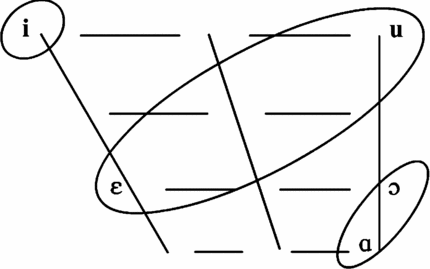
The five phonological Greek vowels /i, ɛ, ɑ, ɔ, u/ are whistled in five intervals of frequencies that overlap in unequal proportions (figure 9). The whistled /i/ never overlaps with the frequency values of the other vowels, which overlap more frequently. In a decreasing order of mean frequency, /u/ and /ɛ/ are whistled at intermediate frequencies, and /ɑ/ and /ɔ/ at lower frequencies. The standard deviations of /u/ and /ɛ/ show that they overlap up to the point that they are not statistically different. Such a situation is an adaptation to the loss of the rounded aspect of /u/ by fixation of the lips during whistling. Similarly, the frequency intervals /ɑ/ and /ɔ/ also overlap highly. Indeed, the back vowel [ɑ] is phonetically close to [ɔ] if it loses its rounded character with the lips being fixed during whistling. Finally, the whistled vowels define statistically three main distinct bands of frequencies: (/i/), (/u, ɛ/) and (/ɑ, ɔ/) (figure 9, table 2 and figure 10). These reductions are only phonetic and do not mean that there are only three whistled vowels in the Greek of Antia village. All the whistlers recorded have the same pattern of frequency distribution of whistled vowels, which is rooted in the way Greek vowels are articulated. When the context is not sufficient to distinguish either the vowel /u/ from the vowel /ɛ/ or the vowel /ɑ/ from the vowel /ɔ/, the whistlers use the extremes of the intervals. Yet, most of the time, the whistlers rely on lexical context to distinguish them.
Frequency distribution of Greek whistled vowels.

One-way ANOVA comparison of some vocalic groups in whistled Greek (cf. data of figure 9).

Vocalic triangle of Greek with statistical groupings outlined.

4.4 Turkish
The eight Turkish vowels are whistled in a decreasing order of mean frequencies in eight intervals (/ɪ, ʏ, ɨ, ɛ, œ, ʊ, a, o/) that overlap considerably (figure 11). Such a pattern of frequency-scale distribution is the same for all whistlers. The vowel /ɪ/ bears the highest frequencies and /o/ the lowest ones. In between, some intervals overlap much more than others: first, the vowels /ɨ/ and /ʏ/ have bands of frequencies nearly confused even if /ɨ/ is higher on average. Secondly, the intervals of frequencies of the vowels /ɛ/, /œ/ and /ʊ/ overlap largely. Finally, the respective intervals of the whistled frequencies of /a/ and /o/ also overlap considerably, with /o/ at the lowest mean frequency.
Frequency distribution of 280 Turkish whistled vowels.

4.4.1 Vocalic groups
Such a complex vocalic system of eight whistled frequency intervals highlights four groups (/ɪ/), (/ɨ, ʏ/), (/ɛ, œ, ʊ/), (/a, o/), which are statistically distinct (figure 11 and table 3). These results attest that some phonetic reductions exist (figure 12). But they do not imply a phonological reduction of the whistled system in comparison to the spoken form (see also section 2.2).
One-way ANOVA comparison of some vocalic groups in whistled Turkish (cf. data of figure 11).

Vocalic triangle of Turkish with statistical groupings outlined.

4.4.2 The key role of vowel harmony rules for vowel identification
Turkish is the language in the second category of our typology (cf. section 3.2) that has the highest number of vowels. Even though several attempts to unravel the Turkish whistled system have been made (Busnel Reference Busnel1970, Leroy Reference Leroy1970, Moles Reference Moles1970, Meyer Reference Meyer2005), they do not explain how phonetic vowel reduction is balanced by the vowel harmony rules specific to Turkish phonology. Indeed, the possible vowel confusions left by the preceding vowel groups are nearly completely solved by the vowel harmony rules that contribute to order the syllable chain in an agglutinated Turkish word.
Vowel harmony rules in Turkish reflect a process through which some aspects of the vowel quality oppositions are neutralised by the effect of assimilation between the vowel of one syllable and the vowel of the following syllable. The rules apply from left to right, and therefore only non-initial vowels are involved. The two rules are the following:
(a) If the first vowel has an anterior pronunciation (/ɪ, ɛ, ʏ, œ/), or a posterior one (/ɨ, ʊ, a, o/), the subsequent vowels will be, respectively, anterior or posterior. This classifies the words into two categories.
(b) If one diffuse vowel is plain, the following vowel will also be plain. On the other hand, a compact vowel in non-initial position will always be plain (the direct consequence is that the vowels /œ/ and /o/ will always be in an initial syllable).
The possibilities opened by the two vowel harmony rules can be summarised as follows:
/a/ and /ɨ/ –––– can be followed by –––– /a/ and /ɨ/
/o/ and /ʊ/ –––– can be followed by –––– /a/ and /ʊ/
/ɛ/ and /ɪ/ –––– can be followed by –––– /ɛ/ and /ɪ/
/œ/ and /ʏ/ –––– can be followed by –––– /ɛ/ and /ʏ/
The only resulting oppositions are those between high and non-high vowels. For non-initial syllables the system is reduced to six vowels.
The four inter-syllabic relations created by the harmony rules simplify the vowel identification of the four statistical groups of whistled vowel frequencies. Indeed, only one harmony rule links two distinct frequency groups (figure 13).
Combination of vocalic frequency intervals and harmony rules.

As a result, the nature of two consecutive vowels not whistled in the same frequency group will always be identified – a possibility that relies on the human ability of phonetic and auditory memory in vowel discrimination (Cowan & Morse Reference Cowan and Morse1986). This means that the whistled system and the rules of vowel harmony are combined logically and naturally. They provide a simplified space of possibilities enabling speakers to identify vowels with a reduced number of variables. Very few opportunities for confusion exist; they concern only two-syllable words with identical consonants:
• two consecutive /ʏ/ (respectively /ʊ/) might be confused with two consecutive /ɨ/ (respectively /ɛ/)
• /œ/ followed by /ɛ/ might be confused with /ɛ/ followed by /ɛ/
• /a/ followed by /a/ might be confused with /o/ followed by /a/ or /o/ followed by /o/.
However, the ambiguities that are not solved by the harmony system are sometimes overcome by the use of the extremes of the frequency bands. For example, for the common words /kalaj/ and /kolaj/: /o/ and /a/ are phonetically distinct in /kolaj/ because /a/ bears a higher pitch despite the fact that the two vowels are usually whistled in the same way.
It is relevant to ask the question whether this process also helps in spoken form. It would mean that we perceive frequency scales through the frequency distribution of vowel formants. This question will be discussed at the end of this paper.
4.5 Stress in Greek, Turkish and Silbo
For Greek, Turkish and Silbo, stress is usually preserved in whistled speech. Most of the time, it is expressed by a combined effect of amplitude and frequency increase. Stress does not change the level-distribution of the vocalic frequency intervals but acts as a secondary feature influencing the frequency. A stressed vowel is often in the highest part of its typical interval of frequency. But this is not always the case, as the frequency variation of a stressed vowel in connected speech depends on the whistled frequency of the preceding vowel.
4.5.1 Stress in Silbo
The rules of the Spanish tonic accent are mostly respected in Silbo. Stress is performed in two different ways as a function of the context: either it is marked by a frequency and amplitude increase of the whistled vowel, or by lengthening the vowel when the usual rules of stress are disturbed, for example for proparoxytonic words (Classe Reference Classe1956).
4.5.2 Stress in whistled Greek
In Greek, some minimal pairs exist that are differentiated only by the location of the stress. For spoken Greek ‘in a neutral intonative context the stressed vowels are longer, higher and more intense than the unstressed ones’ (Dimou & Dommergues Reference Dimou and Dommergues2004: 177). Similarly, the whistlers produce stress in 80% of the measured cases through an increase of the amplitude and an elevation of the frequency of the whistled vowel. This has the effect of situating the frequency of the stressed vowel in the upper part of its typical vocalic interval.
4.5.3 Stress in whistled Turkish
Spoken Turkish uses an intonative stress that takes place on the particles preceding expressions of interrogation or negation and on negative imperatives. Among the sentences of the examined corpus, several present the required conditions for analysis. For example in the interrogative sentence /kalɛmin var mɨ/ meaning ‘Do you have a pen?’ (pen-poss2sg there is inter), the /a/ of /vaʳ/ is stressed in spoken voice, at least in intensity. In the six whistled pronunciations examined for this sentence, only one is not stressed at the frequency level. For the others, the /a/ has a frequency value in the highest part of the interval of values of Turkish whistled /a/. However, this stress is also developed through a slight increase of the amplitude. Other examples presenting the three different configurations of stress in Turkish are available in Meyer (Reference Meyer2005).
4.6 Two other non-tonal languages: Siberian Yupik and Chepang
Siberian Yupik and Chepang are two non-tonal languages adopting an intermediate whistled strategy (type III in section 3.2 above). The rhythmic complexity of Siberian Yupik (Jacobson Reference Jacobson and Krauss1985) and the tonal tendency of Chepang affect the spoken phonetics to the extent that they are reflected in whistling. These two languages are representative of a balanced contribution of both formant distribution and stress intonation in the whistled transposition. For both of them, the frequency scale resulting from the underlying influence of the formant distribution still contributes strongly to whistled pitch, but it does not have the systematically dominant influence as in Turkish, Greek or Silbo. A first corpus of Siberian Yupik whistled speech was compiled in the summer of 2006 for bilabial whistling. Its analysis has shown that /a, e, u/ (/e/ being the schwa) are very variable, and overlap considerably between each other, while /i/ is statistically different (see figure 14). For the incipient tonal language Chepang, Ross Caughley observed that pitch is influenced both in spoken intonation and whistled talk by two articulatory criteria of the vowel nucleus affecting its weight: height (high, mid or low) and backness (non-back vs. back). He measured ‘generally higher average pitch with the high front vowel /i/, lower with the low back vowel /o/’ (Caughley Reference Caughley1976: 968). Moreover, from the same sample of data, Meyer (Reference Meyer2005) has verified that the frequency bands of Chepang whistled vowels /a/, /u/ and /e/ vary more than for /i/ (in bilabial whistling /a/ varies from 1241 to 1572 Hz, /e/ from 1271 to 1715 Hz and /u/ from 1142 to 1563 Hz, whereas /i/ remains around 1800 Hz). With more extensive corpora of whistled speech in each language, it might be possible to make a deeper analysis, but very few speakers still master this whistled knowledge. However, a conclusion can already be drawn from these data: for both languages, three groups of vowels have been identified as a function of the influence of the formant distribution on whistled pitch. The first group is formed by /i/ only: its formants ‘pull’ the frequencies of the vowel quality towards higher values so that /i/ always remains high in whistled pitch without being disturbed by prosodic context. Next, the group formed by the vowels /e, a, u/, which have intermediate frequency values in the whistled scale, is more dependent on prosodic and consonantal contexts. Finally, the group formed by /o/ alone pulls frequencies to lower values but is more dependent on the prosodic context than is /i/.
Frequency distribution of Siberian Yupik whistled vowels.

4.7 Other common characteristics relying on vowels
Each vowel is characterised by a relative value that can vary with the technique and the power of whistling. The farther the whistlers have to communicate, the higher is the whole scale of the vocalic frequencies, /i/ staying below 4 kHz and the lowest vowel above 1 kHz. This range of two octaves is never used in a single sentence: the limit of one octave is systematically respected between the lowest and the highest frequency. This phenomenon, also observed in tonal whistled languages, might be due to risks of octave ambiguities in the perception of pitch by the human ear (Shepard Reference Shepard and Moskosky1968, Risset Reference Risset and Nakada2000). Another aspect concerns vowel durations: in the languages that do not have phonological distinctions in vowel quantity, the duration of any vowel may be adapted to ease the intelligibility of the sentence. For a dialogue at a distance of 150 m between interlocutors, the vowels were measured to last an average of 26% longer in whistled Turkish than in spoken Turkish and 28% longer in Akha of Northern Thailand. In languages with long and short vowels (Siberian Yupik), such vocalic lengthening is emphasised on long vowels. At very long distances (several kilometers) or for the sung mode of whistled speech, the mean lengthening of vowels in comparison to spoken utterances can reach more than 50%. Some vowels are maintained for one second or more. These vowels with a very long duration are mostly situated at the end of a speech group: they help to sequence a sentence rhythmically in coherent units of meaning. In this way, contrary to what occurs in the singing voice (Meyer Reference Meyer2007), such exaggerated durations do not reduce intelligibility but improve it. When the final and the initial vowels of two consecutive words are identical, they are nearly always whistled as a single vowel. In fact, exactly as in spoken speech, word-by-word segmentation is not always respected, even if two words present two different vowels as consecutive sounds: for example, in the Spanish sentence ‘Tiene que ir’, /ei/ from ‘que ir’ is whistled as a diphthong similarly to the /ie/ of the word /tiene/. And diphthongs are treated as pairs of vowels; a modulation going from the frequency of the first vowel to the frequency of the second vowel making the transition.
4.8 Discussion and conclusions
The results presented here show that the whistlers of non-tonal languages rely on articulation but render both segmental and suprasegmental features in the same prosodic line. Vocalic groupings are mainly due to articulatory proximities shared with spoken speech, except in cases of lip constraints imposed by whistling (affecting principally /u/ for the vowels and imposing a new strategy of pharyngeal control of air pressure for some consonants like /b/ and /p/). As a consequence, most of the time, the groupings emulate phonetic reductions that are common to those observed in spontaneous natural speech (Lindblom Reference Lindblom1963, Reference Lindblom1990; Gay Reference Gay1978) and are not rooted in phonological simplification. The vocalic inventories of each language are expressed in frequency scales. The acoustic correlations observed between spoken and whistled speech are due to common combinations of tongue height and anterior–posterior position. For example, if the second formant of the voice is the result of the cavity formed between the tongue and the palate, it is therefore often in correlation with whistling, for which the resonance often occurs at this level. Brusis (Reference Brusis1973) noticed that F2 shows frequency shapes similar in several aspects to the transposed whistled signal. On this basis, Rialland (Reference Rialland2003, Reference Rialland2005) proposed that only F2 is transposed in Silbo. But F2 may well be only one of the parameters that are whistled, first, because the transformation of the voice into an articulated whistle passes through a much more tensed and relatively elongated vocal tract, and secondly, because the tension of the lower vocal tract is different for the differently pronounced phonemes. The whistled groupings outlined in figures 8, 10 and 12 suggest considering broader data of the vowel frequency spectrum, even if we exclude the data concerning the phonemes largely influenced by the lips.
This study also provides detailed insight into the phenomenon of adaptation of whistled speech to the phonology of given languages. The example of Turkish alone illustrates how whistled speech emphasises processes that are more difficult to notice in spoken speech. One of the main phonetic advantages of whistled speech is the simple frequency band of whistles, which is easier to analyse than the complex voice spectra (where the formants are much more diffuse in comparison). Therefore, this natural phenomenon highlights key features of the phonology of each language while suggesting which acoustic cues carry them. For example, salient parts of the formant distribution are embodied in whistles as pure tones for vowels and combinations of frequency and as amplitude modulations for consonants.
5 Perception experiment on whistled vowels
As shown in the previous analyses, two aspects of a vowel nucleus can be whistled: intonation (F0) or/and vowel quality (essentially formant distribution). In order to understand more deeply the perception of whistled vowels, particularly why and how the quality of the spoken vowels can be adapted in a simple frequency for whistled speech, two variants of the same perceptual experiment were developed. Categorisation of whistled vowels was observed for subjects who knew nothing about whistled languages (French students). The sound extracts were selected in a corpus of Spanish whistled sentences recorded in 2003 by the author. Participants had to recognise the four vowels /i, e, a, o/ in a simple and intuitive task. The first experiment tested the vowels presented on their own without any context (Experiment I), while the second experiment tested the vowels presented in the context of a sentence (Experiment II). The whistling of a native whistler of Spanish is also presented for reference in the case of Experiment I. The conception of these experiments was inspired by the assertion made by some whistlers that the task of recognition of whistled vowels relies on the perceptual capacities already developed by speakers for spoken vowels. It came also from the observation that French and Spanish share several vowels and that whistlers could emulate French in whistles – despite not understanding the language – but just imitating the phonetics they perceive, as they would do for spoken speech. I observed that I could recognise quite intuitively and rapidly some vowels that were whistled. I therefore constructed the hypothesis that anybody speaking French as their mother tongue would be able to recognise the whistled forms of vowels. Such a study has potential implications for the analysis of the role of each formant for the identification of each vowel type.
5.1 Method
5.1.1 Participants
The tested subjects were 40 students, 19–29 years old, who were French native speakers. Twenty persons performed Experiment I (vowels on their own), and the 20 others Experiment II (acoustic context of the sentence). The students' normal hearing thresholds were tested by audiogram. They did not receive any feedback on their performance or any information concerning the distribution of the whistled vowels before the end of the test.
5.1.2 Stimuli
The four tested vowels from the Spanish whistled language of La Gomera (Silbo) are: /i/, /e/, /a/, /o/. These vowels also exist in French with similar or close pronunciations (Calliope 1989). Another reason for this choice of four whistled vowels was that they have the same kind of frequency distribution in Greek and Turkish (cf. section 4.1). Given the structure of French, one can reasonably expect that whistled vowels of French would demonstrate the same scale. The experimental material consisted of 84 vowels, all extracted from the recording of 20 long semi-spontaneous sentences whistled relatively slowly in a single session by the same whistler in controlled conditions (same whistling technique during the entire session, constant distance from the recorder and from the interlocutor, and background noise between 40 and 50 dBA). These 84 vowels (21 /i/, 21 /e/, 21 /a/ and 21 /o/) were chosen by taking into account statistical criteria based on the above analysis of whistled vowels in Silbo (cf. section 4.2). First, the final vowels of sentences were excluded from the vowels presented in our experiments as they are often marked by an energy decrease. Next, the selected vowels were chosen inside a confidence interval of 5% around the mean value of the frequencies of each vocalic interval. In this sense, the vowel frequency bands of the experiments do not overlap (figure 15).
Frequency distribution of vowels played in the experiments.

The sounds played in Experiment I concerned only the vowel nucleus without the consonant modulations, whereas the stimuli of the corpus of Experiment II kept up to 2 to 3 seconds of the whistled sentence preceding the vowel. This second experiment aimed at testing the effect of the acoustical context on the subject as well as at eliminating bias that might appear because of presenting nearly pure tones one after another. As a consequence, this second corpus consisted of 84 whistled sentences ending with a vowel. For both variants, among the 84 sounds, 20 (5 /i/, 5 /e/, 5 /a/, 5 /o/) were dedicated to a training phase and 64 (16 /i/, 16 /e/, 16 /a/, 16 /o/) to the test itself.
5.1.3 Design and procedure
For each experiment, the task was the following: participants listened to a whistled vowel and immediately afterwards selected the vowel type that he/she estimated was the closest to the one heard by clicking on one of the four buttons corresponding to the French letters «a», «é», «i», «o». The task was therefore a four-alternative forced choice (4-AFC). The interface, programmed in Flash-Actionscript, controlled the presentation of the sounds: first, the 20 sounds of the training phase in an ordered list presenting all the possible combinations of vowels; then, the successive 64 sounds of the test in a non-recurrent random algorithm. The subjects where tested in a quiet room with high-quality Sennheiser headphones.
5.2 Results
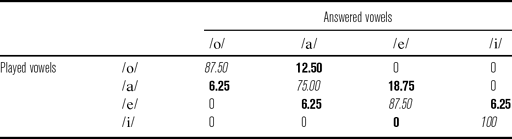
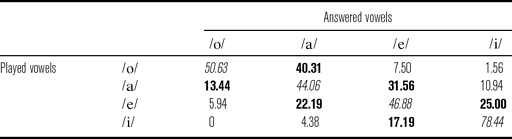
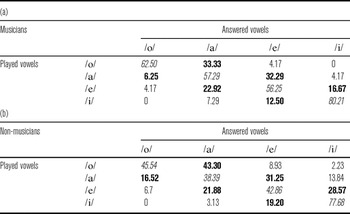
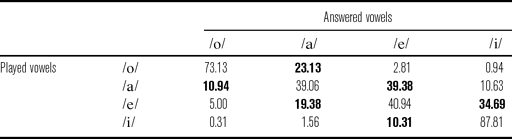
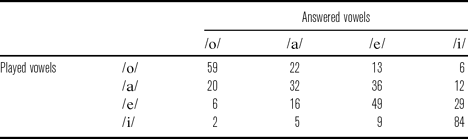
A specific program was developed to summarise the answers in confusion matrices either for individuals (table 4) or for all participants (tables 5–8) and to present them graphically by reintegrating some information regarding, for example, the frequency distribution of played vowels (figure 15). In tables 4–7, values in italics correspond to correct answers and values in bold correspond to confusions with neighbouring-frequency vowels.
Confusion matrix for the answers of a native whistler for isolated vowels (in %).

Confusion matrix for the answers of 20 subjects for isolated vowels (in %).

Confusion matrices in % for the answers of (a) musicians and (b) non-musicians (isolated vowels).

Confusion matrix for the answers of 20 subjects for whistled vowels in context (in %).

Confusion matrix of the answers for 20 subjects in the training phase, listening to whistled vowels in context (in %).

5.2.1 Reference performance of a whistler
Table 4 shows the performance on whistled vowel identification by a native whistler of La Gomera (Experiment I on isolated vowel, representing the most difficult task). The high level of correct answers (87.5%) confirms that a native whistler practising nearly daily Spanish whistled speech identifies accurately the four whistled vowels [χ 2(9)= 136.97, p < .0001] (as predicted by Classe Reference Classe1957). The variability of pronunciation of the vowels in spontaneous speech and the distribution of the played vowels (figure 15) explain the few confusion errors.
5.2.2 Results for the identification of isolated vowels (Experiment I)
The mean level of success corresponding to correct answers in Experiment I was 55%. Considering the protocol and the task, these results are largely above chance (25%) [χ2(9)= 900.39, p < .0001)]. But the mean rates of correct answers varied largely as a function of the vowels. Moreover, most of the confusions can be qualified as logical in the sense that a vowel was generally confused with its neighbouring-frequency vowels (83% of the cases of confusion: bold letters in table 5).
In order to determine the influence of the individual frequency of each played vowel on the pattern of answers of the subjects, the results of the answers were also presented as a function of the frequency distribution of the whistled vowels presented during the experiment (figure 16). In this figure, the estimated curves of the answers appear averaged by polynomial interpolations of the second order.
Intuitive perception of the isolated Spanish whistled vowels by 20 French subjects (distribution of the answers as a function of the played frequencies).

5.2.2.1 Inter-individual variability and confusions
Two participants have very high performances with 73.5% correct answers. Then a group of six persons has more than 40 correct answers for 64 sounds (62.5%). Four other persons follow them with more than 58% correct answers. This means that half of the participants in general have good performance on the task. The ten other participants all have performances of correct answers between 37% and 54%.
Generally speaking, the less efficient participants still had a confusion matrix with logical confusions: relatively low performance often due to confusions between different vowels whistled at close frequency values.
The variability of performance also depended on the particular vowel: for /i/ most of the participants had very good success, as 16 of them obtained a score over 75% – two with 100% correct answers. The least efficient participant reached a rate of 56% correct answers. For /o/, six persons identified more than 62.5% of the vowels correctly. All the others often mistook the /o/ for /a/. The /a/ was the least well-identified letter, often mis-categorised as an /e/ or sometimes as an /o/. The /e/ was confused equally with its whistled neighbours /a/ and /i/. The lower performances for /a/ and /e/ can be partly explained by the fact that they both have two perceptual neighbours in terms of pitch, a situation which multiplies the possibilities of confusion in comparison to the more isolated vowels /i/ and /o/. In spite of this situation, the most efficient participants categorised them successfully as different vowels through the pitch they perceived. Finally, the more frequent confusions were the following: the /o/ was often thought of as an /a/ and the /a/ and the /e/ were reciprocally often mistaken for one another.
5.2.2.2 Differences between musicians and non-musicians
Among the subjects of this experiment, six were musicians. The results of this group were significantly different from the 14 non-musicians [F(1,18) = 6.71, p < .02] in that the musicians had more success on the task than the non-musicians (64% correct answers versus 51%, cf. table 6).
5.2.2.3 Conclusion
All the analyses detailed above support the fact that the French subjects were able to categorise the whistled vowels «a», «é», «i», «o»; however, they were not as accurate as a whistler from La Gomera [p < .001]. Nonetheless, the tendencies of the curves of correct answers show that the French-speaking subjects in general have good performance on the task. This was despite presenting isolated vowels without any sound context (except that of the preceding vowel). Moreover, some participant performances revealed an effect of a preceding vowel on the following answer. For example, if for a whistled /e/ an answer /a/ was given, and if the following played vowel was an /a/, the participants had the tendency to mistake it with /o/. Consequently, one can observe a cascading effect of logical confusions that stops when there is a significant frequency jump. This confirms that non-whistler subjects perceptually floor their vowel prototypes in a distribution that depends on the frequency. In these conditions, it is not surprising to note that the musicians have better performance, because they are more used to associating an isolated pitch with a culturally marked sound reference. Despite randomisation of item presentation, this cascading effect is difficult to control with only four types of vowels. For this reason, Experiment II was developed.
5.2.3 Results for the identification of vowels with preceding sentence context (Experiment II)
This second experiment aimed at testing the effect of context on vowel perception. Specifically, we hypothesised that by using an approach closer to the ecological conditions of listening by whistlers – who do not perceive vowels in isolation but integrated into the sound flow – one could observe a suppression of the cascading effect of confusions.
The results show the same general tendencies as for Experiment I, with slightly better performance on the identification task: 60.2% [χ2(9) = 1201.63, p < .0001]. The whistled vowels /o/ and /i/ were even better identified than in Experiment I (respectively 73.13% and 87.81%) whereas the vowels /a/ and /e/ were slightly less well identified (see table 7 for percentages and figure 17 for estimated curves of answers).
Distribution of the answers as a function of the frequencies of the whistled vowels. Intuitive perception of the Spanish whistled vowels by 20 French subjects (vowels with preceding context).

5.2.3.1 Confusions and inter-individual variability
Eight persons had a success score above 62.5%. Three others even had scores above 73%. The best participant reached an overall score of 75%. In contrast, the least efficient participant obtained a score of 46%, which was more than in Experiment I. For the confusions, the better scores for /o/ showed that it is less thought of as an /a/, whereas /a/ was still often confused with /e/. Finally, and this is new, /e/ was often thought of as an /i/ with strong differences between participants. It was often at the level of the identification of /a/ and /e/ that differences were found between subjects with high scores and subjects with lower scores.
5.2.3.2 No difference between musicians and non-musicians
Again, there were six musicians among the participants (despite the fact that the participants in each experiment were distinct). An analysis of variance similar to the one performed for Experiment I showed that this time the results of the musicians were not significantly different from those of non-musicians [F(1,18) = 6.71, n.s.]. The context effect facilitated the choices by the non-musicians without affecting the performance of the musicians.
5.2.3.3 Limited learning effect of training
Because of the elimination of the confusions specific to Experiment I (due to successive presentation of isolated vowels), it is relevant in Experiment II to compare performance on the test with performance in the training phase in order to see if there is a learning effect. One can note again that answer distribution is far from chance [χ2(9)= 1113.47, p < .0001], and the tendencies described for the test were already at play in the training (table 8). These results were obtained in a first contact with whistled vowels with only 20 occurrences of vowels. As a consequence, this finding supports the fact that the subjects are relying on categorisations that are already active in their linguistic usage.
5.3 Conclusions and discussion of implications for theory
The results obtained in the two identification experiments show that the French participants – whose native language has vowels similar to those of Spanish /i, e, a, o/ – succeed in categorising the whistled emulations of these vowels without any preliminary cues on the phenomenon of whistled languages and even listening to such whistled sounds for the first time. The distribution of their answers is similar to the cognitive representation of the whistlers. The fact that this ability is already stable during the training phase shows that the tested subjects were already familiar with a perceptual representation of the vocalic inventory in the frequency scale. This suggests that such a representation, with /i/ identified as an acute vowel, /o/ as a low vowel, and /e/ and /a/ in between – /e/ a little higher in pitch than /a/ – plays an important role in the process of identification of the spoken French vowels /i, e, a, o/. Finally, these experiments also confirm that whistlers rely on a perceptual reality at play in spoken speech to transpose the vowels to whistled frequencies.
By using a protocol based on perception, these experiments draw attention to the importance of perceptual processes in the selection of the parts of the voice frequency spectrum transposed in whistled phonemes. Several researchers have tested the mechanism of vowel perception with various tasks of identification, discrimination, or matching. To clarify the implications of the experiments described in this paper, the results of some of these perceptual studies are of great interest. For example, a distribution of vowels in frequency scales is characteristic of perceptual studies based either on the notion of perceptual integration between close formants (Chistovitch & Lublinskaya Reference Chistovitch and Lublinskaja1979; Chistovitch et al. Reference Chistovitch, Sheikin, Lublinskaja, Lindblom and Öhman1979; Chistovitch Reference Chistovitch1985) or on the notion of an effective upper formantFootnote 4 (F2ʹ) (Carlson, Granström & Fant Reference Carlson, Granström and Fant1970, Bladon & Fant Reference Bladon and Fant1978). According to Stevens, these notions highlight strong effects in the classification of vowels, because ‘some aspects of the auditory system undergo a qualitative change when the spacing between two spectral prominences becomes less than a critical value of 3.5 bark’ (Stevens Reference Stevens1998: 241). Stevens illustrates the perceptual importance of formant convergence showing the correspondence between the perceived effective upper formant and the compact areas in a spectral analysis of some vowels. Schwartz & Escudier (Reference Schwartz and Escudier1989) show that a greater formant convergence explains better performance in vowel identification and a better stability of vowels in short-term memory. In these studies, human hearing has been shown to be sensitive to the convergence of F3 and F4 for /i/, F2 and F3 for /e/, and F2 and F1 for both /a/ and /o/. The distributions of whistled vowel frequencies in Greek, Spanish and Turkish are consistent with these parameters. One can also find the clear distinction between /i/ and the other vowels that was found for whistled Turkish, Greek and Spanish, and also in Siberian Yupik and Chepang. The grouping of posterior and central vowels in two different categories is also explained by these considerations of formant convergence. Finally, from the perspective of perception, the prominence of close formants is the most coherent explanation of both the whistled transposition of vocalic qualities and the performance of the French participants.
6 General conclusions
The present study has examined the strategies of whistled speech and their relationship to the phonetics of several types of languages. Whistled language has been found by the author to be a more widespread linguistic practice than the literature implies. The terminology ‘style of speech’ is confirmed here to qualify it accurately, and its acoustic strategy is shown to be in logical continuity with the acoustic strategy of shouted voice. Whistled forms of languages also develop the properties of a natural telecommunication system with a reduced frequency band well adapted to both sound propagation and human hearing. The direct consequence is that the practice of whistled speech classifies the languages of the world into frequency types. Another consequence is that this practice selects for each language salient features which play key roles for intelligibility. One language type, represented in this study by Greek, Turkish and Spanish, has been identified as particularly interesting to further elucidate the functional role of vowel formant distributions and of modulations in consonants. New statistical analyses of original data from these languages show that their vowel inventories are organised in frequency scales. The consonants are whistled in transients formed by the combined frequency and amplitude modulations of surrounding vowels. Moreover, this paper has shown using psycholinguistic experiments that the frequency distribution of whistled vowels is also perceptually relevant to non-whistlers. Indeed, French subjects knowing nothing about whistled languages categorise Spanish whistled vowels /i, e, a, o/ in the same way as Spanish whistlers, even without any training. This suggests that the listeners already have in their cognitive representation a frequency scale to identify spoken vowels. It also supports the assertion of whistlers who affirm that they rely on a perceptual reality of spoken speech to transpose vowels into whistled frequencies. As a consequence, the practice of whistled speech naturally highlights important aspects of vowel identification, even for languages with large vocalic inventories such as Turkish. Finally, the perceptual experiments demonstrate that whistled speech provides a useful model for further investigating the processes of perceptual selection in the complex distribution of vowel formants. In the research on whistled Spanish – which was in the past the most investigated whistled language – both the analyses of production and perception of whistled vowels support the observations of Classe (Reference Classe1957) that at least four whistled vowels are phonetically different for whistlers of La Gomera, causing us to reject the theory that states that only two vowels are perceived in Silbo (Trujillo Reference Trujillo1978).
To conclude, whistled languages provide a relevant way both to trace language diversity and to investigate cognitive linguistic processes, as they give complementary insight into phonology and phonetics in a wide range of languages. Whistled speech has been shown here for the first time to represent a strong model for investigating the perception of spoken language in general. At a sociolinguistic level, all these assets are tempered by the fact that whistled speech is rapidly losing vitality in all the cultures cited here because it is linked to traditional rural ways of life. This situation underscores the emblematic position of the linguistic communities which still practise whistled speech: they are living in remote forests and mountains; they still master most of their traditional knowledge and their native languages; but their cultures are dying rapidly. For the scientific community, this is a tremendous loss, not only for linguists but also for biologists, because the ecosystems that these populations live in are very poorly described. That is why the investigation presented in this paper has resulted in an international research network with the participation of and under the control of local traditional leaders.Footnote 5
Acknowledgements
I would like to thank the whistlers and the cultural leaders who took time to work with me in the field. I would like to thank L. Dentel for her volunteer recording work during my fieldwork and her advice in programming, Prof. R-G. Busnel and Prof. C. Grinevald for their strong scientific support during the past five years, B. Gautheron for his advice and for the preservation of precious data on Turkish whistling, F. Meunier for her advice on psycholinguistics and her review of a previous version of the section about the categorisation tests, the organisers of the FIPAU 2006 Forum for their help in inviting two Siberian Yupik whistlers to France, R. Caughley for lending me material on Chepang, Prof. D. Moore for his expertise in Amazonian languages and his advice on this article, Prof. A. Rialland and Prof J. Esling for their expert advice on this article, the staff of the Laboratoire Dynamique Du Langage (DDL-CNRS) for their support, and the team of the Laboratory of Applied Bioacoustics (LAB) of the Polytechnic University of Catalunya (UPC). This research was partly financed by a BDI Ph.D. grant from the CNRS and by a Post-Doc Fyssen Foundation grant.