Implications
A key challenge to be met by scientists that work on the efficiency of ruminant production is to understand which genes control nutrient metabolism and partitioning between tissues or which genes control tissues growth and physiology. Understanding how rearing practices affect these genes has implications on the profitability of ruminant production. Quantitative real-time PCR is a method of choice to identify genes that are regulated by rearing factors as long as an accurate data normalisation is processed. Our data propose to the scientific community a selection of reference genes for accurate data normalisation that depend on the tissues or the ruminant species that are included in comparative studies.
Introduction
The measurement of mRNA abundance in ruminant tissues by reverse transcription quantitative real-time PCR (RT-qPCR) had gained much popularity during the last decade because of the increased number of available mRNA sequences. Furthermore, the high efficiency and promptness of this method for quantifying weakly abundant mRNAs, mRNA from small amounts of tissues or small numbers of cells has been invaluable. RT-qPCR is the method of choice for quantifying mRNA abundance as long as corrections are made for variations in the quality of the RNA preparations and in the efficiency of the enzymatic RT and PCR reactions between the samples that are to be compared (Bustin, Reference Bustin2000 and Reference Bustin2002; Bonnet et al., Reference Bonnet, Leroux, Chilliard and Martin2001). To correct for variations in the efficiency and quality of the RNA extraction and RT-qPCR-associated enzymatic reactions, the abundance of a target mRNA must be compared with the abundance of a reference mRNA that is extracted and quantified concomitantly and, thus, used as an endogenous standard. This standard, which is often referred to as a ‘housekeeping gene’, is now referred to as a reference gene as the publication of the MIQE Guidelines (Bustin et al., Reference Bustin, Benes, Garson, Hellemans, Huggett, Kubista, Mueller, Nolan, Pfaffl, Shipley, Vandesompele and Wittwer2009). To be suitable for data normalisation, the expression of a reference gene should not vary between different types of tissues, cells or treatments (Vandesompele et al., Reference Vandesompele, De Preter, Pattyn, Poppe, Van Roy, De Paepe and Speleman2002). Moreover, one or multiple validated reference genes may be used for data normalisation, and the minimum number of genes that are required to calculate a reliable normalisation factor (NF) and the stability of the putative reference genes could be found by utilising the geNorm procedure that was proposed by Vandesompele et al. (Reference Vandesompele, De Preter, Pattyn, Poppe, Van Roy, De Paepe and Speleman2002). Thus, the identification of several reliable reference genes is a current challenge for researchers that use RT-qPCR assays.
The efforts that are currently being made to validate the stability of suitable reference genes in ruminants have proposed reference genes for data normalisation mainly in one tissue from one species. However, some current studies in ruminants are devoted to the identification of tissue- or species-specific responses to nutritional (Bonnet et al., Reference Bonnet, Leroux, Faulconnier, Hocquette, Bocquier, Martin and Chilliard2000; Bernard et al., Reference Bernard, Leroux, Bonnet, Rouel, Martin and Chilliard2005; Thering et al., Reference Thering, Graugnard, Piantoni and Loor2009), physiological (Bonnet et al., Reference Bonnet, Faulconnier, Leroux, Jurie, Cassar-Malek, Bauchart, Boulesteix, Pethick, Hocquette and Chilliard2007; Graugnard et al., Reference Graugnard, Piantoni, Bionaz, Berger, Faulkner and Loor2009) or environmental (Faulconnier et al., Reference Faulconnier, Bonnet, Bocquier, Leroux and Chilliard2001) variations. For this purpose, RT-qPCR could be used to compare the abundances of candidate mRNAs in several tissues or in several ruminant species. Unfortunately, reference genes for suitable normalisation in comparative studies including various tissues or ruminant species remain to be proposed. Thus, the objective of the present study was to propose reference genes that are suitable for robust data normalisation in up to four tissues and two ruminant species. To achieve this objective, we assayed the abundance of eight reference genes in the following single or combinations of tissues: adipose tissue (AT), liver, mammary gland and/or muscle. Each of these tissues was chosen for their quantitative importance in body-nutrient use, partitioning and metabolism. Moreover, these tissues were targeted in past and current comparative studies that aimed to identify the tissue- or species-specific responses to nutritional, physiological or environmental variations in relation to animal metabolic efficiency (Niemann et al., Reference Niemann, Kuhla and Flachowsky2011), and these tissues will certainly be targeted in future studies. We proceeded to select reference genes in tissues from bovine and caprine species, which were chosen for their peculiarities in feeding behaviours and ruminal fermentation processes. Such peculiarities could induce differences in tissue metabolism, as was recently illustrated for lipid metabolism in mammary gland and AT (Bernard et al., Reference Bernard, Leroux, Rouel, Bonnet and Chilliard2012). To propose sets of reference genes that should not vary by the type of tissue, ruminant species or treatment, we assayed the abundances of reference gene mRNAs from tissues that were sampled in animals that differed by their diet, breed and/or physiological status.
Material and methods
Animals
All experimental procedures were approved by the Animal Care Committee of the INRA in accordance with the Use of Vertebrates for Scientific Purposes Act 1985. Limousin, Angus and Blond d'Aquitaine steers and Holstein and Normande cows (Supplementary Table 1) were chosen for their difference in physiological status (i.e. growing, dry and lactating), adiposity (i.e. high and low) and nutrition (i.e. hay- and concentrate-based diet that was or was not supplemented with dietary lipids). Alpine goats (Supplementary Table 1) were chosen for their differences in lactation stages (i.e. mid- and late-lactation) and nutrition (i.e. fasted for 48 h, ad libitum feeding, hay- or concentrate-based diet that was or was not supplemented with dietary lipids, and the level and nature of the starch in the concentrate). Precise descriptions of the treatment groups, nutrition and characteristics of the animals were previously described (Gruffat et al., unpublished; Bonnet et al., Reference Bonnet, Faulconnier, Leroux, Jurie, Cassar-Malek, Bauchart, Boulesteix, Pethick, Hocquette and Chilliard2007 and Reference Bonnet, Cassar-Malek, Bauchart, Chilliard, Jurie, Thomas and Normand2011; Faulconnier et al., Reference Faulconnier, Chilliard, Torbati and Leroux2011; Bernard et al., Reference Bernard, Leroux, Rouel, Bonnet and Chilliard2012) except for two experiments on Holstein cows and Alpine goats. Eight lactating Alpine goats were fed natural grassland hay (1.3 kg/day) with a mixture of concentrates (Centraliment, Aurillac, France) to give a 55 : 45 forage-to-concentrate ratio in the diet or natural grassland hay that was supplemented with 340 g/day extruded linseed and 39 g/day of fish oil (SA Daudruy Van Cauwenberghe & Fils, Dunkerque, France) for 21 days before mammary sampling. Six lactating cows were fed with a high, hay-based diet (11.7 kg/day) or concentrate-based diet (8.7 kg/day) that contained 710 g/day of sunflower oil (Huilerie de Lapalisse, Lapalisse, France) for 21 days before mammary sampling (Supplementary Table 1).
Selection of reference genes to be used for data normalisation and of a target gene
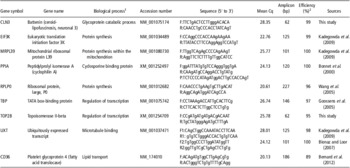
A description of the eight selected reference genes is given in Table 1. Battenin (i.e. ceroid-lipofuscinosis, neuronal 3 and CLN3) was chosen because it has been previously reported to be the most stable reference gene in human AT over a wide range of parameters such as sex, age, body mass index, depot origin, biopsy procedure and nutrition (Gabrielsson et al., Reference Gabrielsson, Olofsson, Sjogren, Jernas, Elander, Lonn, Rudemo and Carlsson2005) as well as in bovine AT (Hosseini et al., Reference Hosseini, Sauerwein and Mielenz2010). Eukaryotic translation initiation factor 3K (EIF3K), mitochondrial ribosomal protein L39 (MRPL39) and ubiquitously expressed transcript isoform 2 (UXT, primer pair 1; Table 1) were chosen because they were proposed to be suitable reference genes in bovine mammary gland at any lactation stage (Bionaz and Loor, Reference Bionaz and Loor2007) or when lipid was supplemented into the diet (Kadegowda et al., Reference Kadegowda, Bionaz, Thering, Piperova, Erdman and Loor2009). Peptidylprolyl isomerase A (cyclophilin A, PPIA) was found to be stable in bovine AT, muscle at any nutritional status (Bonnet et al., Reference Bonnet, Leroux, Faulconnier, Hocquette, Bocquier, Martin and Chilliard2000) and breed adiposity (Bonnet et al., Reference Bonnet, Faulconnier, Leroux, Jurie, Cassar-Malek, Bauchart, Boulesteix, Pethick, Hocquette and Chilliard2007) and in AT and mammary gland from lactating goats that were fed any diet (Bernard et al., Reference Bernard, Leroux, Bonnet, Rouel, Martin and Chilliard2005) and at any lactation stage (Bonnet et al., Reference Bonnet, Delavaud, Bernard, Rouel and Chilliard2009). Ribosomal protein large P0 (RPLP0) was chosen because it has been previously reported to be the most stable reference gene in bovine muscle of any breed-related adiposity (Wang et al., Reference Wang, Byrne, Reverter, Harper, Taniguchi, McWilliam, Mannen, Oyama and Lehnert2005). TATA box-binding protein (TBP) and topoisomerase II-beta (TOP2B) were chosen because they have been previously reported to be the two most stable reference genes in porcine AT and any muscle tissues (Erkens et al., Reference Erkens, Van Poucke, Vandesompele, Goossens, Van Zeveren and Peelman2006). Platelet glycoprotein 4 (fatty acid translocase, CD36) was chosen as the target gene because of its significant metabolic implication for fatty acid uptake in AT, mammary gland, liver and muscle.
Name and function of the candidate reference and target (CD36) genes, the Genebank accession number, sequences for specific oligonucleotide primer pairs (F = forward, R = reverse) or TaqMan Probe (P), the mean quantification cycle (Cq), the expected amplicon size (bp) and the mean PCR efficiency

1Biological processes were provided by the Gene Ontology Annotation (UniProtKB-GOA) Database http://www.ebi.ac.uk/GOA/ and the David database http://david.abcc.ncifcrf.gov according to Gene Ontology (search for GO done in January 2012).
2These efficiencies were obtained at an annealing temperature of 58°C for CLN3; 60°C for PPIA, TBP, RPLP0, EIF3K, UXT1, UXT2 and TOP2B; and 62°C for MRPL39. PCR setups: an initial denaturing step (95°C for 10 min), the PCR mixture was subjected to the following two-step cycle, which was repeated 40 times: denaturing for 15 s at 95°C and annealing and extension for 45 s at a hybridisation temperature that was specific to the gene that was being amplified.
Determination of tissue mRNA abundance by RT-qPCR
Within 30 min after slaughter, all the tissues were frozen in liquid nitrogen and stored at −80°C until analysis. Total RNA was prepared as previously described from bovine subcutaneous or caprine omental AT (2 g), muscle (0.5 g; Bonnet et al., Reference Bonnet, Faulconnier, Leroux, Jurie, Cassar-Malek, Bauchart, Boulesteix, Pethick, Hocquette and Chilliard2007; Faulconnier et al., Reference Faulconnier, Chilliard, Torbati and Leroux2011), liver (0.4 g) and mammary gland (0.1 g; Bernard et al., Reference Bernard, Leroux, Rouel, Bonnet and Chilliard2012). Briefly, tissues were homogenised with a POLYTRON® System PT 4000 (Kinematica, Fisher Scientific SAS, Illkirch, France) in 1 ml (muscle, liver, mammary gland) or 7.5 ml (AT) of TRIzol Reagent (Invitrogen Life Technologies, Cergy Pontoise, France) by centrifugal force (30 000 rpm for <1 min). Tissue homogenates were supplemented with 0.20 volumes of chloroform, mixed thoroughly and centrifuged at 12 000 × g for 15 min. Supernatant were supplemented with 1 volume of 70% ethanol mixed thoroughly and transfered to column for RNA purification. Either PureLink RNA Mini (Invitrogen Life Technologies) or NucleoSpin RNA II (Macherey Nagel, Hoerdt, France) kits were used for RNA purification, and both allowed RNA extraction with high quality. Residual DNA was further eliminated using DNase I treatment (Invitrogen Life Technologies) to eliminate putative contaminating genomic DNA. Total RNA were extracted from tissues stored at −80°C within the 4 years following animal slaughter and stored immediately after their extraction at −80°C.
For this study, before the RT assay carried out at the same time for all the tissues, RNA concentrations were determined by measuring the absorbance at 260, 280 and 320 nm using an ND-1000 spectrophotometer (NanoDrop, Labtech, Palaiseau, France). RNA integrity (RIN) was also determined using a 2100 Bioanalyzer (Agilent Technologies, Massy, France) and was found to be between 8 and 10 (Supplementary Figure 1). Two micrograms of purified, total RNA were reverse transcribed with a mix of poly-T and random hexamer primers using the RNA to cDNA kit and following the manufacturer's recommendations (Applied Biosystems, Courtaboeuf, France) in a final volume of 20 μl. We verified the lack of DNA contamination by a PCR amplification using β-actin primers flanking an intron (F 5′-GAC TAC CTC ATG AAG ATC CTC-3′ and R 5′- CGG ATG TCC ACG TCA CAC TTC-3′). For previously published primers (Table 1) and primers that were designed for this study (i.e. CLN3 and TOP2B; Table 1), the specificity against the gene of interest was analysed by a dissociation curve (Supplementary Figure 2), which is indicative of a single amplicon in bovine and caprine, after the RT-qPCR experiment. In addition, the designed primers for this study were submitted to a BLAST search against the human genomic plus transcript, mouse genomic plus transcript, non-human non-mouse expressed sequence tags and reference RNA sequence databases that are deposited at the National Center for Biotechnology (http://www.ncbi.nlm.nih.gov/blast/). Primer pairs that showed more than 50% similarity with nucleotide sequences other than the gene of interest were discarded. Thus, one primer pair per gene was chosen to allow for an efficient amplification in bovine and caprine species. qPCR was performed using 5 μl of 50-fold-diluted, single-stranded cDNA using the StepOnePlus™ real-time PCR system (Applied Biosystems, Courtaboeuf, France), SYBR Green dye (TF Power SYBRGreen PCR Master Mix) or a fluorescent TaqMan probe (TF TaqManFast Universal PCR Master Mix) and according to the manufacturer's instructions (Applied Biosystems). Specific primers (10 pmol/μl; Eurogentec, Seraing, Belgium) and for the PPIA qPCR 10 pmol/μl of TaqMan probe (Applied Biosystems, Warrington, UK) were also used in the assay. Quantification cycle to threshold (Cq) values were obtained in duplicate for each sample, the coefficient of variation was calculated for all duplicates (after transformation of Cq values taking into account the efficiency of the individual genes), and 0.2 was used as the cut-off value. For PPIA and CD36, calibration curves were generated from five-point serial dilutions of a plasmid DNA constructs, as previously described (Bonnet et al., Reference Bonnet, Leroux, Faulconnier, Hocquette, Bocquier, Martin and Chilliard2000). Calibration curves for all other genes were generated from five-point serial dilutions of a pool of cDNAs from goat AT, mammary gland and liver or from bovine AT, mammary gland, muscle and liver (eight samples per tissue). A same mRNA per species was quantified in one PCR plate. The resulting calibration curves demonstrated high efficiencies from 95% to 100% (Table 1), as calculated by E = [10(−1/slope)−1] × 100, and a minimum r 2 of 0.99 was obtained. The Cq differences between runs for the five points of the calibration curves, were below the cut-off value of 1 except for TBP, EIF3K and UXT2 primers. From the present and previous experiments, we recorded that means of inter-run Cq differences were 2.1 for TBP, 1.4 for UXT2 and 1.1 for EIF3K.
Analytical protocol for reference gene selection
To determine the most stable genes and the optimal number of genes that should be used for normalisation, relative mRNA amounts were entered directly into the Excel Macro geNorm analysed following the procedures of Vandesompele et al. (Reference Vandesompele, De Preter, Pattyn, Poppe, Van Roy, De Paepe and Speleman2002). The application geNorm is now part of qBASEplus (Biogazelle, Ghent, Belgium). The gene expression stability (M) value for each gene and the number of reference genes that should be used to calculate the NF were then calculated using geNorm. Briefly, M was determined as the average, pair-wise variation of each gene with all other reference genes. Genes with the lowest M values have the most stable abundance regardless of the experimental conditions or cell type. Using the software, the optimal number of reference genes that should be used for normalisation was calculated as the pair-wise variation (V) between the NF that was obtained with n genes (NFn) and the NF that was obtained using n + 1 genes (NFn + 1). Vandesompele et al. (Reference Vandesompele, De Preter, Pattyn, Poppe, Van Roy, De Paepe and Speleman2002) proposed a cut-off value of 0.150 for the pair-wise variation (V), which reflects the lack of effect from adding a (n + 1)th gene. Once the most stable genes and the optimal number of genes are selected, the normalisation factors (NFn) are calculated based on the geometric means of the expression levels of n best reference genes (Vandesompele et al., Reference Vandesompele, De Preter, Pattyn, Poppe, Van Roy, De Paepe and Speleman2002).
Statistical analysis
Differences between the two treatment groups for the normalised abundance of CD36 mRNA were tested using the non-parametric Mann–Whitney U-test, and differences were considered to be significant when P < 0.05. Such differences were tested for the abundance of a candidate gene that was normalised with the most or least stable reference genes.
Results
Evaluation of gene expression stability
To evaluate the expression stability of the eight selected genes under different conditions, we collected samples from bovine and caprine species that varied regarding breed, age, nutrition and stage of lactation. Four tissues from 42 animals were used for gene expression analysis by RT-qPCR. Primers that were designed for TOP2B allowed for specific amplification in bovine but not in caprine. Thus, we tested eight reference genes in bovine and seven genes in caprine.
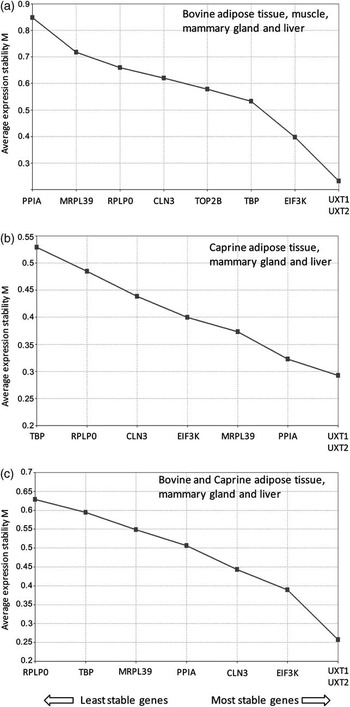
The mRNA abundances of each reference gene within bovine and caprine tissues were used as the inputs for the geNorm analysis. The results of the gene expression stability, M values, varied between tissues and species and were reported for each or both species and tissues (Figure 1). In bovine, UXT, EIF3K and TBP were the most stable genes in AT, muscle, mammary gland and liver (Figure 1a). In caprine, genes with the highest stability were UXT, PPIA and MRPL39 in the mammary gland, AT and liver (Figure 1b). In bovine and caprine mammary gland, AT and liver, the most stable genes were UXT, EIF3K and CLN3 (Figure 1c).
Expression stability values (M) and rankings of the reference genes as determined by geNorm software during stepwise exclusion of the least stable reference gene are shown in (a) bovine adipose tissue, muscle, mammary gland and liver; (b) caprine; and (c) bovine and caprine adipose tissue, mammary gland and liver.

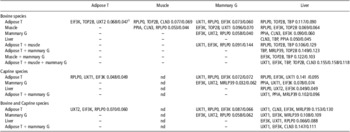
Because the ranking of reference genes according to their expression stability varied depending on the species and tissues, 29 different analyses with geNorm were performed to propose a selection of reference genes for one and up to four different tissues in bovine and/or caprine species (Table 2). Therefore, we proposed 29 sets of reference genes that depended on the tissue and/or ruminant species that were under investigation. For example, among the 29 proposed sets of reference genes, UXT, EIF3K and RPLP0 are the most stable reference genes in bovine AT, muscle and mammary gland; whereas UXT, EIF3K, CLN3 are the most stable reference genes in bovine and caprine AT, mammary gland and liver (Table 2).
Reference gene selections for quantitative real-time PCR normalisation. Selections differ depending on the tissues or species or combinations of tissues and species. A selection of three to five reference genes is proposed to normalise the mRNA abundance of the target genes that were assayed in one or up to four different tissues in bovine and/or caprine species

nd = not determined; adipose T = adipose tissue; mammary G = mammary gland; UXT1 = UXT mRNA abundance that was assayed with the first primer pairs (F1, R1); UXT2 = UXT mRNA abundance that was assayed with the second primer pairs (F2, R2).
1Pair-wise variation between the normalisation factors NFn and NFn + 1; the first, second and third number is the comparison between the use of 2 v. 3, 3 or 4 and 4 or 5 reference genes, respectively, to calculate the normalisation factor.
Evaluation of the number of reference genes that are required for data normalisation
The optimal number of genes for data normalisation was assayed for the 29 different geNorm analyses, and the values for the pair-wise variation (V) of the NF, which was calculated using two v. three genes, three v. four genes or four v. five genes, were reported in Table 2. The values for V of the NF that was calculated with two v. three genes were below the cut-off value of 0.150. Thus, the three genes that have been proposed were required and sufficient for the calculation of an NF in all, but two analyses. The addition of a fourth gene decreased the pair-wise variation of NF from 0.153 to 0.130 and was required for data normalisation in bovine and caprine AT and liver. The addition of two more genes decreased the pair-wise variation of NF from 0.155 to 0.118; therefore, five reference genes were necessary for data normalisation in liver, AT, muscle and mammary gland from bovine (Table 2).
The abundance of CD36 mRNA that was normalised with the most or least stable, different reference genes
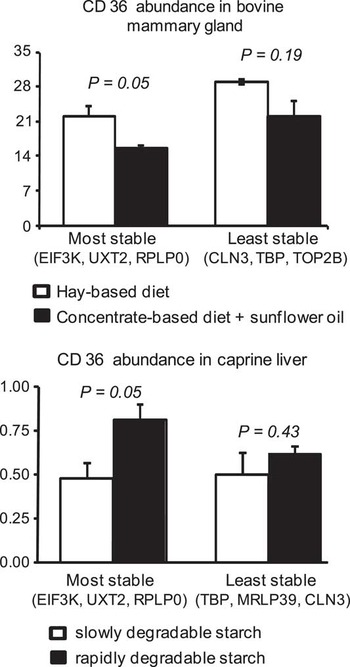
To evaluate how the choice of reference genes affects the final results, the abundances of CD36 mRNA in bovine mammary gland and caprine liver were normalised using the NF that was calculated from the most or least stable reference genes (Figure 2). The abundance of CD36 mRNA, which was normalised with the most stable reference genes, decreased (−30%, P = 0.05) in bovine mammary gland after the addition of sunflower oil to the diet and increased (+70%, P = 0.05) in the liver of goats that were fed flattened wheat rather than corn grain as a source of starch. The effects of the dietary treatments on the abundance of CD36 mRNA, which was normalised with the three least stable reference genes in each tissue, were not significant in any tissue.
CD36 relative expression in bovine mammary gland and caprine liver that was normalised to the most or least stable reference genes. The abundance of CD36 was assayed in mammary gland from bovine that were iso-energetically fed with hay (white bars) or concentrate plus sunflower oil (dark bars) and normalised with the geometric means of the abundance of EIF3K, UXT2, RPLP0 (which were the most stable) or TBP, TOBP2, CLN3 (which were the least stable). CD36 abundance was assayed in liver from caprine that were fed rapidly degradable (white bars) starch or slowly degradable starch (dark bars) and normalised with the geometric means of the abundance of EIF3K, UXT2, RPLP0 (which were the most stable) or TBP, MRLP39, CLN3 (which were the least stable). Error bars represent the s.e., and P-values indicate the significant difference between the two groups. EIF3K = eukaryotic translation initiation factor 3K; UXT = ubiquitously expressed transcript; RPLP0 = ribosomal protein large P0; TBP = TATA box-binding protein; TOBP2 = topoisomerase II-beta; CLN3 =ceroid-lipofuscinosis, neuronal 3; MRLP39 = mitochondrial ribosomal protein L39.

Discussion
No consensus on the identity of suitable reference genes for normalising gene expression abundances in any ruminant species and/or ruminant tissues exists. The present study proposed 29 sets of reference genes that could be used for gene expression data normalisation depending on the ruminant tissues (e.g. AT, muscle, mammary gland and liver) and/or the ruminant species (bovine or caprine) under investigation.
The relevance of the 29 sets of reference genes that we proposed could be checked by comparing some of our sets to those that were previously published for ruminant tissues. However, such comparisons were difficult because of the differences between the studies in the reference genes that have been tested. Nevertheless, some of the most stable reference genes that we proposed in our sets were also previously proposed as reference genes in ruminant tissues. Indeed, we proposed EIF3K, UXT and RPLP0, and Kadegowda et al. (Reference Kadegowda, Bionaz, Thering, Piperova, Erdman and Loor2009) proposed EIF3K, UXT and GPR175 as the most stable reference genes in mammary gland of lactating cows. The stability of GPR175 and RPLP0 were not tested in either study. EIF3K and UXT could be proposed as suitable reference genes in bovine mammary gland because they were ranked among the most stable genes in these two independent studies. In the liver of bulls that differed by age and breed, Lisowski et al. (Reference Lisowski, Pierzchala, Goscik, Pareek and Zwierzchowski2008) proposed TBP as the most stable gene among the six tested genes, which agreed with the ranking of TBP among the three most stable genes in our study. Wang et al. (Reference Wang, Byrne, Reverter, Harper, Taniguchi, McWilliam, Mannen, Oyama and Lehnert2005) proposed RPLP0 as the most stable reference by comparing it with GAPDH, 18S RNA, SDHA in bovine muscle. Interestingly, RPLP0 (with PPIA and CLN3) was one of the genes that we proposed to use for data normalisation in bovine muscle. Recently, Saremi et al. (Reference Saremi, Sauerwein, Dänicke and Mielenz2012) proposed EIF3K among the most stable gene for data normalisation in bovine AT, and mammary gland, as in our study. Some agreement between a subset of our results with those from other studies suggests that our 29 sets of reference genes are reliable for data normalisation in AT, muscle, liver and mammary gland from bovine and/or caprine. Moreover, they supplement the few sets of reference genes that are currently proposed for one tissue, one organ or one cell type from bovine (De Ketelaere et al., Reference De Ketelaere, Goossens, Peelman and Burvenich2006; Bionaz and Loor, Reference Bionaz and Loor2007; Lisowski et al., Reference Lisowski, Pierzchala, Goscik, Pareek and Zwierzchowski2008; Kadegowda et al., Reference Kadegowda, Bionaz, Thering, Piperova, Erdman and Loor2009; Bougarn et al., Reference Bougarn, Cunha, Gilbert, Meurens and Rainard2011; Saremi et al., Reference Saremi, Sauerwein, Dänicke and Mielenz2012; Varshney et al., Reference Varshney, Mohanty, Kumar, Kaushik, Dang, Mukesh, Mishra, Kataria, Kimothi, Mukhopadhyay, Malakar, Prakash, Grover and Batish2012) and caprine (Finot et al., Reference Finot, Marnet and Dessauge2011), as well as for bovine AT, mammary gland and liver (Saremi et al., Reference Saremi, Sauerwein, Dänicke and Mielenz2012), by providing the first sets of reference genes in various combinations of tissues from these two species.
Vandesompele et al. (Reference Vandesompele, De Preter, Pattyn, Poppe, Van Roy, De Paepe and Speleman2002) have suggested that a minimum of three reference genes should be used for normalisation of gene expression between samples from the same tissue. In the present study, 27 sets over 29 sets of reference genes that we proposed were composed of three reference genes, one set was composed of four reference genes, and one set was composed of five reference genes. More than three reference genes were required when the number of tissues or ruminant species that were included in the geNorm analysis was increased. This result coincides with the observation that five reference genes were required for data normalisation between samples from bovine mammary gland and AT (Saremi et al., Reference Saremi, Sauerwein, Dänicke and Mielenz2012). This finding is intuitive when comparing tissues with specific functions and structural properties or when animals with specific physiological status are compared. It is noteworthy that in our study, three reference genes were sufficient for data normalisation in the majority of cases, even if more than one tissue was considered in the geNorm analysis. This low number of genes could be related to the low M stability values of the eight reference genes (<0.09) when in any combination of tissues and/or species (Figure 1). Vandesompele et al. (Reference Vandesompele, De Preter, Pattyn, Poppe, Van Roy, De Paepe and Speleman2002) have indicated an M value of <1.5 as a cut-off value for suitability as an endogenous control, especially with heterogeneous samples such as different cell types or tissues. The low M values that we have observed were most likely the result of our selection of reference genes because we checked the stability of genes that were previously reported to be among the most stable reference genes in several studies. Thus, the rank order varies between the tissues and/or species that are compared, and the number of reference genes that are required for the calculation of a low-variability NF could be increased with the number of tissues or species that are compared.
The assessment of reference gene stability according to geNorm is based on a pair-wise comparison of the abundance of the reference genes (Vandesompele et al., Reference Vandesompele, De Preter, Pattyn, Poppe, Van Roy, De Paepe and Speleman2002). The ratio of two ideal reference genes should not remain stable because of a co-regulation between these two genes. Therefore, we checked for a lack of co-regulation between the height reference genes that were included in our study by pair-wise searches (i.e. 36 combinations of two genes) for co-expression or co-citation. We checked co-expressions and co-abundances of the pair-wise reference genes by using all transcriptomic data sets that were stored in the Gene Expression Omnibus (GEO)-curated repository (http://www.ncbi.nlm.nih.gov/gds). No co-identification and, thus, no co-expression for the pair-wise reference genes have been currently reported for any of the data sets. Subsequently, we checked co-citations of the pair-wise reference genes in PubMed (http://www.ncbi.nlm.nih.gov/pubmed) to determine if any co-regulations had been reported. We did not find co-citations for 25 of the 36 combinations of pair-wise reference genes. For the remaining 11 combinations, we found 1 to 29 co-citations of two reference genes in previous publications. For example, UXT and EIF3K were co-cited in one publication (Kadegowda et al., Reference Kadegowda, Bionaz, Thering, Piperova, Erdman and Loor2009), and MRPL39 and UXT were co-cited in three publications (Bionaz and Loor, Reference Bionaz and Loor2007; Tramontana et al., Reference Tramontana, Bionaz, Sharma, Graugnard, Cutler, Ajmone-Marsan, Hurley and Loor2008; Kadegowda et al., Reference Kadegowda, Bionaz, Thering, Piperova, Erdman and Loor2009). All of the co-citations that we have identified were related to the selection of suitable reference genes and never to the co-regulation of two of the genes that were tested in the present study. Currently, there are no lines of evidence for co-regulation of the eight reference genes that were tested in the present study. Thus, all 29 sets of reference genes that we proposed in this paper could be used for data normalisation in AT, muscle, mammary gland and liver of bovine and/or caprine.
To illustrate the normalisation influence on the accuracy of mRNA abundances, we normalised the abundance of CD36 mRNA with either the most or least stable reference genes. A decrease in CD36 mRNA abundance in mammary gland of cows fed with a concentrate diet supplemented with sunflower oil was revealed when the normalisation was performed using the most stable reference genes. This decrease was expected because of the known inhibitory effect of CLA mix on CD36 gene expression in rat mammary gland (Gutgesell et al., Reference Gutgesell, Ringseis and Eder2009). Normalisation with the least stable reference genes also diminished the stimulatory effect on CD36 mRNA abundance in caprine liver by dietary flattened wheat when compared with maize grain as a source of starch. In ruminants, the hepatic regulation of CD36 expression remains poorly described; however, an increase in mRNA abundance of CD36 in response to dietary flattened wheat was expected. Indeed, dietary flattened wheat increased milk content of C18:2n-6 and C18:3n-3, which accounted for the increase in the content of these fatty acids in the plasma of goats (Bernard et al., Reference Bernard, Leroux, Rouel, Bonnet and Chilliard2012). C18:2n-6 and C18:3n-3 were reported to upregulate CD36 hepatic expression by activating PPARα, PPARγ and RXR in monogastrics (Frohnert and Bernlohr, Reference Frohnert and Bernlohr2000; Jump, Reference Jump2008). PPARγ mRNA was barely detectable, whereas PPARα and RXR were highly expressed in bovine (Cherfaoui et al., Reference Cherfaoui, Durand, Bonnet, Cassar-Malek, Bauchart, Thomas and Gruffat2012) and caprine (Toral et al., Reference Toral, Bernard, Delavaud, Gruffat, Leroux and Chilliard2013) livers. These dietary regulations were revealed because of the normalisation of CD36 mRNA abundance with the most, but not least, stable reference genes. These examples supplemented the repeatedly reported (Bionaz and Loor, Reference Bionaz and Loor2007; Finot et al., Reference Finot, Marnet and Dessauge2011) impact of the choice of reference genes on the interpretation of results.
In conclusion, this study showed that the ranking of the eight evaluated reference genes varied depending on the tissue and ruminant species that were included in the RT-qPCR studies. We proposed 29 sets of reference genes that could be used for data normalisation depending on the combinations of tissues (i.e. AT, muscle, mammary gland and/or liver) or ruminant species (bovine and/or caprine) that were used for gene expression comparisons. This study also showed that, in most of the sets, three reference genes were appropriate and suitable to calculate an NF. However, in studies using RT-qPCR methodology it is probable that increasing the number of species would increase the number of reference genes necessary to calculate an NF, as it was already reported for comparison between tissues. Thus, caution should be taken into account when increasing the numbers of species, and we recommended to test more than three reference genes for data normalisation.
Acknowledgements
The authors thank the farm and slaughterhouse staff at the INRA Theix Research Centre for animal care and handling. They thank Dr D. Gruffat for kindly providing us the bovine liver samples, and they also thank F. Glasser for helpful discussion concerning data interpretation.