





Adverse childhood experiences (ACEs) have been consistently associated with internalizing problems (e.g., depression or anxiety; Evans et al., Reference Evans, Li and Whipple2013). Internalizing problems are prevalent in childhood and are related to detrimental outcomes (e.g., school drop-out, substance use, suicidality; Liu et al., Reference Liu, Chen and Lewis2011). Much of the existing research is cross-sectional or retrospective, and longitudinal studies typically rely on a single cumulative ACEs score across childhood, thus limiting understanding of how ACEs unfold and influence mental health over time. Longitudinal research on ACEs has found that chronic trajectories of ACEs across childhood relate to increased adverse health outcomes at age 18 (Thompson et al., Reference Thompson, Flaherty, English, Litrownik, Dubowitz, Kotch and Runyan2015) and that changes to internalizing problems depend on when children experienced maltreatment (Keiley et al., Reference Keiley, Howe, Dodge, Bates and Petti2001). However, no research to date has examined the co-development of ACEs and internalizing problems across childhood despite calls for such examination (Schroeder et al., Reference Schroeder, Slopen and Mittal2020). Furthermore, although disparities based on race/ethnicity, sex, and income have been observed in the number of ACEs and the prevalence rates of internalizing problems (Anderson & Mayes, Reference Anderson and Mayes2010; Gutman & Codiroli McMaster, Reference Gutman and Codiroli McMaster2020; Lansford et al., Reference Lansford, Malone, Tapanya, Tirado, Zelli, Alampay, Al-Hassan, Bacchini, Bornstein, Chang, Deater-Deckard, Giunta, Dodge, Oburu, Pastorelli, Skinner, Sorbring and Steinberg2019; Mersky et al., Reference Mersky, Choi, Plummer Lee and Janczewski2021), limited longitudinal research has explored how ACEs and internalizing problems differ over time based on race/ethnicity, sex, and income. Thus, the current study aimed to examine the individual and co-developing longitudinal trajectories of cumulative ACES and internalizing problems and sociodemographic disparities that may exist within such trajectories.
Development of internalizing problems
In the United States (U.S), internalizing problems (e.g., anxiety and depression) are prevalent among children (Liu et al., Reference Liu, Chen and Lewis2011). Yet, the developmental trajectories of internalizing problems are poorly understood, given inconsistent findings in prior research. Recent studies have applied person-centered methodologies to identify distinct developmental patterns of internalizing problems across childhood. For example, Sterba et al. (Reference Sterba, Prinstein and Cox2007) studied youth ages 2–11, Davis et al. (Reference Davis, Votruba-Drzal and Silk2015) included children ages 4–15, and Klein et al. (Reference Klein, Schlesier-Michel, Otto, White, Andreas, Sierau, Bergmann, Perren and von Klitzing2019) examined a high-risk sample of youth aged 4–15. These studies identified three (Sterba et al., Reference Sterba, Prinstein and Cox2007) or four (Davis et al., Reference Davis, Votruba-Drzal and Silk2015; Klein et al., Reference Klein, Schlesier-Michel, Otto, White, Andreas, Sierau, Bergmann, Perren and von Klitzing2019) trajectories of internalizing problems, reflecting both stable and unstable patterns over time.
Stable trajectories included low (Davis et al., Reference Davis, Votruba-Drzal and Silk2015; Klein et al., Reference Klein, Schlesier-Michel, Otto, White, Andreas, Sierau, Bergmann, Perren and von Klitzing2019), moderate (Davis et al., Reference Davis, Votruba-Drzal and Silk2015; Klein et al., Reference Klein, Schlesier-Michel, Otto, White, Andreas, Sierau, Bergmann, Perren and von Klitzing2019), mean (Davis et al., Reference Davis, Votruba-Drzal and Silk2015), and high (Klein et al., Reference Klein, Schlesier-Michel, Otto, White, Andreas, Sierau, Bergmann, Perren and von Klitzing2019; Sterba et al., Reference Sterba, Prinstein and Cox2007) levels of internalizing problems. Although not fully stable, Sterba et al. (Reference Sterba, Prinstein and Cox2007), similarly to Davis et al. (Reference Davis, Votruba-Drzal and Silk2015) and Klein et al. (Reference Klein, Schlesier-Michel, Otto, White, Andreas, Sierau, Bergmann, Perren and von Klitzing2019), also found a low trajectory marked by consistently low levels of internalizing problems with slight fluctuations over time. In contrast, unstable trajectories, characterized by fluctuations in internalizing symptoms, whether increasing or decreasing across development, have also been observed. These include a decreasing/increasing (i.e., starting with elevated levels that decrease and later increase again; Sterba et al., Reference Sterba, Prinstein and Cox2007), a rising low to moderate (i.e., starting with low levels that steadily increase; Klein et al., Reference Klein, Schlesier-Michel, Otto, White, Andreas, Sierau, Bergmann, Perren and von Klitzing2019), and moderate increasing (i.e., moderate levels that increase over time; Davis et al., Reference Davis, Votruba-Drzal and Silk2015). Identifying these distinct trajectories is important, as they may reflect different underlying risk processes and have meaningful implications for youth development and later mental health outcomes. Indeed, childhood trajectories characterized by elevated stable or increasing patterns of internalizing problems have been associated with higher depressive symptoms later in life (Sterba et al., Reference Sterba, Prinstein and Cox2007).
Despite the growing use of person-centered approaches to assess internalizing problems across childhood, consistent trajectories have not been fully observed across studies. All aforementioned studies identified a low trajectory – whether stable or slightly fluctuating over time (Davis et al., Reference Davis, Votruba-Drzal and Silk2015; Klein et al., Reference Klein, Schlesier-Michel, Otto, White, Andreas, Sierau, Bergmann, Perren and von Klitzing2019; Sterba et al., Reference Sterba, Prinstein and Cox2007). In contrast, only two studies observed a moderate (Davis et al., Reference Davis, Votruba-Drzal and Silk2015; Klein et al., Reference Klein, Schlesier-Michel, Otto, White, Andreas, Sierau, Bergmann, Perren and von Klitzing2019) and a high (Klein et al., Reference Klein, Schlesier-Michel, Otto, White, Andreas, Sierau, Bergmann, Perren and von Klitzing2019; Sterba et al., Reference Sterba, Prinstein and Cox2007) stable trajectory. Other trajectories, particularly unstable patterns, were not consistently replicated, highlighting limited consistency across studies. These discrepancies may reflect differences in sample characteristics (e.g., community versus high-risk), measures used (e.g., different scales, T-scores versus raw scores), or developmental periods examined. It is also worth noting that these prior studies included predominantly White samples or did not consider race/ethnicity, which limits the generalizability of the observed trajectories to more diverse populations. Thus, further research is needed to replicate these trajectories of internalizing problems, particularly in diverse and high-risk samples.
ACEs and the development of internalizing problems
Exposure to ACEs – including emotional, physical, and sexual abuse; emotional and physical neglect; domestic violence; household substance use; parental separation or divorce; household mental illness; and incarceration of a household member – is common among youth and has been linked to increased internalizing problems (Evans et al., Reference Evans, Li and Whipple2013; Felitti et al., Reference Felitti, Anda, Nordenberg, Williamson, Spitz, Edwards, Koss and Marks1998). Existing research has examined the impact of ACEs on internalizing problems across childhood; however, most studies combine ACEs exposures across time into a single variable (Bevilacqua et al., Reference Bevilacqua, Kelly, Heilmann, Priest and Lacey2021; Gautman et al., Reference Gautam, Rahman and Khanam2024; Leban, Reference Leban2021), limiting insight into how ACEs exposure progresses over time and relates to internalizing problems. Thus, a longitudinal approach could provide insight into the role of ACEs during sensitive developmental periods (Evans et al., Reference Evans, Li and Whipple2013).
Life course theory (Ben-Shlomo & Kuh, Reference Ben-Shlomo and Kuh2002) suggests that ACEs can impact the development of mental health problems through both the accumulation of exposure and based on when in development the adversity is experienced. The accumulation of risk model posits that adversity is cumulative and thus utilizes a total sum score. Evidence supports the accumulation of risk model and shows a dose–response effect, with children experiencing more ACEs exhibiting greater increases in internalizing problems over time (Bevilacqua et al., Reference Bevilacqua, Kelly, Heilmann, Priest and Lacey2021; Gautman et al., 2024; Leban, Reference Leban2021; Schroeder et al., Reference Schroeder, Slopen and Mittal2020). However, this model overlooks the timing of exposure, which is vital to understanding when, during development, exposure to adversity might pose the greatest risk. Most research – including longitudinal research – has focused on the accumulation of risk models to examine the association between ACEs and internalizing problems. For instance, Bevilacqua et al. (Reference Bevilacqua, Kelly, Heilmann, Priest and Lacey2021) and Leban (Reference Leban2021) both created a cumulative ACEs index that combined exposure across multiple time points, despite these studies using longitudinal data to examine changes in internalizing problems across childhood (Bevilacqua et al., Reference Bevilacqua, Kelly, Heilmann, Priest and Lacey2021) and adolescence (Leban, Reference Leban2021). This highlights a crucial research gap regarding the timing of adversity exposure in child development. Understanding the timing of exposure is especially important because it can help identify sensitive periods in development that influence mental health outcomes among youth and reveal prime times to deliver interventions (Ben-Shlomo & Kuh, Reference Ben-Shlomo and Kuh2002).
Life course theory also posits a sensitive period model, which states that experiencing adversity during critical periods in development can have detrimental effects (Ben-Shlomo & Kuh, Reference Ben-Shlomo and Kuh2002). No studies have used a sensitive period model to assess the impact of all ACEs on internalizing problems; however, research examining child physical and sexual abuse shows that early exposure (i.e., before age 5) is associated with increased internalizing problems later in life when compared to unexposed children or those exposed later in childhood (Dunn et al., Reference Dunn, Nishimi, Neumann, Renaud, Cecil, Susser and Tiemeier2020; Keiley et al., Reference Keiley, Howe, Dodge, Bates and Petti2001). Furthermore, children exposed very early in childhood (i.e., ages 0–3) showed delayed effects that emerged at age 6 (Dunn et al., Reference Dunn, Nishimi, Neumann, Renaud, Cecil, Susser and Tiemeier2020). Thus, taking a developmental approach to examine the interplay between ACEs and internalizing problems may reveal sensitive periods that may make children more vulnerable to detrimental mental health outcomes. It is also possible that both timing and accumulation of ACEs are crucial to understanding the long-term effects of experiencing ACEs.
To date, one study has assessed the longitudinal trajectories of cumulative ACEs and focused on self-rated health outcomes at age 18 (i.e., health worry, medical care, and overall health rating; Thompson et al., Reference Thompson, Flaherty, English, Litrownik, Dubowitz, Kotch and Runyan2015). This study identified three ACEs trajectories among at risk-youth: (a) a chronic ACEs group (i.e., two ACEs at each period; 69% of sample), (b) an early ACEs Only group (i.e., high ACEs before age 6 and very few after; 7% of the sample), and (c) a limited ACEs group (i.e., few or no ACEs over time; 24% of the sample). Unlike prior studies linking early adversity to worse outcomes (Dunn et al., Reference Dunn, Nishimi, Neumann, Renaud, Cecil, Susser and Tiemeier2020; Keiley et al., Reference Keiley, Howe, Dodge, Bates and Petti2001), Thompson et al. (Reference Thompson, Flaherty, English, Litrownik, Dubowitz, Kotch and Runyan2015) did not find that early ACEs exposure predicted poorer health at age 18. However, the prior studies (Dunn et al., Reference Dunn, Nishimi, Neumann, Renaud, Cecil, Susser and Tiemeier2020; Keiley et al., Reference Keiley, Howe, Dodge, Bates and Petti2001) focused on internalizing problems, while Thompson et al. (Reference Thompson, Flaherty, English, Litrownik, Dubowitz, Kotch and Runyan2015) focused on health outcomes in early adulthood. Furthermore, while this study controlled for health problems between ages 6 and 16, it did not analyze the trajectories of these health outcomes over time, which may obscure potential sensitive periods in development. Earlier exposure to ACEs might lead to health problems earlier in childhood that do not continue into early adulthood, especially if adversity has subsided. Thus, it is vital to understand the transactional development of ACEs and health problems – especially mental health problems such as internalizing problems – given that no research has examined the co-development of ACEs and internalizing problems trajectories, despite the implications of this research for identifying potential sensitive periods in development.
Disparities in ACEs and internalizing problems by race/ethnicity, sex, and income
The relationship between ACES and internalizing problems trajectories needs to include race/ethnicity, sex, and income as covariates, given documented disparities. Exposure to ACEs has been found to differ based on race/ethnicity, sex, and income, with findings suggesting that Youth of Color (e.g., Black and Latinx), girls, and children of lower-income families experience more ACEs (Anderson & Mayes, Reference Anderson and Mayes2010; Gutman & Codiroli McMaster, Reference Gutman and Codiroli McMaster2020; Lansford et al., Reference Lansford, Malone, Tapanya, Tirado, Zelli, Alampay, Al-Hassan, Bacchini, Bornstein, Chang, Deater-Deckard, Giunta, Dodge, Oburu, Pastorelli, Skinner, Sorbring and Steinberg2019; Mersky et al., Reference Mersky, Choi, Plummer Lee and Janczewski2021), which might increase their risk for developing mental health problems. Youth of Color also have elevated prevalence rates of internalizing disorders (Anderson & Mayes, Reference Anderson and Mayes2010), and sex influences the initial levels and changes of internalizing problems over time (Gutman & Codiroli McMaster, Reference Gutman and Codiroli McMaster2020; Sterba et al., Reference Sterba, Prinstein and Cox2007). Additionally, higher income relates to significant decreases in youth’s internalizing problems over time (Lansford et al., Reference Lansford, Malone, Tapanya, Tirado, Zelli, Alampay, Al-Hassan, Bacchini, Bornstein, Chang, Deater-Deckard, Giunta, Dodge, Oburu, Pastorelli, Skinner, Sorbring and Steinberg2019). However, few studies have examined how longitudinal trajectories of ACEs, internalizing problems, or their co-development vary by race/ethnicity, sex, or income. Examining sociodemographic differences could reveal disparities over time in ACEs and internalizing problems, thus providing information that could support targeted prevention and intervention efforts.
The current study
The current study addressed two research questions. The first aim was to examine the individual trajectories and co-development of cumulative ACEs and internalizing problems to better understand the interplay between ACEs and internalizing problems across ages 3, 5, and 9. We hypothesized that children who experienced chronic and early ACEs in childhood would have elevated internalizing symptoms. The second aim was to examine how ethnicity/race, sex, and income related to the individual and joint trajectories of ACES and internalizing problems. We hypothesized that Youth of Color (i.e., Black, Hispanic, Other), girls, and youth from lower-income families would have higher ACEs and greater internalizing problems over time.
Method
Participants and procedures
Data were taken from the Future of Families & Child Wellbeing Study (FFCWS; formerly known as the Fragile Families and Child Wellbeing Study), a longitudinal study that followed 4,898 children and their families across 20 cities within the U.S. between 1998 and 2000 using a stratified random sample. The study oversampled unmarried mothers in hospitals during their child’s birth. Black, Hispanic, and low-income families were largely represented in the sample. For this study, data from the primary caregiver, mother, and father surveys, as well as an in-home assessment conducted with the primary caregiver during waves 3, 4, and 5 (i.e., ages 3, 5, and 9) were used. Participating primary caregivers were predominantly biological parents at each wave (96.5%, 97.9%, 96.4%).
The sample for the current study consisted of 4,655 participants. Participants were excluded if they did not participate in any of the waves analyzed (n = 243, 5.0%). Of the 4,655 participants included in the current study, 3,568 (72.8%) participated at each wave, 925 (18.9%) participated at two waves, and 162 (3.3%) only participated during one of the three waves. The most common respondents included both parents (72.5%, 65.7%, 64.3%), followed by mother only (24.4%, 24.9%, 28.6%) and father only (3.1%, 3.4%, 5.8%) at waves 3, 4, and 5, respectively. Children were 44.7% (n = 2,079) Black, 22.5% (n = 1,047) Hispanic, 16.7% (n = 777) Other, and 16.2% (n = 752) White. Youth were 52.2% (n = 2,430) boys and 47.8% (n = 2,225) girls. Yearly income for the primary caregiver was on average US$34,649.61, US$36,453.76, and US$44,980.35 at waves 3, 4, and 5, respectively. The Institutional Review Board at Utah State University approved secondary analysis of the FFCWS data for the current study.
Measures
Adverse childhood experiences
Because the FFCWS dataset does not include a validated ACEs scale, the current study used the original ACEs study (Felitti et al., Reference Felitti, Anda, Nordenberg, Williamson, Spitz, Edwards, Koss and Marks1998) as a guiding framework for conceptualizing and selecting ACEs indicators. Indicators of ACEs for the current study were selected based on their availability and consistent measurement across all three waves and their alignment with the original ACEs constructs developed by Felitti et al. (Reference Felitti, Anda, Nordenberg, Williamson, Spitz, Edwards, Koss and Marks1998): (a) emotional abuse, (b) physical abuse, (c) physical neglect, (d) emotional neglect, (e) parental domestic violence, (f) parental mental health problems, (g) parental substance use, (h) parental incarceration, and (i) parental divorce or separation. The FFCWS did not contain data about child sexual abuse and thus was not included. These constructs have also been used in prior ACEs research with FFCWS data (Hunt et al., Reference Hunt, Slack and Berger2017; Jimenez et al., Reference Jimenez, Wade, Schwartz-Soicher, Lin and Reichman2017; Schroeder et al., Reference Schroeder, Slopen and Mittal2020). ACEs variables were derived from reports provided by mothers, fathers, and primary caregivers at each wave, with the primary caregiver – typically a biological parent – providing most of the information. All ACEs were coded as either present (1) or not present (0) at each time point and were not carried over from prior time points unless the adversity was still present/reported at the following time point. ACEs were summed to create a total ACEs cumulative score (range 0–9) at each wave.
Child maltreatment. The Conflict Tactics Scale: Parent Child Version (CTS-PC; Straus et al., Reference Straus, Hamby, Finkelhor, Moore and Runyan1998) was used to measure physical and emotional abuse, and neglect. Primary caregivers rated five items on the psychological aggression subscale (i.e., emotional abuse), five items on the physical assault subscale (i.e., physical abuse), and five items from the neglect subscale. Items within the neglect subscale were split into physical and emotional neglect based on prior work with this dataset (Hunt et al., Reference Hunt, Slack and Berger2017). Four items on the neglect subscale (i.e., leaving child home alone, food insecurity, medical insecurity, lack of parenting associated with substance use) measured physical neglect. The remaining item measured emotional neglect (i.e., lack of affection). Primary caregivers rated how many times in the past year they had engaged in these behaviors on an 8-point scale: this has never happened (0), once (1), twice (2), 3–5 times (3), 6–10 times (4), 11–20 times (5), more than 20 times (6), or not in the past year but it happened before (7). A dichotomized score was created for each type of maltreatment (i.e., physical/emotional abuse, physical/emotional neglect) based on responses to the questions within each subscale. Exposure to the specific type of child maltreatment at each wave was considered to be present (1) if any item was endorsed within the subscale as happening once or more (scale values 1–6) and as not present (0) if all the items were endorsed as never happening or not happening in the past year (values of 0 or 7) within the subscales.
Parental domestic violence. Parental domestic violence information was collected through a structured qualitative interview. Mothers and fathers were asked to answer questions regarding possible physical (two items; e.g., slapped/kicked, hit with fist or object), psychological (three items; e.g., kept from seeing/talking to others, prevented from going to work/school, withheld/took money), and sexual (one item; unwanted sexual contact) abuse perpetuated by the other parent during the past month. Responses were rated on a 3-point scale: often (1), sometimes (2), never (3). Each question was converted into a dichotomous variable to capture the presence of domestic violence: not present (0) and present (1). Questions rated as often or sometimes were given a score of 1 (present), and never was coded as 0 (not present). A single domestic violence exposure variable was created for each time point, where domestic violence was considered not present (0) if all questions were rated as never, and as present (1) if any question was rated as often or sometimes.
Parental depression. The Composite International Diagnostic Interview – Short Form (CIDI-SF; Kessler et al., Reference Kessler, Andrews, Mroczek, Ustun and Wittchen1998) was used to assess 15 items measuring symptoms of a major depressive episode during the two weeks prior to data collection using criteria for the Diagnostic and Statistical Manual of Mental Disorders (4th ed.; DSM-IV; American Psychiatric Association, 1994). We used the liberal caseness variable created by the authors of the FFCWS data set (Kessler et al., Reference Kessler, Andrews, Mroczek, Ustun and Wittchen1998). Liberal caseness criteria was met if all symptoms of anhedonia (three items) or dysphoric mood (three items) were endorsed as happening at least “half of the day.” A dichotomous variable was created for each time point, with criteria met for liberal caseness for either parent being considered as present (1) and the absence of caseness for both parents as not present (0).
Parental substance use. Mothers and fathers were asked questions to assess parental substance use. Questions asked about problematic alcohol use (one item; e.g., has drinking interfered with work/school/home), using different types of drugs without prescription or for longer than prescribed (nine items; i.e., sedatives, tranquilizers, stimulants, analgesics or prescription pain killers, inhalants, marijuana or hashish, cocaine, LSD or other hallucinogens, heroin), and if the other biological parent had functioning difficulties because of using alcohol/drugs in the past year. Parents responded yes (1) or no (2) to all of these questions. Endorsement to any of these questions was considered present (1) and absence of endorsement to all questions was considered not present (0) at each wave.
Parental incarceration. Parental incarceration information was obtained from both mothers and fathers. Each parent reported whether the other biological parent (i.e., mother reported on father’s incarceration and vice versa) was currently in prison/jail. Endorsement of any item considered as present (1) and absence of endorsement to all questions was considered not present (0) at each time point.
Parental divorce/separation. Mothers and fathers were asked to report on their current relationship status with the child’s other biological parent at each wave. If both parents answered (a) separated or divorced, (b) just friends, or (c) not in any kind of relationship, then parental divorce/separation was coded as present (1). Parental divorce/separation was coded as not present (0) if both endorsed (a) married, (b) romantically involved, or (c) cohabitating/living together. In cases of discrepant reports between mothers and fathers (e.g., mother reported being separated or divorced and father reported being romantically involved), parental divorce/separation was coded as present (1) if either parent endorsed a divorce/separation-related response. Discrepant reports occurred 11.3%, 9.0%, and 9.9% of the time at Waves 3, 4, and 5, respectively. This variable was coded separately at each time point; thus, if parents reported being separated or divorced at multiple waves (e.g., Waves 3 and 4), parental divorce/separation was coded as present at each wave because the divorce/separation was ongoing.
Child internalizing problems
The Child Behavior Checklist (CBCL) was used to measure internalizing problems at each age: the CBCL/2-5 at age 3 (25 items; Achenbach, Reference Achenbach1992), the CBCL/4-18 at age 5 (20 items; Achenbach, Reference Achenbach1991), and the CBCL/6-18 at age 9 (21 items; Achenbach, Reference Achenbach1997). The anxious/depressed and withdrawn subscales were used to measure internalizing problems using mean scores for consistency across all ages, given that the subscales and number of items on the measure differed at each wave. Mothers and fathers rated items as never true (0), sometimes or somewhat true (1), or very true or often true (2). Internal reliability in the current study was acceptable (α = 0.78, 0.69, and 0.81 for ages 3, 5, and 9, respectively). Raw mean scores as opposed to standardized T-scores were used for the internalizing behavior problems scale to maintain greater variability (Achenbach, Reference Achenbach1997).
Sociodemographics
Race/ethnicity. Child race/ethnicity was constructed based on the self-identifying race/ethnicity of the biological mother and father, as the child’s race/ethnicity was not collected until wave 6, when youth were 15 years old. We did not use the child’s self-report due to attrition; 70% of youth completed wave 6. Biological parents were asked to report on their own race/ethnicity at baseline (i.e., wave 1; birth of child) and were coded as Black, Hispanic, White, Mixed, and Other. In this study, we coded child’s race/ethnicity as Black, Hispanic, White, and Other. Other captured youth with mixed racial/ethnic identities and those whose race/ethnicity did not fit into Black, Hispanic, or White. If both parents reported the same race/ethnicity (e.g., Black), then the child’s race/ethnicity was coded the same as the parents’ (e.g., Black). If a mother and father had a different race/ethnicity, then child’s race/ethnicity was coded as Other. We compared our coding to the youth’s self-reported race/ethnicity at wave 6 and found high consistency (84.6% agreement). Most inconsistencies were due to youth only endorsing one of their parents’ race/ethnicity rather than identifying as Mixed (i.e., Other).
Sex. Child’s binary sex was assessed at baseline (i.e., wave 1; birth of child) using parent’s report. Sex was measured and coded as a dichotomous variable: boy (1) or girl (2).
Primary caregiver’s income. In this study, we used the FFCWS constructed income variables for each biological parent at each wave based on their reported income. Mothers and fathers reported their income at each wave as either an exact amount or a range. The FFCWS constructed income variables included the income of those who provided an exact income amount, and imputed values for respondents who reported a range or did not provide income information. These variables were reported and constructed separately for mothers and fathers at each wave. Given that mothers’ and fathers’ incomes were collected separately, that the study oversampled unmarried families, and that rates of divorce and separation were high, the current study focused on the primary caregiver’s income. Focusing on the primary caregiver’s income provides a more consistent indicator of the income that would most directly be available to the child, since it is unknown whether both parents contribute to household income. Primary caregivers were identified at each wave using variables indicating who the child’s primary caregiver was and with whom the child currently lived. We assigned the mother’s or father’s constructed income value at each wave based on the primary caregiver of the child. If fathers were identified as the primary caregivers, then their income was assigned. On the other hand, the mother’s income was selected if the mother was identified as the primary caregiver. For children not living with their mothers or fathers, imputation was employed to estimate their income, considering the mother’s and father’s income as covariates in the imputation.
Method
Analysis plan
We conducted unconditional univariate linear latent class growth analyses (LCGAs; Nagin, Reference Nagin1999) to assess individual trajectories of ACEs and internalizing problems, and unconditional linear parallel process LCGA – which allowed us to account for both ACEs and internalizing problems trajectories concurrently – to examine the co-development of ACEs and internalizing problems trajectories. Time was coded as 0, 2, and 6 for Waves 3, 4, and 5, respectively, in the model to account for the unequal spacing between time points. We estimated models for two to seven classes. We determined model fit and selected the optimal number of trajectory classes using fit statistics – Bayesian Information Criteria (BIC), Akaike Information Criteria (AIC), and sample-size-adjusted Bayesian Information Criteria (a-BIC), entropy, Vuong-Lo-Mendell-Rubin likelihood ratio test (VLMR), Lo–Mendell–Rubin adjusted likelihood ratio test (LMR-LRT), and Bootstrap Likelihood Ratio Test (BLRT) – and interpretability of the trajectories. Lower AIC, BIC, and a-BIC values, along with higher entropy (values nearing 1.0), indicate better-fitting models (Nagin, Reference Nagin1999). Statistically significant VLMR-LRT, LMR-LRT, and BLRT tests (p < .05) suggest that the model with fewer classes should be rejected as the model with more classes is significantly better.
We tested differences in representation by race/ethnicity and sex on the univariate and parallel process trajectories of ACEs and internalizing problems using Chi-square tests. We used Fisher’s exact tests for race/ethnicity comparisons of the univariate trajectories of internalizing problems and parallel process trajectories due to sparsity within cells. We conducted post-hoc analyses with Bonferroni corrections using standardized adjusted residual scores (i.e., z-scores obtained when conducting the Chi-square/Fisher’s exact tests) to identify exact differences in the contingency tables. We used Kruskal-Wallis, a non-parametric test, to evaluate differences in univariate and parallel process trajectories by primary caregiver’s income at each age, as income was non-normally distributed.
Results
Missing data
Across all waves, 28.05% of data were missing. Significant associations were observed between variables and the overall pattern of missingness, which suggests that the data were not Missing Completely at Random (MCAR; Enders, Reference Enders2022). We imputed individual missing items using Random Forest imputation because it reduces biases associated with mean imputation, accurately estimates longitudinal missing data with high levels of missingness (Enders, Reference Enders2022), and generates a single data set, which decreases challenges in pooling fit statistics and classes.
Descriptive statistics
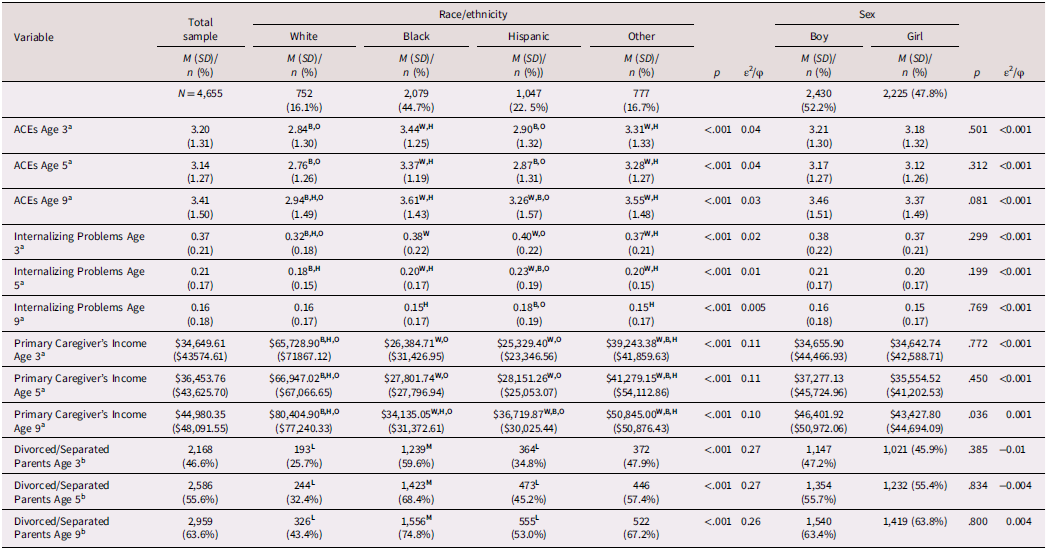
On average, participants experienced three ACEs at each time point (age 3: M = 3.20, SD = 1.31, Range = 0–9; age 5: M = 3.14, SD = 1.27, Range = 0–8; age 9: M = 3.41, SD = 1.50, Range = 0–8). Internalizing problems decrease from age 3 to 9 on average (age 3: M = 0.37, SD = 0.21, Range = 0–1.53; age 5: M = 0.21, SD = 0.17, Range = 0–1.12; age 9: M = 0.16, SD = 0.18, Range = 0–2.00). Significant differences in ACEs and internalizing problems were observed across waves by race/ethnicity. Comprehensive descriptive statistics of study variables are reported in Table 1.
Descriptive statistics by race/ethnicity and sex
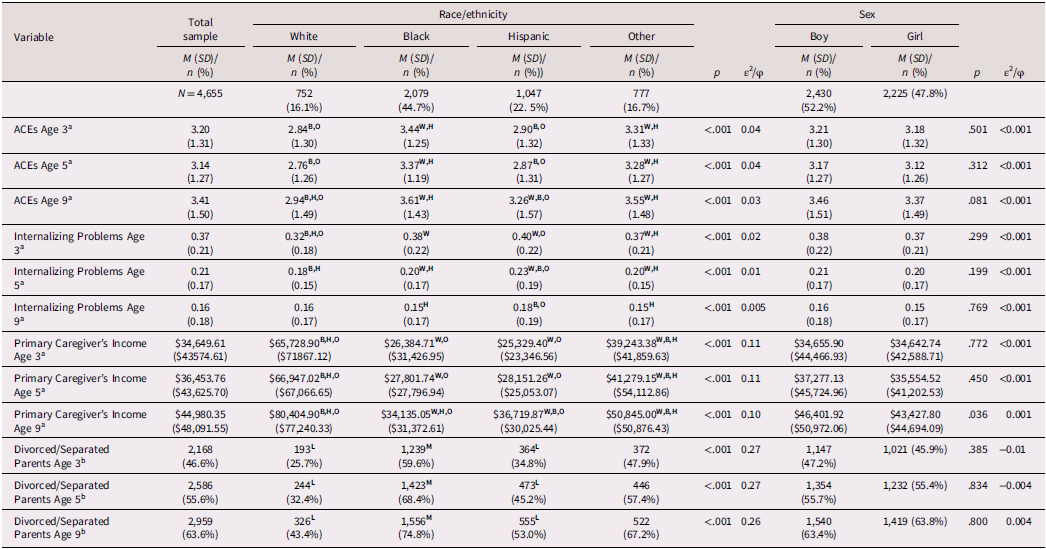
Table 1. Long description
The table presents descriptive statistics of study variables by race/ethnicity and sex. It includes data for 4,655 participants, categorized into White, Black, Hispanic, and Other racial/ethnic groups, and divided by sex into Boy and Girl. The table has 12 rows and 16 columns, with column headers including Variable, Total sample, Race/ethnicity (White, Black, Hispanic, Other), and Sex (Boy, Girl). Each row represents a different variable, such as ACEs at ages 3, 5, and 9, Internalizing Problems at ages 3, 5, and 9, Primary Caregiver’s Income at ages 3, 5, and 9, and Divorced/Separated Parents at ages 3, 5, and 9. The table provides mean (M), standard deviation (SD), and sample size (n) for each category. Notable trends include variations in ACEs and internalizing problems across different racial/ethnic groups and sexes. For example, Black participants generally report higher ACEs and internalizing problems compared to other groups. The table also shows a decrease in internalizing problems from age 3 to age 9 across all groups. The p-values and effect sizes (e^2/φ) indicate significant differences in some variables across the categories.
Note. a Kruskal-Wallis tests.
b Chi-square test of Independence.
Statistically significant differences (p < .05) are indicated between the specified racial/ethnic group and the indicated comparison group (W = White, B = Black, H = Hispanic, or O = Other race/ethnicity).
M = higher-than-expected count and L = lower-than-expected count for the specified race/ethnicity in the corresponding latent class growth analysis (LCGA) class based on adjusted residuals.
Post hoc analyses were adjusted using a Bonferroni correction.
ACEs univariate trajectories classes
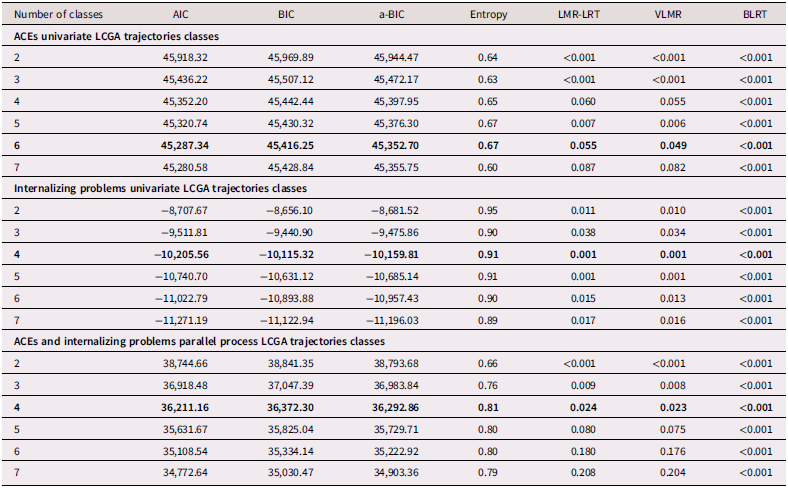
The best-fitting model for the ACEs univariate LCGAs was the six-class model based on having the second lowest AIC, BIC, and a-BIC values and highest entropy. While the LMR-LRT test was not significant, both the VLMR and BLRT tests were, suggesting the six-class model was statistically significantly better than the five-class model. When interpreting the classes, the class added by the six-class model differed from the five-class model and captured a subsample of children who had increasing ACEs over time (i.e., a higher-risk class; see Table 2). The six classes identified in this model included: (a) Class 1: Consistently 1 ACE, (b) Class 2: Consistently 2 ACEs, (c) Class 3: Consistently 3 ACEs, (d) Class 4: Starting at 3 ACEs and increasing to 5 ACEs (e) Class 5: Consistently 4 ACEs, and (f) Class 6: Starting at 6 ACEs and decreasing to 5 ACEs. All classes experienced a consistent number of ACES at each age, with one, two, three, or four ACES, respectively, except Class 6: Starting at 6 ACEs and decreasing to 5 ACEs, who had consistently six ACEs at ages 3 and 5 but was just below six ACEs at age 9 and Class 4: Starting at 3 ACEs and increasing to 5 ACEs, which had three ACEs at age 3 and increased over time to almost 6 ACEs at age 9 (see Figure 1).
ACEs univariate trajectories classes.
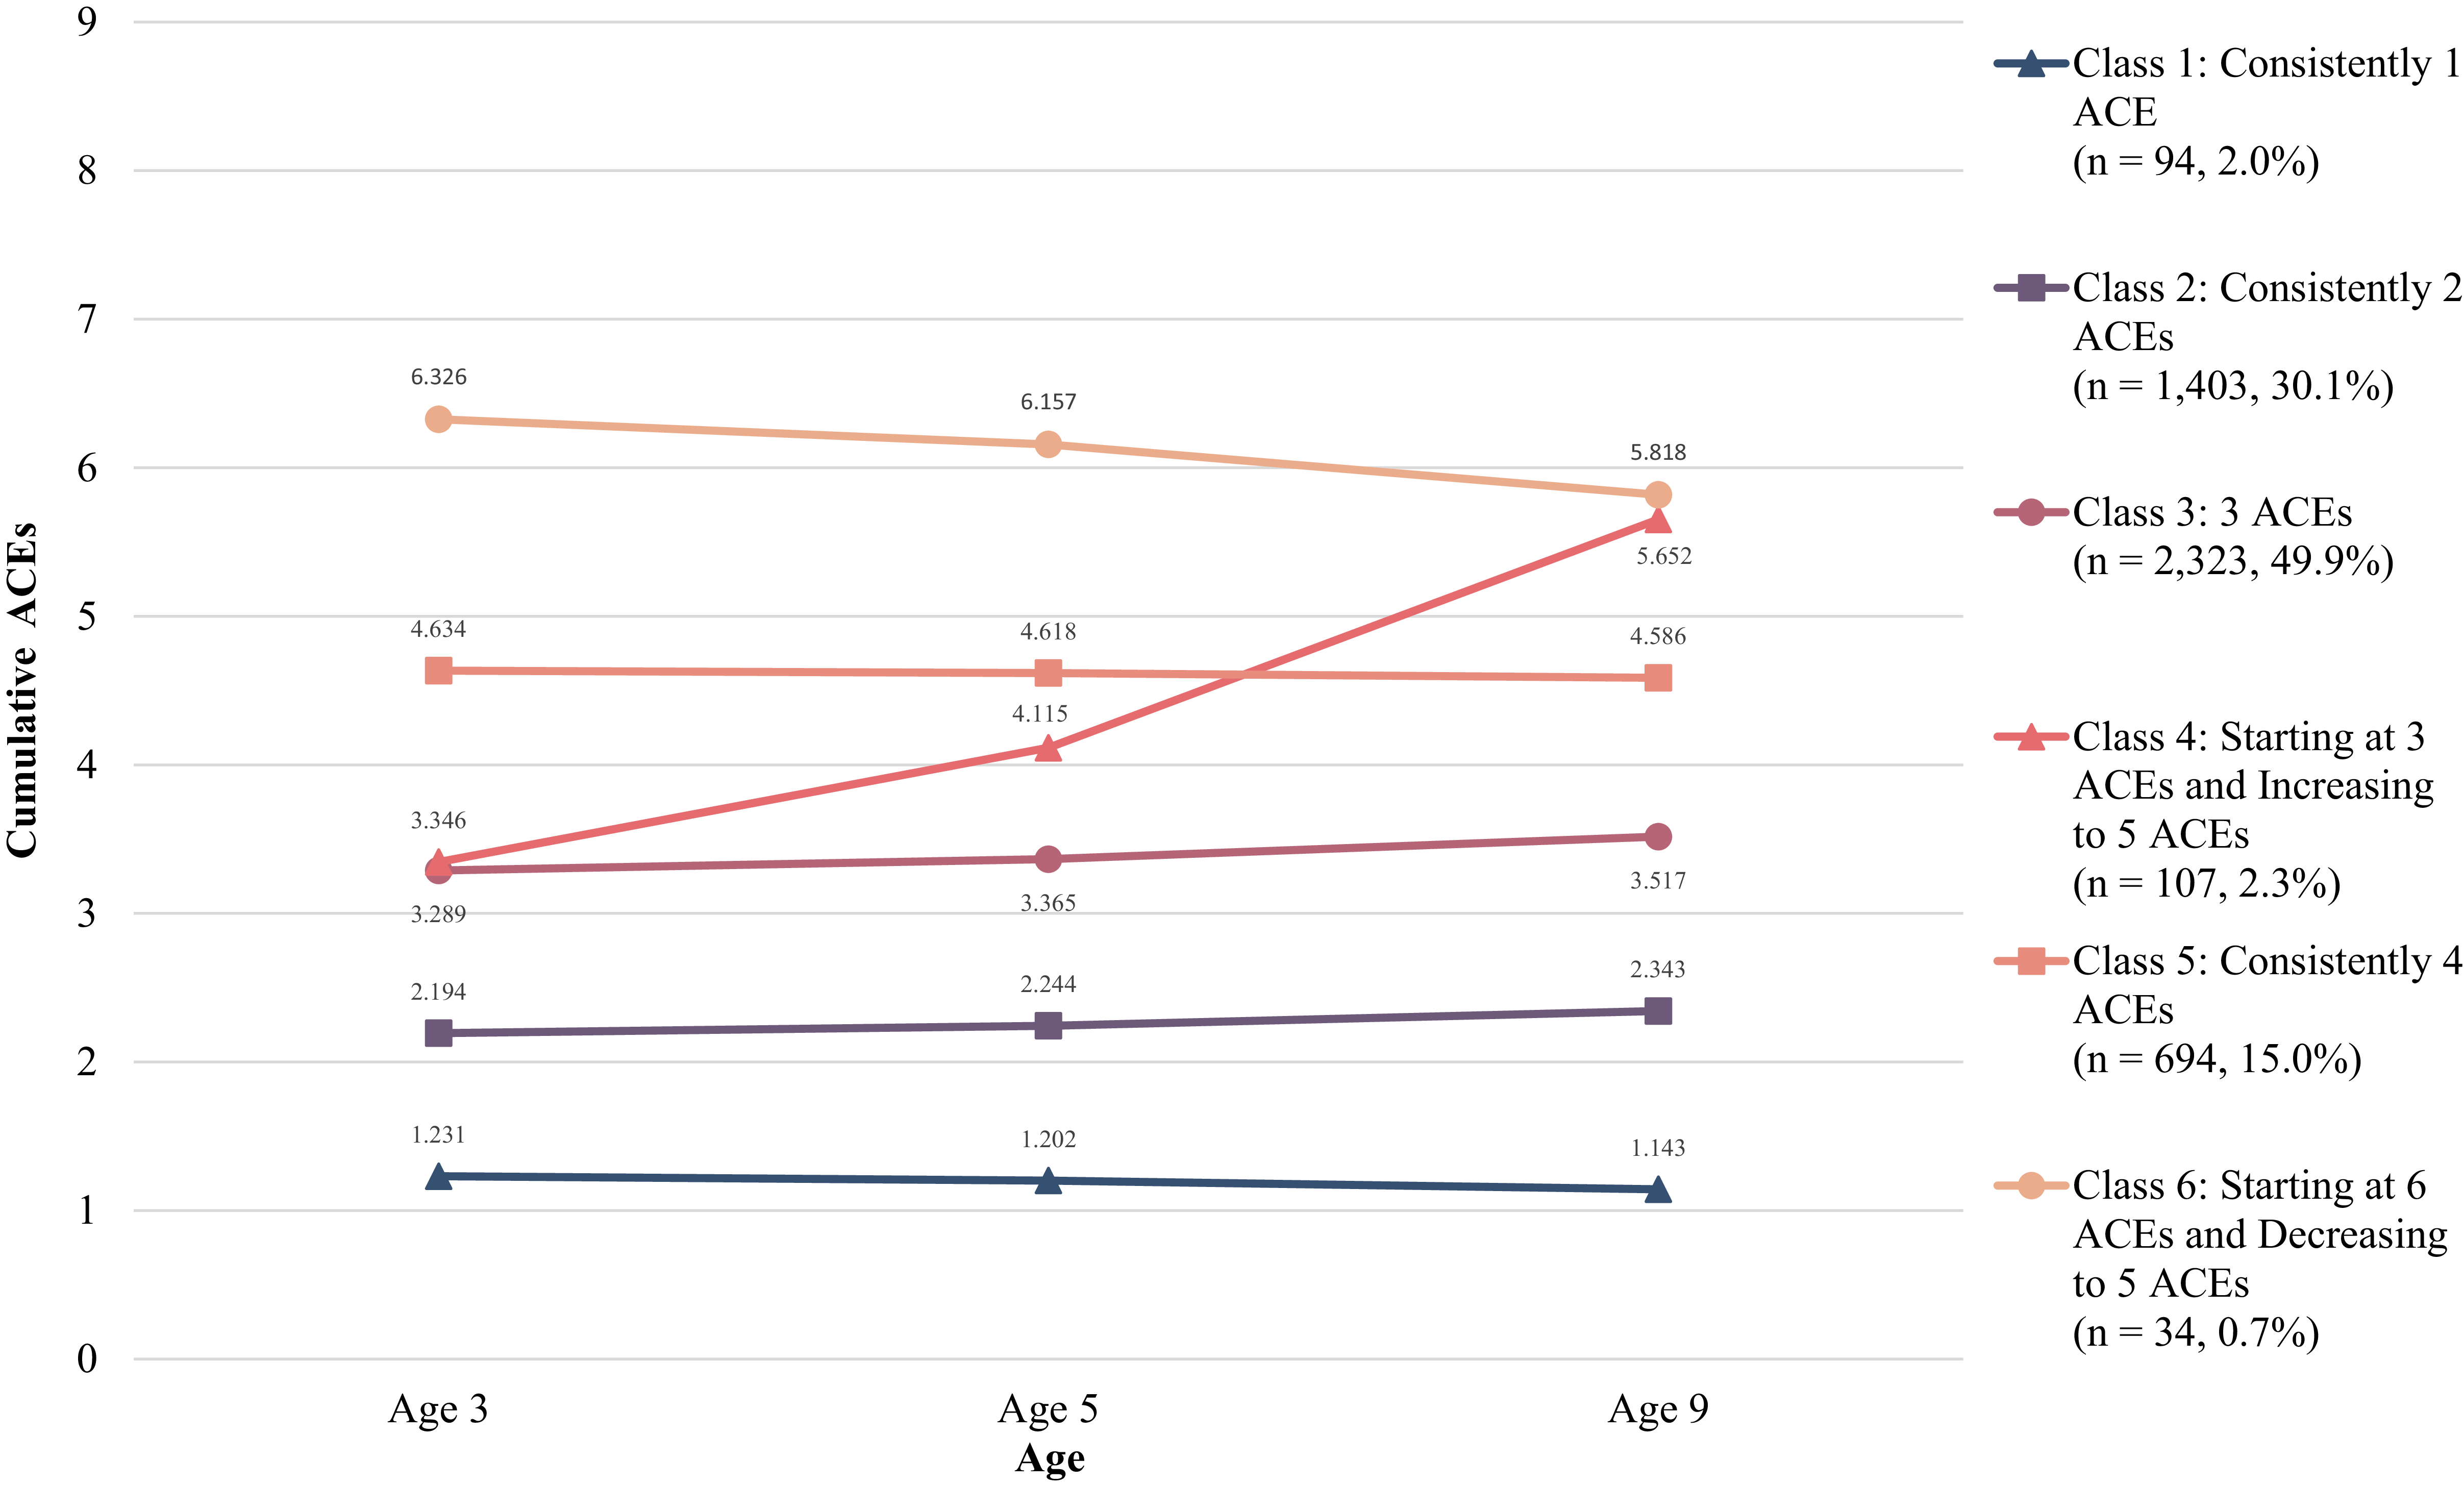
Figure 1. Long description
A line graph depicting the trajectories of cumulative ACEs across different classes from age 3 to age 9. The horizontal axis represents age, with values at age 3, age 5, and age 9. The vertical axis represents cumulative ACEs, ranging from 0 to 9. The graph includes six classes: Class 1, Class 2, Class 3, Class 4, Class 5, and Class 6, each represented by different colored lines and marker shapes. Class 1, represented by a blue line with triangle markers, remains consistently around 1 ACE. Class 2, represented by a purple line with square markers, remains consistently around 2 ACEs. Class 3, represented by a dark pink line with circle markers, remains consistently around 3 ACEs. Class 4, represented by a red line with triangle markers, starts around 3 ACEs and increases steeply to nearly 6 ACEs by age 9. Class 5, represented by a salmon-colored line with square markers, remains consistently around 4 ACEs. Class 6, represented by a light orange line with circle markers, starts above 6 ACEs and gradually decreases to below 6 ACEs by age 9. Notable data points include Class 1 decreasing from 1.231 ACEs at age 3 to 1.143 at age 9, Class 2 increasing from 2.194 to 2.343, Class 3 increasing from 3.289 to 3.517, Class 4 increasing from 3.346 to 5.652, Class 5 decreasing slightly from 4.634 to 4.586, and Class 6 decreasing from 6.326 to 5.818.
Fit statistics for univariate and parallel process latent class growth analyses of ACEs and internalizing problems
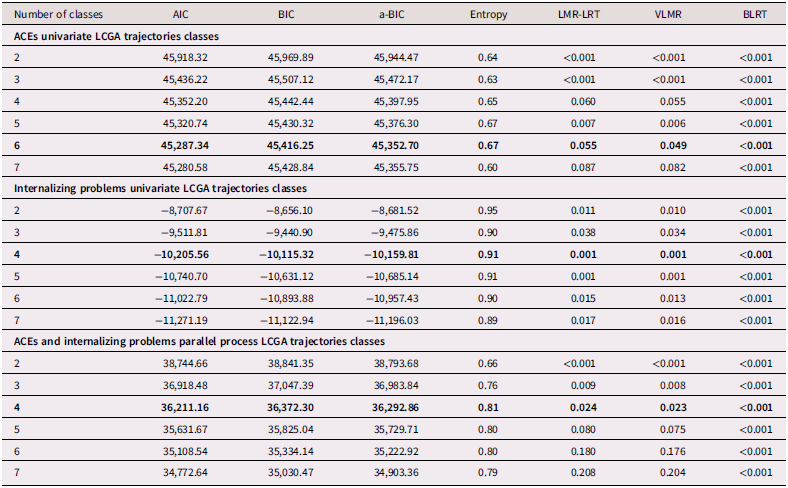
Table 2. Long description
The table presents fit statistics for univariate and parallel process latent class growth analyses of ACEs and internalizing problems. It has 21 rows and 8 columns. The columns are labeled: Number of classes, AIC, BIC, a-BIC, Entropy, LMR-LRT, VLMR, and BLRT. The rows are grouped into three sections: ACEs univariate LCGA trajectories classes, Internalizing problems univariate LCGA trajectories classes, and ACEs and internalizing problems parallel process LCGA trajectories classes. Each section lists values for different numbers of classes ranging from 2 to 7. The values include AIC, BIC, a-BIC, Entropy, LMR-LRT, VLMR, and BLRT statistics. Notable trends include varying values across different numbers of classes and sections, with specific statistical significance indicated by the LMR-LRT, VLMR, and BLRT tests.
Note. Boldface indicates the selected model.
AIC = Akaike Information Criterion.
BIC = Bayesian Information Criterion.
a-BIC = sample-size-adjusted Bayesian Information Criterion.
LMR-LRT = Lo–Mendell–Rubin adjusted likelihood ratio test.
VLMR = Vuong–Lo–Mendell– Rubin Likelihood Ratio Test.
BLRT = Bootstrapped Likelihood Ratio Test.
Internalizing problems univariate trajectories classes
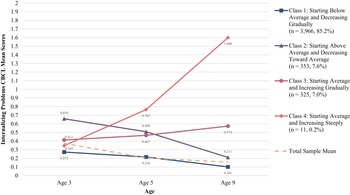
The four-class model was the best-fitting model for the internalizing problems LCGAs, as it had the second highest entropy, and statistically significant LMR-LRT, VLMR, and BLRT test values, suggesting that the four-class model was significantly better than the three-class model. Although models with more classes had relatively lower AIC, BIC, and a-BIC values, and statistically significant likelihood ratio tests, they were not selected due to having lower entropy, significant overlap between classes during interpretation, and increasingly sparse sample sizes within the classes (see Table 2). Internalizing problem levels of the classes were described in reference to the average/mean trajectory for all participants. Class 1: Starting below average and decreasing gradually had the lowest levels of internalizing problems at age 3, which gradually decreased to the lowest internalizing problem levels of all classes by age 9. Class 2: Starting above average and decreasing toward average exhibited the highest levels of internalizing problems at age 3, which decreased to nearly average levels, and the second lowest ending levels of all classes, by age 9. Class 3: Starting average and increasing gradually started with close to average internalizing problems at age 3 that increased gradually to above average by age 9, the second highest starting and ending levels of internalizing problems of all classes. Class 4: Starting average and increasing steeply had near average and the second lowest levels of internalizing problems at age 3 that increased to very high levels, the highest levels of internalizing problems of all classes, by age 9 (see Figure 2).
Internalizing problems univariate trajectories classes. Note. Child Behavior Checklist (CBCL); Total Sample Mean is the mean of the overall sample at each time point, which is provided for interpretability of classes.
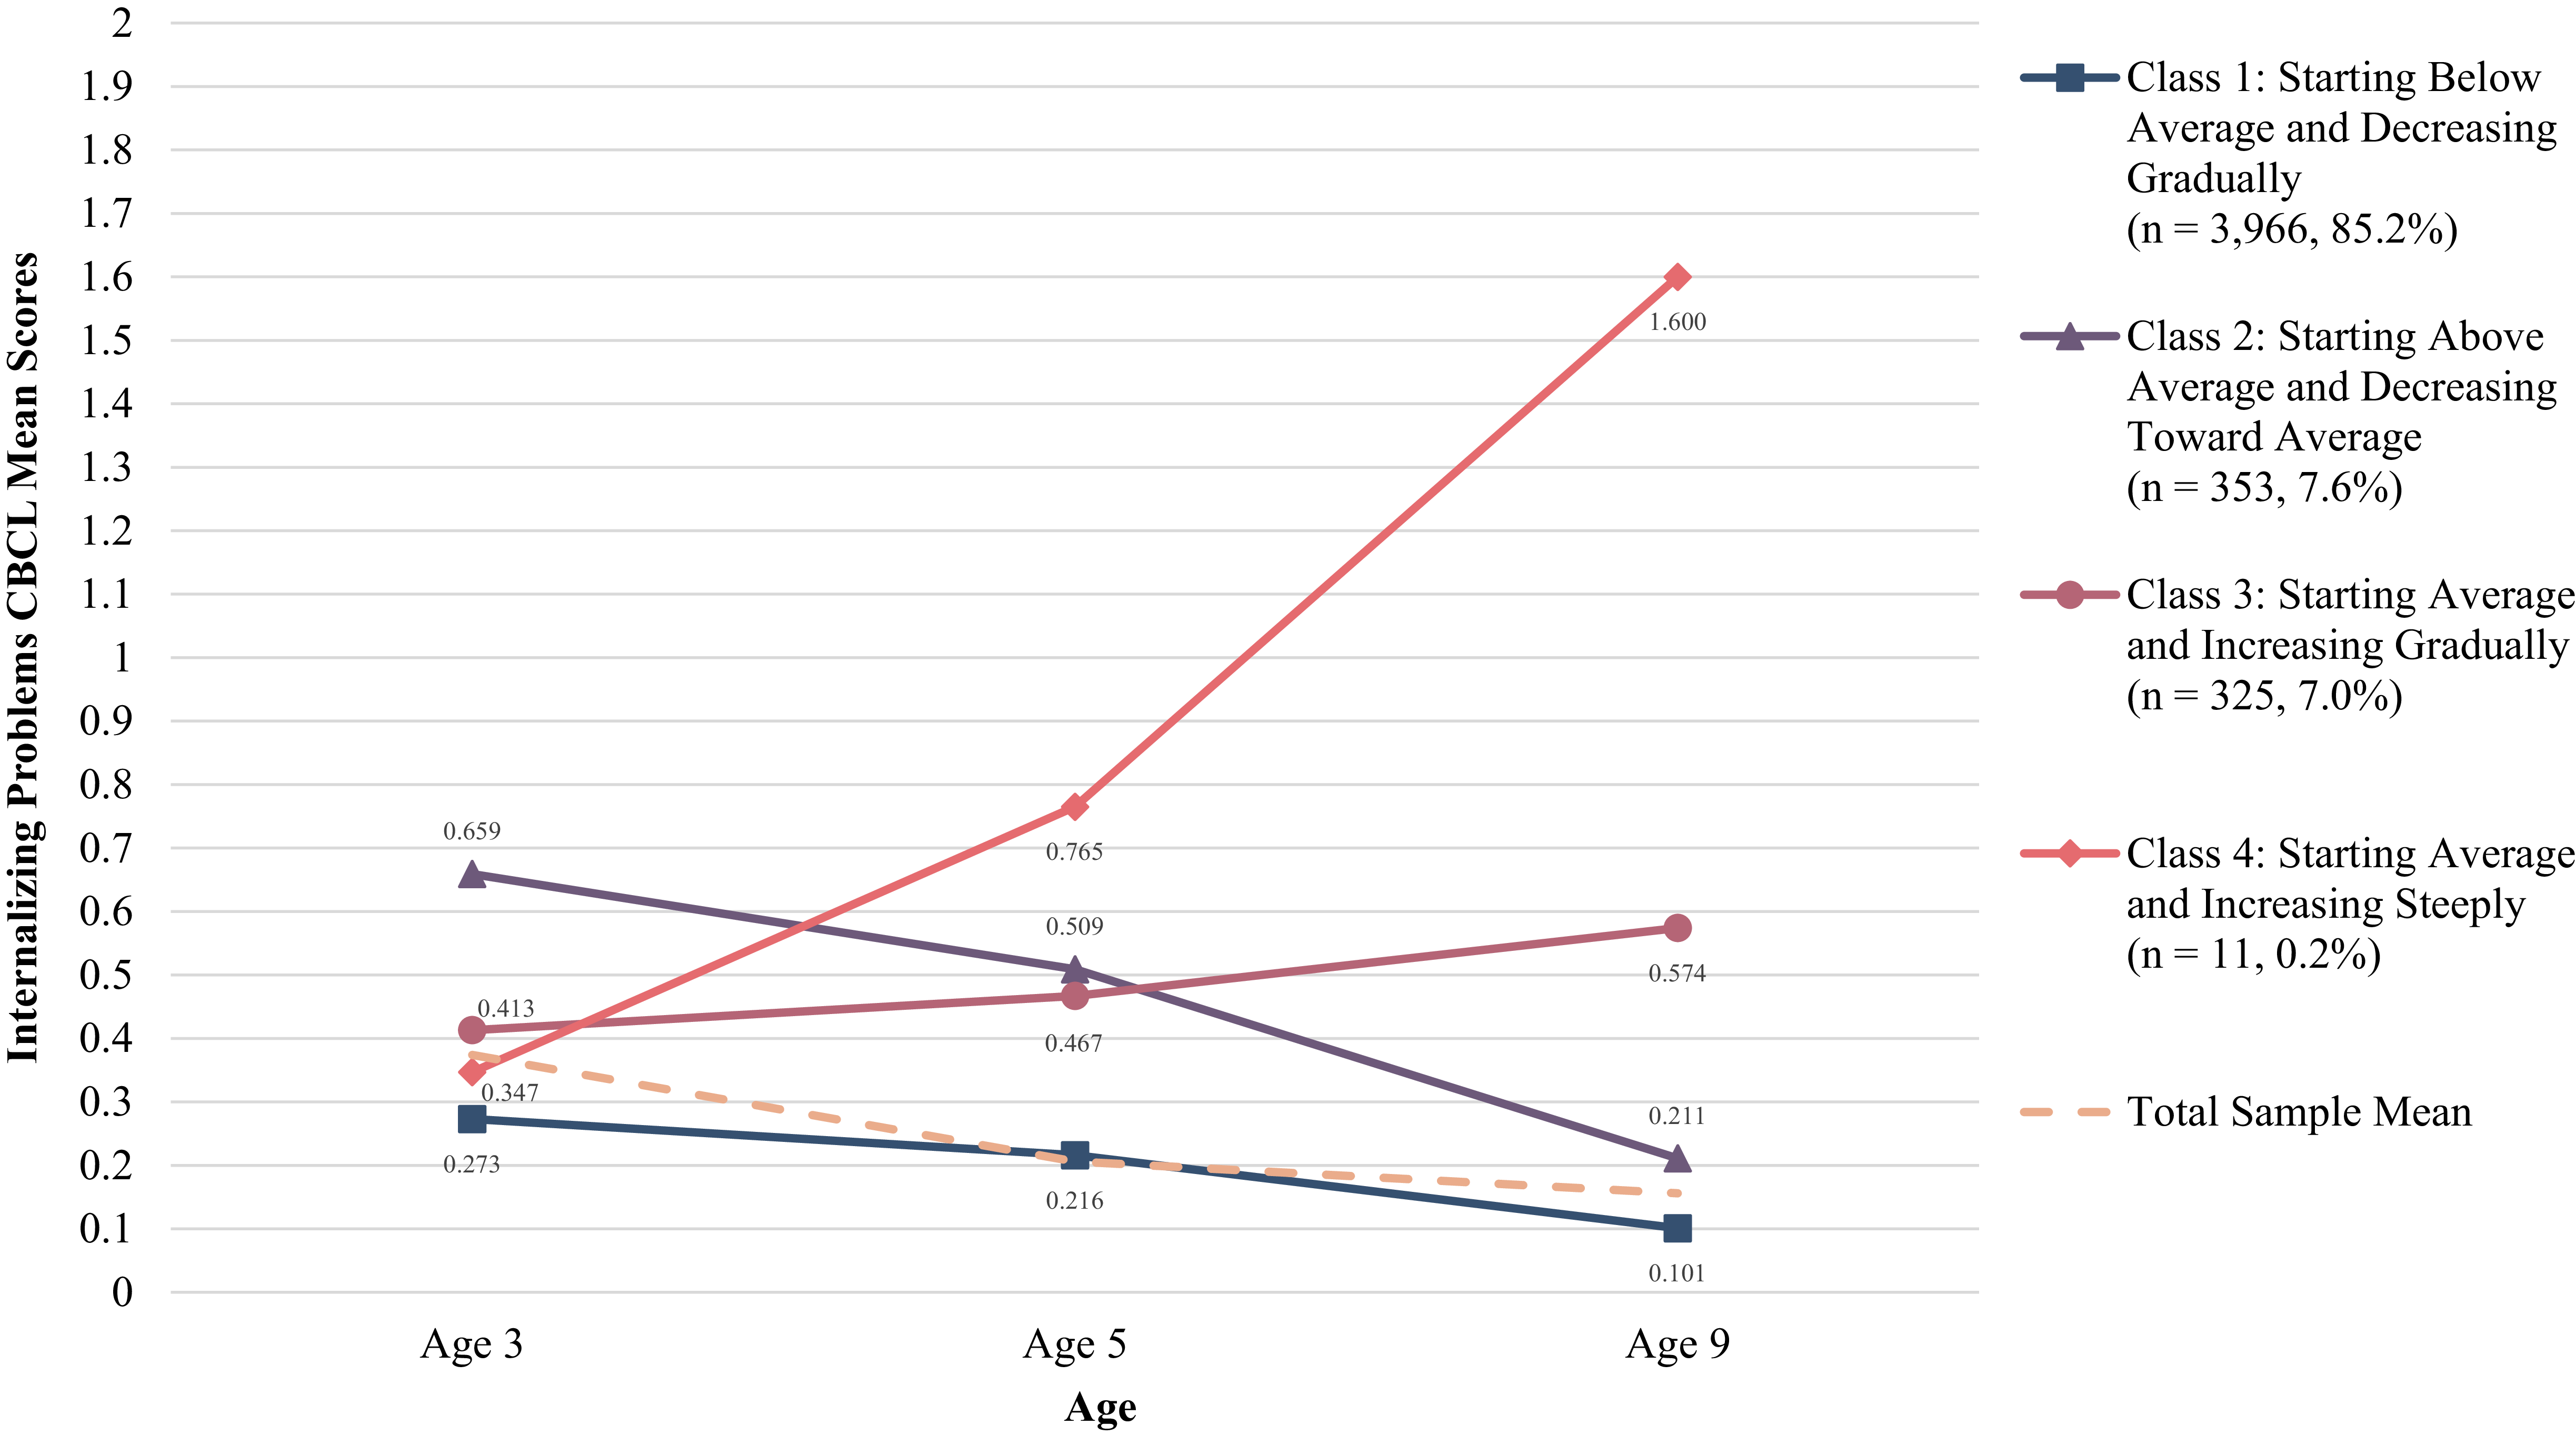
Figure 2. Long description
A line graph depicting the trajectories of internalizing problems mean scores across different classes from age 3 to age 9. The horizontal axis represents age with values at age 3, age 5, and age 9. The vertical axis represents internalizing problems mean scores ranging from 0 to 2. The graph includes four classes: Class 1, Class 2, Class 3, and Class 4, each represented by different colored lines and markers Class 1, represented by blue line by with squaremarkers, starts below average and decreases gradually. Class 2, represented by a purple line with triangle markers, starts above average and decreases toward average. Class 3, represented by a dark pink line with circle markers, starts average and increases gradually. Class 4, represented by pink line with diamond markers, starts average and increases steeply. The total sample mean is represented by an orange dashed line. Notable data points include Class 1 starting at 0.273 at age 3 and decreasing to 0.101 at age 9, Class 2 starting at 0.659 at age 3 and decreasing to 0.211 at age 9, Class 3 starting at 0.413 at age 3 and increasing to 0.574 at age 9, and Class 4 starting at 0.467 at age 3 and increasing to 1.600 at age 9.
ACEs and internalizing problems parallel process trajectories classes
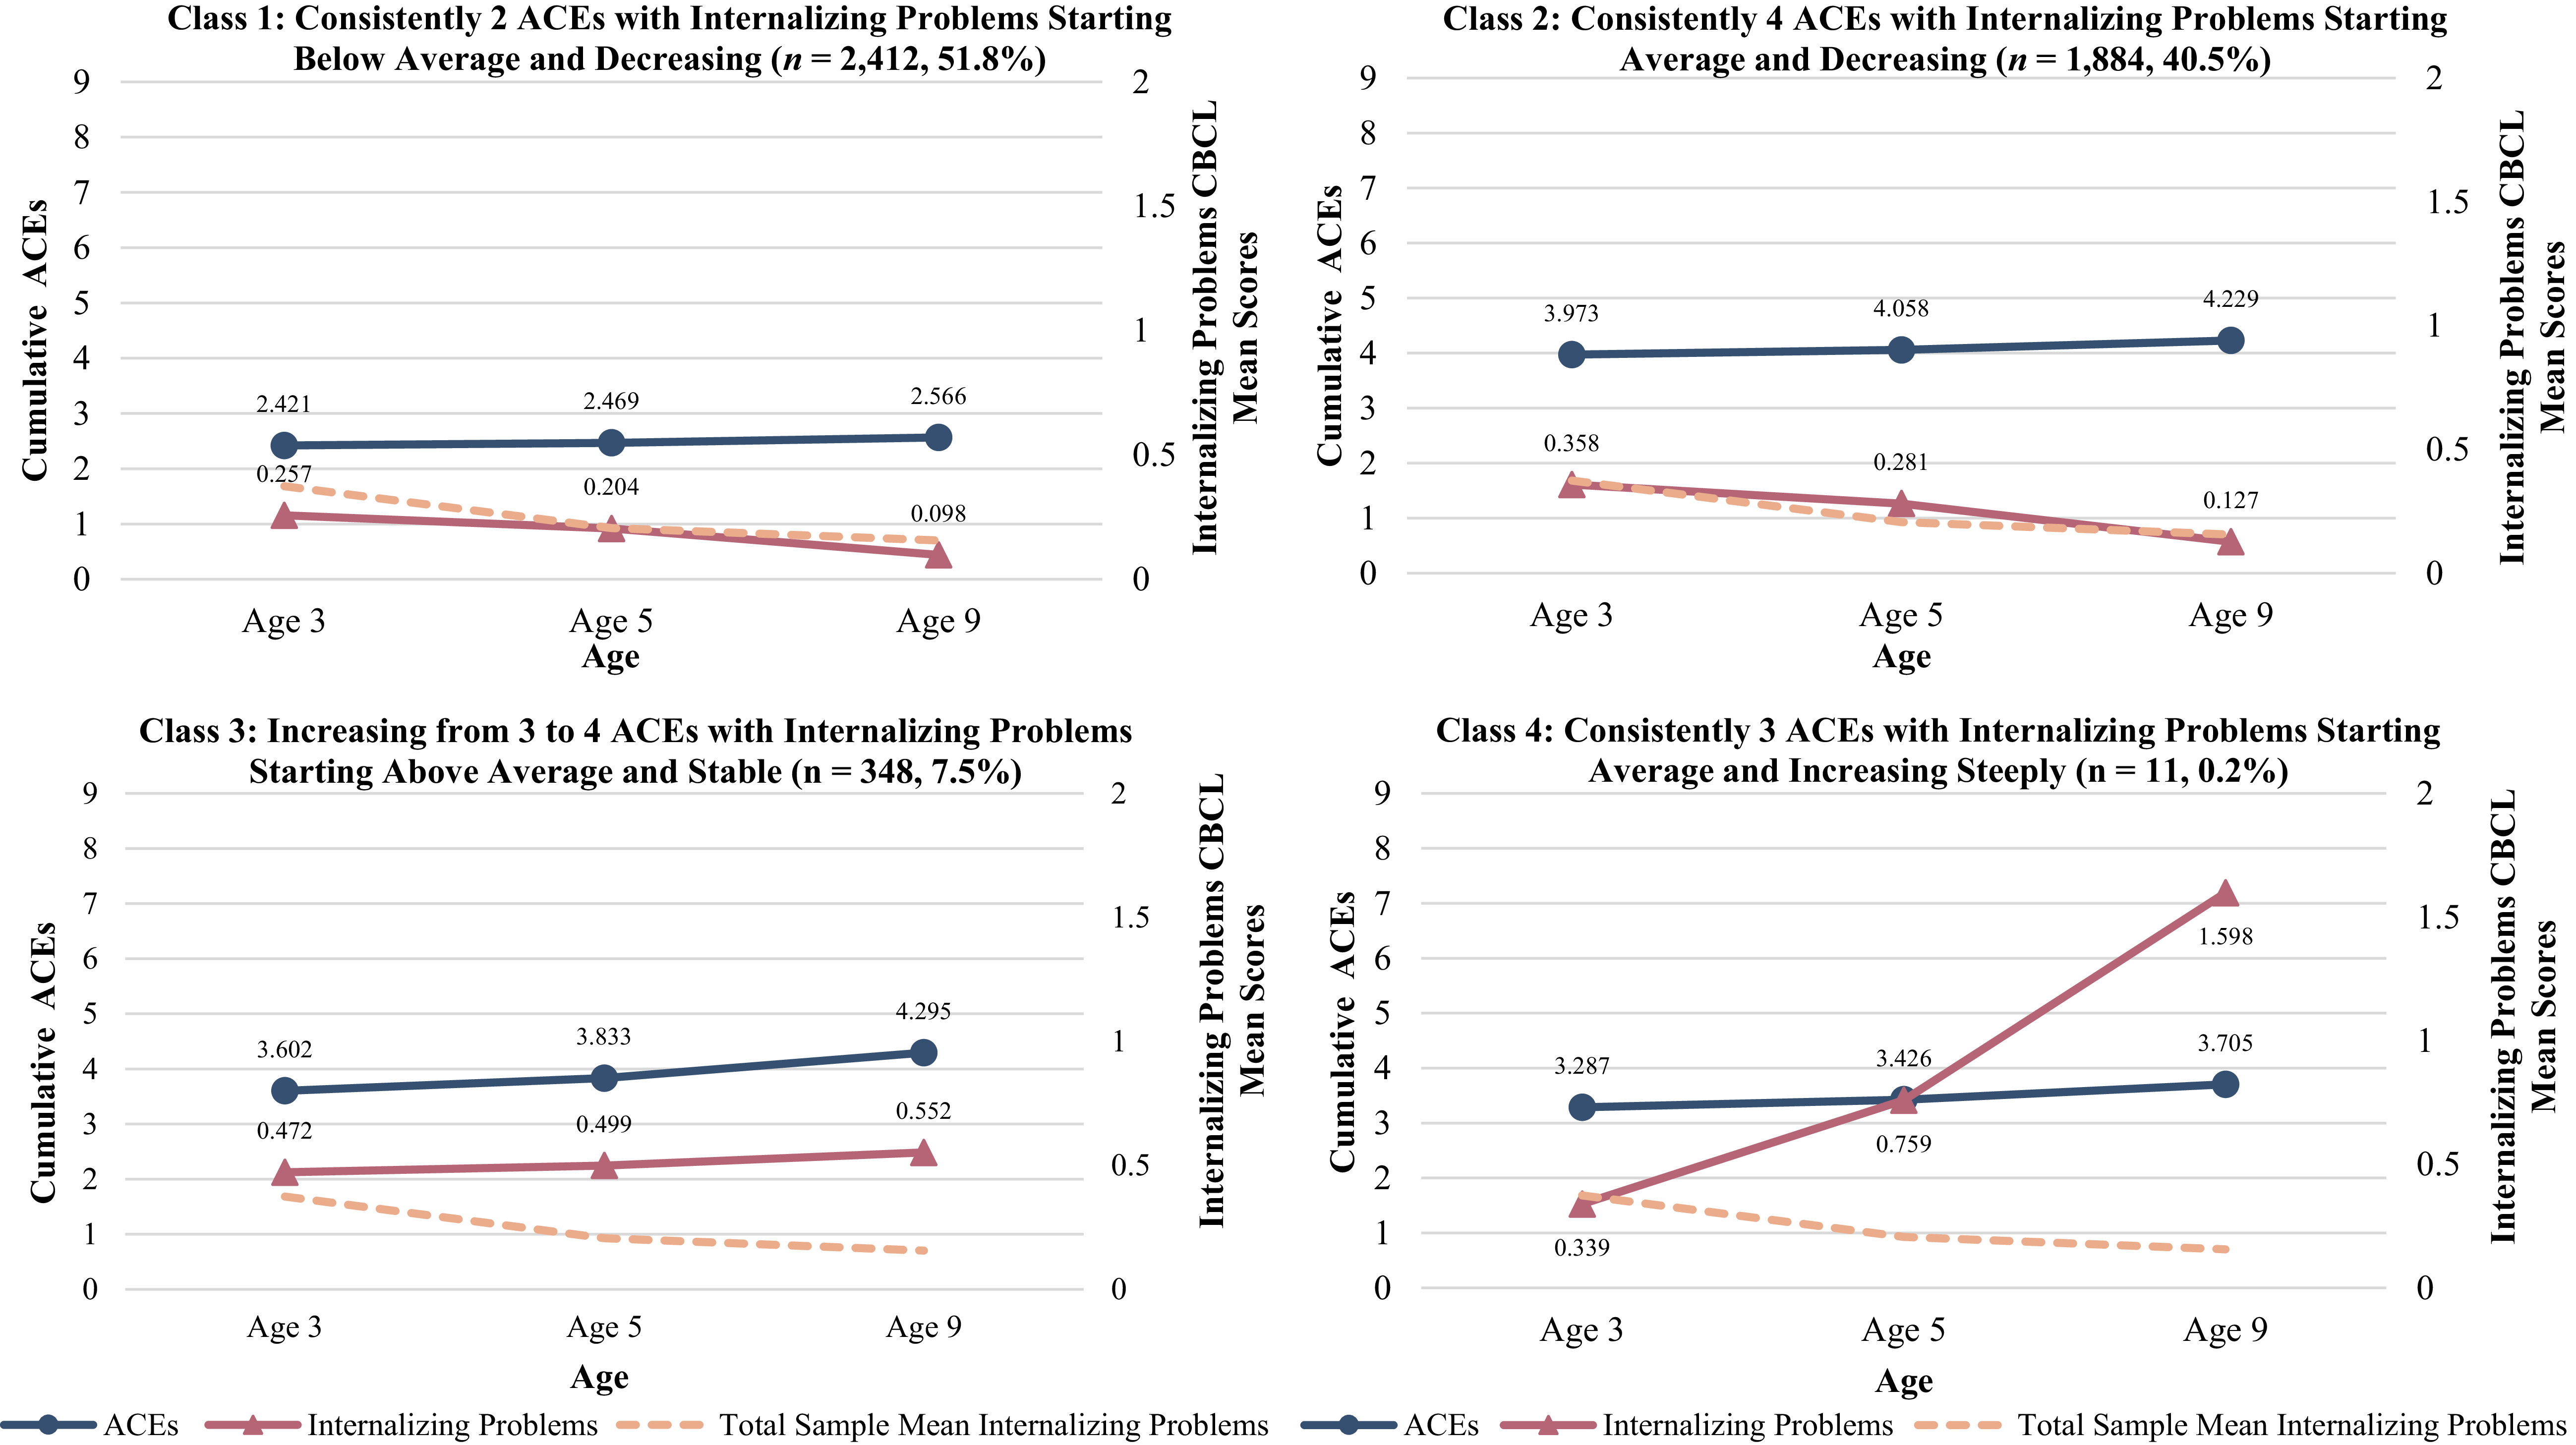
The four-class model was chosen as the best-fitting model for the ACEs and internalizing problems parallel process LCGAs, as this model had the highest entropy, and statistically significant LMR-LRT, VLMR, and BLRT test values. While the models with more classes had lower AIC, BIC, and a-BIC values, these models did not have statistically significant LMR-LRT and VLMR tests, suggesting that they were not significantly better than models with one less class. The four-class model had the highest AIC, BIC, and a-BIC values of the models with significant LMR-LRT and VLMR tests and meaningful class interpretations (see Table 2). Class 1: Consistently 2 ACEs with internalizing problems starting below average and decreasing had the lowest levels of ACEs, two per time point, and below average levels of internalizing problems at age 3, compared to the overall sample, which decreased to the lowest levels of all classes. Class 2: Consistently 4 ACEs with internalizing problems starting average and decreasing experienced consistently high levels of ACEs, four at each time point, and average levels of internalizing problems that decreased over time, closely resembling the overall sample mean levels over time. Class 3: Increasing from 3 to 4 ACEs with internalizing problems starting above average and stable experienced three ACEs at age 3 and 5, and four at age 9, as well as above average levels of internalizing problems at age 3, the highest levels, that stayed relatively stable until age 9 and were the second highest ending levels of all classes. Class 4: Consistently 3 ACEs with internalizing problems starting average and increasing steeply exhibited three ACEs at each time point and internalizing problems that were close to average at age 3, the lowest starting levels of internalizing problems of all classes, which increased to the very high level, the highest levels of all classes, by age 9 (see Figure 3).
ACEs and internalizing problems parallel process trajectories classes. Note. Child Behavior Checklist (CBCL); Total Sample Mean is the mean of the overall sample at each time point, which is provided for interpretability of classes.
Race/ethnicity, sex, and income differences in trajectory class membership
ACEs univariate trajectories classes
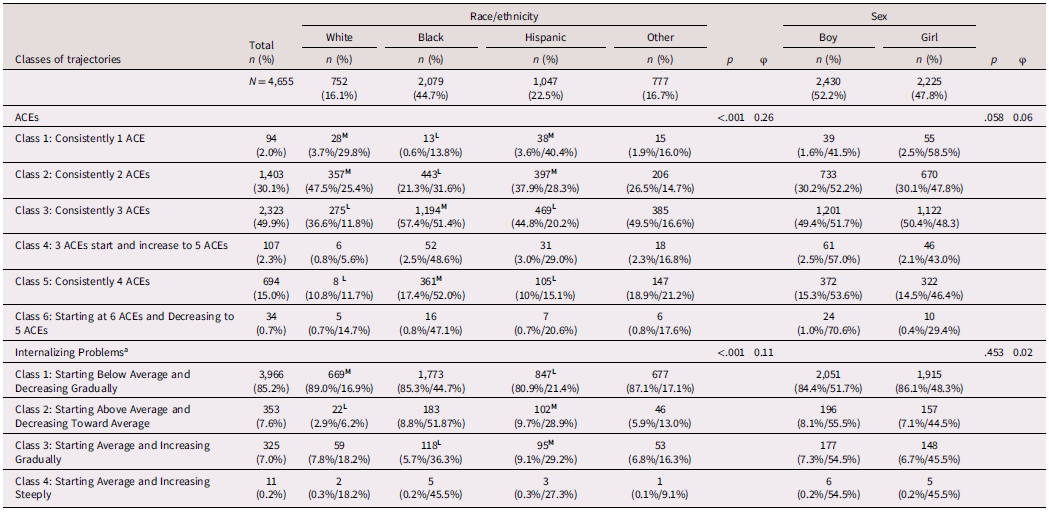
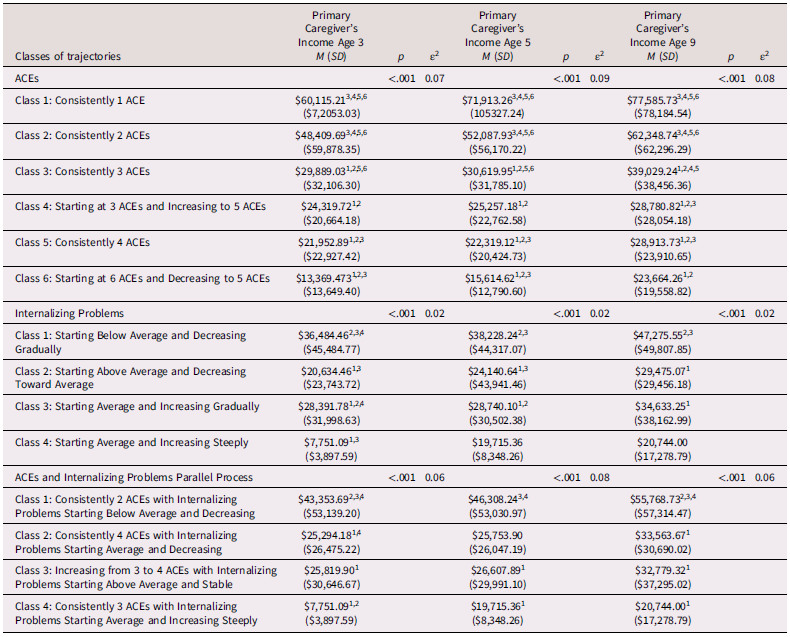
Significant differences were found for ACEs univariate trajectories classes by race/ethnicity, but not sex (see Table 3). White and Hispanic youth were more likely to be in Classes 1 and 2, and less likely to be in Classes 3 and 5 than Black and Other youth. Black children were less likely to be in Classes 1 and 2, and more likely to be in Classes 3 and 5 than White, Hispanic, and Other children. Differences were observed in ACEs univariate trajectories classes by primary caregiver’s income at age 3, 5, and 9. Across all ages, as income decreased, the trajectories appeared to have more ACEs; Class 1 had the highest income, followed by Class 2, 3, 4, and 5, with Class 6 having the lowest income (see Table 4).
Chi-Square test of independence for univariate trajectories of ACEs and internalizing problems by race/ethnicity and sex
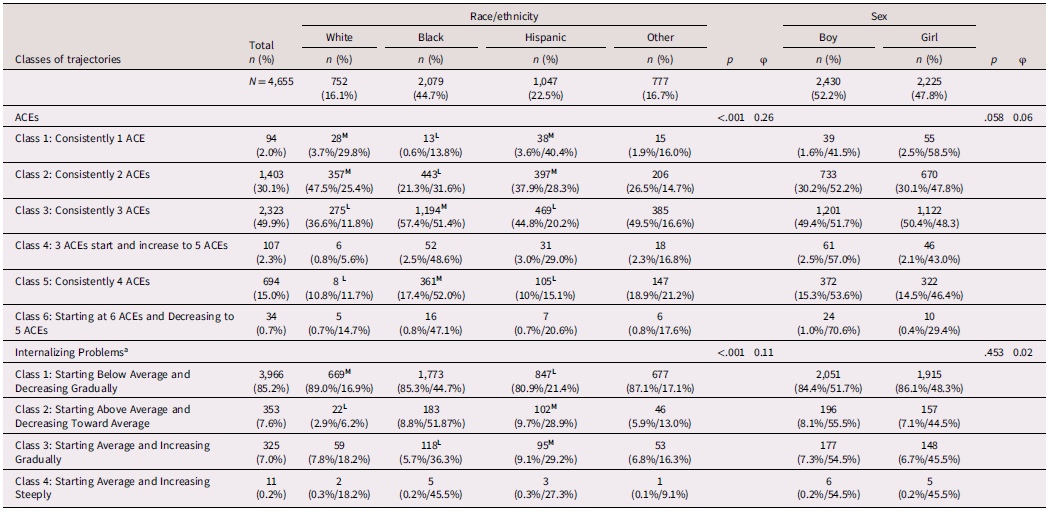
Table 3. Long description
The table presents the distribution of ACEs and internalizing problems across different races/ethnicities and sexes. It includes data for 4,655 individuals categorized by race/ethnicity (White, Black, Hispanic, Other) and sex (Boy, Girl). The table is divided into two main sections: ACEs and Internalizing Problems. Each section lists different classes of trajectories with corresponding counts and percentages for each race/ethnicity and sex. For ACEs, the classes range from consistently having 1 ACE to starting at 6 ACEs and decreasing to 5 ACEs. For internalizing problems, the classes range from starting below average and decreasing gradually to starting average and increasing steeply. Notable trends include higher percentages of Black individuals in Classes 3 and 5 for ACEs and higher percentages of White individuals in Class 1 for ACEs. For internalizing problems, the majority of individuals fall into the class of starting below average and decreasing gradually. The table also includes p-values and phi coefficients to indicate statistical significance and the strength of association between variables.
Note. Variable frequency is displayed by column/row.
aFisher’s exact tests used for internalizing problems trajectories race/ethnicity comparisons due to cell sparsity.
M = higher-than-expected count and L = lower-than-expected count for the specified race/ethnicity in the corresponding latent class growth analysis (LCGA) class based on adjusted residuals. Post hoc analyses adjusted for Bonferroni correction.
Kruskal–Wallis tests for univariate and parallel process trajectories of ACEs and internalizing problems by primary caregiver’s income
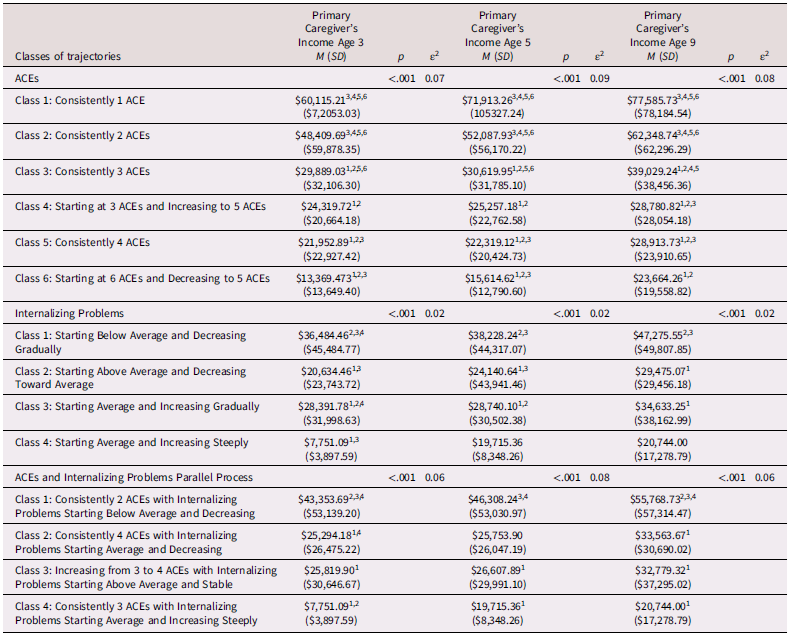
Table 4. Long description
The table presents data on the primary caregiver’s income across different classes of trajectories for ACEs and internalizing problems at ages 3, 5, and 9. It includes three main sections: ACEs, Internalizing Problems, and ACEs and Internalizing Problems Parallel Process. Each section lists different classes of trajectories with corresponding income values. The table has 15 rows and 12 columns. Column headers include Primary Caregiver’s Income Age 3, Primary Caregiver’s Income Age 5, and Primary Caregiver’s Income Age 9, each with Mean (M) and Standard Deviation (SD) values. Row labels include different classes of trajectories for ACEs and internalizing problems. Notable trends include decreasing income with increasing ACEs and varying income patterns with different internalizing problems trajectories.
Note. Statistically significant differences (p < .05) are indicated between the specified class and the indicated comparison class (1 = Class 1, 2 = Class 2, 3 = Class 3, 4 = Class 4, 5 = Class 5, or 6 = Class 6).
Post hoc analyses adjusted for Bonferroni correction.
Internalizing problems univariate trajectories classes
Differences were found by class membership of internalizing problems univariate trajectories classes and race/ethnicity, but not by sex. Hispanic youth were less likely to be in Class 1 and more likely to be in Classes 2 and 3, while White children were less likely to be in Class 2 and more likely to be in Class 1, and Black youth were less likely to be in Class 3. Black youth were also more likely to be represented in Class 2 than expected, but this finding was not statistically significant, but neared significance. Although Class 4 was small, it was predominantly represented by Black youth (see Table 3). Significant differences were also found by primary caregiver’s income at all ages. Youth with below average and average starting internalizing problems trajectories had higher income, whereas those with above average starting levels and steep increases over time had lower income. More specifically, Class 1 had the highest income, followed by Classes 3, 2, and 4 across all ages (see Table 4).
ACEs and internalizing problems parallel process trajectories classes
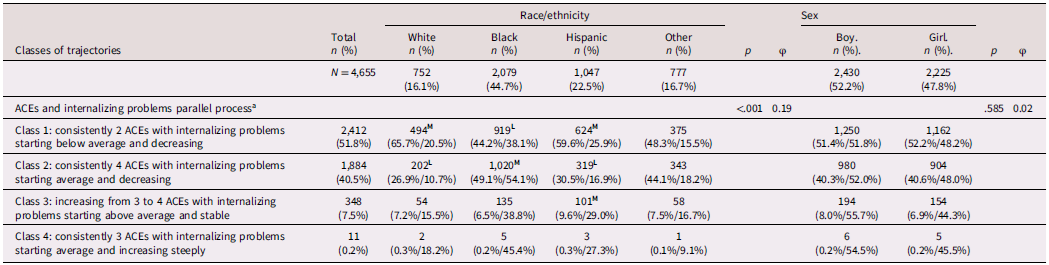
Parallel process trajectories classes of ACEs and internalizing problems significantly differed by race/ethnicity and primary caregiver’s income at all ages, but not by sex. White and Hispanic youth were more likely to be in Class 1 and less likely to be in Class 2 as compared to Black and Other youth. On the other hand, Black children were less likely to be in Class 1 and more likely to be in Class 2 than White, Hispanic, and Other children, and Hispanic youth were also more likely to be in Class 3 than expected, suggesting that Black and Hispanic youth, on average, experience more ACEs and higher levels of internalizing problems across childhood than White and Other youth. Despite the small size of Class 4, the class with the highest ending levels of internalizing problems, Black youth were disproportionately represented in this class (see Table 5). Differences by primary caregiver’s income were also observed in the parallel process trajectories across all ages. Classes that had fewer ACEs and internalizing problems trajectories with lower starting and ending values, had higher incomes than those with more ACEs and more severe internalizing trajectories. More precisely, Class 1 had the highest income, followed by Classes 3 and 2, while Class 4 had the lowest income. This pattern was mostly consistent across all ages, except at age 9, where Class 2 had a higher income than Class 3 (see Table 4).
Chi-square test of independence for parallel process trajectories of ACEs and internalizing problems by race/ethnicity and sex
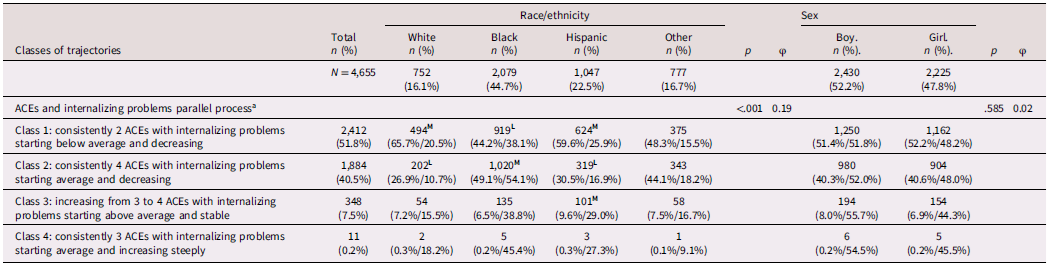
Table 5. Long description
The table presents data on the trajectories of ACEs and internalizing problems across different races, ethnicities, and sexes. It includes four classes of trajectories: Class 1, Class 2, Class 3, and Class 4. The table has 6 columns: Classes of trajectories, Total, Race/ethnicity, and Sex. The Race/ethnicity column is further divided into White, Black, Hispanic, and Other. The Sex column is divided into Boy and Girl. Each row provides the count and percentage of individuals in each class for the respective categories. Notable trends include the distribution of individuals across different classes and the variation in these distributions across different races, ethnicities, and sexes.
Note. Variable frequency is displayed by column/row.
a Fisher’s exact tests used for internalizing problems trajectories race/ethnicity comparisons due to cell sparsity.
M = higher-than-expected count and L = lower-than-expected count for the specified race/ethnicity in the corresponding Latent Class Growth Analysis (LCGA) class based on adjusted residuals.
Post hoc analyses adjusted for Bonferroni correction.
Discussion
The current study documents the individual and joint development of trajectories of ACEs and internalizing problems. We observed six classes of ACEs trajectories, four classes of internalizing problems trajectories, and four classes of parallel process trajectories of ACEs and internalizing problems. Our findings suggest that youth within the current sample experienced a consistent number of ACEs over time and decreasing or increasing internalizing problems across childhood, with different starting and ending levels. We observed nuances in the relationship between the number of ACEs experienced and levels of internalizing problems and disparities in the number of ACEs and levels of internalizing problems experienced based on sociodemographic characteristics. Our findings document the complex relationship between ACEs and the development of internalizing problems across childhood and highlight specific groups that are particularly at risk for negative mental health outcomes.
ACEs univariate trajectories
Six ACE trajectories emerged, mostly stable and ranging from one to six ACEs over time, with one class showing increasing exposure. This suggests that youth were exposed to the same number of ACEs at each age, whereas low (e.g., 1 ACE) or high (e.g., 6 ACEs), depending on the class. These findings are concerning, given that individuals with lifetime exposure to four or more ACEs are at a significantly greater risk of developing physical and mental health problems (Felitti et al., Reference Felitti, Anda, Nordenberg, Williamson, Spitz, Edwards, Koss and Marks1998). Some youths within the current sample exceeded this benchmark at each time point. Our study identified a greater number of ACEs trajectories as compared to a previous study examining longitudinal trajectories of ACEs (Thompson et al., Reference Thompson, Flaherty, English, Litrownik, Dubowitz, Kotch and Runyan2015), which identified three trajectories: (a) chronic ACEs, (b) early ACEs only, and (c) limited ACEs. None of the trajectories in our study were identical to those reported by Thompson et al. (Reference Thompson, Flaherty, English, Litrownik, Dubowitz, Kotch and Runyan2015); however, similar patterns emerged, with some youth experiencing a relatively high and stable number of ACEs across multiple time points, and others consistently having lower levels of ACE exposure compared to the other trajectories. Unlike Thompson et al. (Reference Thompson, Flaherty, English, Litrownik, Dubowitz, Kotch and Runyan2015), we did not identify a class characterized by limited ACEs exposure in early childhood but instead identified various classes wherein the baseline number of ACEs at age three persisted over time. These differences are notable given that both studies focused on at-risk samples, suggesting potential heterogeneity between samples. However, they might also reflect methodological differences, including variation in ACEs measurement and developmental timing of assessments. For instance, Thompson et al. (Reference Thompson, Flaherty, English, Litrownik, Dubowitz, Kotch and Runyan2015) included sexual abuse as an ACE, while we were unable to due to its lack of measurement in the current dataset. In addition, we assessed ACEs at ages 3, 5, and 9, which only corresponds to a portion of the developmental periods captured by Thompson et al. (Reference Thompson, Flaherty, English, Litrownik, Dubowitz, Kotch and Runyan2015), who compiled ages 0–6 and 6–12 into two different time points.
Internalizing problems univariate trajectories
For the internalizing problems univariate trajectories, four classes were identified: low and decreasing (Class 1), high and decreasing (Class 2), average and gradually increasing (Class 3), and average with a steep increase to the highest levels over time (Class 4). We only found unstable trajectories with an increasing or decreasing pattern; however, previous studies mostly found stable trajectories and very few unstable trajectories (Davis et al., Reference Davis, Votruba-Drzal and Silk2015; Klein et al., Reference Klein, Schlesier-Michel, Otto, White, Andreas, Sierau, Bergmann, Perren and von Klitzing2019; Sterba et al., Reference Sterba, Prinstein and Cox2007). We may have observed a greater number of unstable trajectories with increasing and decreasing patterns as compared to prior studies (Klein et al., Reference Klein, Schlesier-Michel, Otto, White, Andreas, Sierau, Bergmann, Perren and von Klitzing2019; Sterba et al., Reference Sterba, Prinstein and Cox2007) for several reasons. First, our sample included a large representation of underrepresented and marginalized participants. These populations have remained understudied in developmental psychopathology research, which has historically relied on predominantly White samples (Narayan et al., Reference Narayan, Brown and Lawler2024). Indeed, previous studies examining longitudinal trajectories of internalizing problems have either included predominantly White samples or have not discussed the racial/ethnic composition of their sample (Davis et al., Reference Davis, Votruba-Drzal and Silk2015; Klein et al., Reference Klein, Schlesier-Michel, Otto, White, Andreas, Sierau, Bergmann, Perren and von Klitzing2019; Sterba et al., Reference Sterba, Prinstein and Cox2007). Thus, we might have captured greater heterogeneity in internalizing problems over time, given the diversity of our sample. Furthermore, prior research has utilized either T-scores (Sterba et al., Reference Sterba, Prinstein and Cox2007) or less comprehensive measures of internalizing problems that contain fewer items assessing internalizing problems (Klein et al., Reference Klein, Schlesier-Michel, Otto, White, Andreas, Sierau, Bergmann, Perren and von Klitzing2019), potentially limiting the variability observed in internalizing problems. Unlike these studies, we used raw scores from the CBCL internalizing problems subscale, which may have allowed for greater variability in symptom levels compared to standardized T-scores (Achenbach, Reference Achenbach1997), potentially contributing to the identification of more unstable developmental trajectories. Despite the various trajectories identified, most of the current sample was represented in Class 1 (85.2%), which is not surprising given that this trajectory had the lowest levels of internalizing problems over time and may be representative of a normative trajectory. We also identified a trajectory with higher starting levels of internalizing problems that decreased over time (i.e., Class 2) and another that had average levels and increased over time (i.e., Class 3). These findings suggest that youth follow diverse developmental trajectories of internalizing problems, with some experiencing elevated symptoms earlier in childhood and others later, underscoring the importance of continuous screening and early identification of internalizing problems throughout development. Lastly, although Class 4 represented only a small proportion of the overall sample (0.2%), extrapolating this class was important because these youth demonstrated a steep increase in internalizing symptoms over time. Prior research suggests that youth with elevated or increasing trajectories of internalizing symptoms are at greater risk for depressive symptoms in adulthood as compared to those with lower symptom trajectories (Sterba et al., Reference Sterba, Prinstein and Cox2007). Thus, despite its small size, this class may represent a clinically meaningful subgroup of youth at heightened risk for unfavorable outcomes later in life.
ACEs and internalizing problems parallel process trajectories
Four joint ACEs and internalizing trajectories emerged: Class 1 had low ACEs and below average decreasing internalizing problems; Class 2 had high ACEs and average-decreasing internalizing problems; Class 3 showed increasing ACEs from 3 to 4 with stable above-average internalizing problems; and Class 4 had moderate ACEs with steeply increasing internalizing problems. Class 2 and Class 3 experienced the most ACEs at each time point as compared to the other classes, with Class 2 reporting the greatest number of ACEs at ages 3 and 5 and Class 3 at age 9. Notably, despite Class 2 having the highest ACEs exposure in two of the time points, they exhibited some of the lowest levels of internalizing problems over time. In contrast, youth who went from three ACEs at age 3 to four at age 9 (Class 3) or had three ACEs consistently across time (Class 4) had the highest levels of internalizing problems by age 9, with youth in Class 4 having the steepest increase and highest levels despite experiencing the second lowest exposure to ACEs compared to other classes. While these findings are somewhat consistent with prior work linking higher cumulative ACEs exposure – particularly four or more ACEs (Felitti et al., Reference Felitti, Anda, Nordenberg, Williamson, Spitz, Edwards, Koss and Marks1998) – to elevated internalizing problems (i.e., dose–response relationship; Schroeder et al., Reference Schroeder, Slopen and Mittal2020), they also highlight important limitations of the dose–response model. Specifically, youth in Class 2 – who had the highest cumulative ACEs scores at the two earliest time points – did not exhibit the highest levels of internalizing problems as expected based on the dose-response model. In contrast, youth with relatively lower ACEs exposure – although differing by less than one ACE on average – showed more severe trajectories of internalizing problems that increased significantly over time (e.g., Class 4). These patterns suggest that cumulative ACEs exposure alone does not fully explain heterogeneity in internalizing symptom trajectories among youth, indicating that the relationship is more nuanced than a simple dose–response model.
There are possible explanations for these findings, including factors not accounted for within this study. It is possible that lower levels of internalizing problems were seen in youth who experienced greater adversity because of individual (e.g., coping mechanisms) or systemic influences (e.g., family and community support), which promote resilience. Further, the methodology used in this study does not account for the frequency and severity of each ACE (Evans et al., Reference Evans, Li and Whipple2013), both of which are important in predicting mental health outcomes. Individuals may experience few ACEs but with high frequency and/or severity, which may explain why some youth with fewer ACEs had higher internalizing problems in the current study. Future research should examine how the frequency and severity of ACEs, along with protective factors, influence the development of internalizing problems over time, highlighting which aspects of adversity increase risk and informing novel avenues for intervention.
Furthermore, our results did not align with previous studies suggesting sensitive periods in development (Dunn et al., Reference Dunn, Nishimi, Neumann, Renaud, Cecil, Susser and Tiemeier2020; Keiley et al., Reference Keiley, Howe, Dodge, Bates and Petti2001), as adversity was experienced in similar amounts over time and not in one isolated time period, which was later associated with increases in internalizing problems. Sensitive periods may be better identified using more timepoints, a sample with more variability in ACEs exposure (i.e., a non-at-risk sample), and methods such as machine learning, which can assess many variables simultaneously and rank them by the amount of variance they explain. This approach allows pairing individual or cumulative ACEs with each age (e.g., physical abuse at age 5, cumulative ACEs at age 5) to determine which exposures explain the most variance in internalizing problems.
Socioemographic disparities in trajectories
We observed disparities in univariate and parallel process trajectories of ACEs and internalizing problems by race/ethnicity and income, but not by sex, which was unexpected given prior research suggesting sex differences in ACEs exposure (Mersky et al., Reference Mersky, Choi, Plummer Lee and Janczewski2021) and internalizing problems (Gutman & Codiroli McMaster, Reference Gutman and Codiroli McMaster2020; Sterba et al., Reference Sterba, Prinstein and Cox2007). Not finding sex differences may reflect developmental timing rather than the absence of risk. Sex differences in internalizing symptoms typically emerge during late childhood and adolescence (Gutman & Codiroli McMaster, Reference Gutman and Codiroli McMaster2020; Sterba et al., Reference Sterba, Prinstein and Cox2007). Consistent with this pattern, prior research has found no sex differences in internalizing problems among 9- to 10-year-old children (Serio et al., Reference Serio, Kohler, Ye, Lichenstein and Yip2022), an age range corresponding to the final wave of the present study. These findings suggest that sex differences may have not yet emerged in our sample.
Regarding differences by race/ethnicity, Black youth were more likely to be in trajectories with higher ACEs, while White and Hispanic youth more often in trajectories with fewer ACEs. Hispanic youth showed more severe or less favorable trajectories of internalizing problems compared to their counterparts, whereas Black youth were less likely to be in the gradual-increase trajectory (Class 3) and overrepresented in classes with elevated but decreasing internalizing problems (Class 2), though this latter association was not significant. Class 4, the most concerning trajectory – marked by steep increases in internalizing problems – was disproportionately represented by Black youth. White youth, on the other hand, were most likely in the least severe or normative trajectory (Class 1). Somewhat similar findings were observed in the parallel process trajectories of ACEs and internalizing problems, with White youth experienced fewer ACEs and internalizing problems, whereas Black youth had trajectories with more ACEs but lower internalizing problems (Class 2) and Hispanic youth were more represented in classes with both fewer ACEs or decreasing internalizing problems (Class 1) and higher ACEs and stable internalizing problems (Class 3). Black youth were predominantly represented in the most concerning parallel ACEs and internalizing problems class (Class 4), which was characterized by steep increases in internalizing problems. Overall, our findings support the notion that Youth of Color are at increased risk for experiencing negative outcomes.
While our findings align with prior research showing greater ACE exposure among Black youth, the lower ACE exposure observed among Hispanic youth contrasts findings from previous studies (Mersky et al., Reference Mersky, Choi, Plummer Lee and Janczewski2021), potentially reflecting sample differences and heterogeneity within the Hispanic population. Although we hypothesized that all Youth of Color would follow higher internalizing problem trajectories (Anderson & Mayes, Reference Anderson and Mayes2010), this pattern was observed only for Hispanic youth, which may be explained by culture-specific factors such as language preference, nativity, cultural values (e.g., familism), and acculturation stress (Anderson & Mayes, Reference Anderson and Mayes2010; Cruz et al., Reference Cruz, Navarro, Carrera, Lara, Mechammil and Robins2019). Conversely, Black youth were also represented in lower internalizing problem trajectories, contrary to prior literature, suggesting the presence of potential unmeasured protective factors such as family resilience and neighborhood cohesion (Bernard et al., Reference Bernard, Jensen and Lanier2024). Future research should examine culture-specific risk and protective processes among Hispanic and Black youth.
Income differences were also observed in both univariate and parallel process trajectories of ACEs and internalizing problems, with lower-income youth being overrepresented in trajectories with higher ACEs and internalizing problems, which is consistent with prior literature (Lansford et al., Reference Lansford, Malone, Tapanya, Tirado, Zelli, Alampay, Al-Hassan, Bacchini, Bornstein, Chang, Deater-Deckard, Giunta, Dodge, Oburu, Pastorelli, Skinner, Sorbring and Steinberg2019). It is concerning that all three sets of trajectories revealed similar findings, indicating that lower-income youth, as compared to more affluent youth, face greater consequences, including increased exposure to adversity and mental health problems. Income differences by race/ethnicity were also observed, with White youth having the highest income, followed by Other, Black, and Hispanic youth. Combined, these findings provide further evidence that marginalized youth experience significant consequences and highlight possible systemic factors, such as structural racism, that may drive these inequities in exposure to adversity (Alvarez et al., Reference Alvarez, Cervantes, Nelson, Seag, Horwitz and Hoagwood2022).
Strengths and limitations
This study has several notable strengths, including a large sample of racially and ethnically diverse families that largely comprised of at-risk families (e.g., single-parent, lower-income households), offering insight into the well-being and stressors experienced by marginalized members of our society. Using longitudinal, person-centered approaches, we identified high-risk trajectories (e.g., elevated ACEs and internalizing problems), thus highlighting youth who would most likely benefit from prevention and intervention efforts. This study also addresses a key gap in understanding the developmental interplay between ACEs and internalizing problems in childhood (Schroeder et al., Reference Schroeder, Slopen and Mittal2020), and extends prior work by identifying these trajectories in a diverse sample of youth.
This study also has several limitations. First, ACEs were dichotomized, which precludes consideration of the relative weight, frequency, and severity of the individual adversities (Evans et al., Reference Evans, Li and Whipple2013). Second, our study is limited by the ACEs measurement approach used. ACEs included in the current study were informed and guided by ACEs included in the original ACEs study (Felitti et al., Reference Felitti, Anda, Nordenberg, Williamson, Spitz, Edwards, Koss and Marks1998) and measures available across all three waves examined in the dataset, which may exclude adversities disproportionately affecting marginalized youth (e.g., expanded ACEs, discrimination, witnessing violence, living in unsafe neighborhoods; Cronholm et al., Reference Cronholm, Forke, Wade, Bair-Merritt, Davis, Harkins-Schwarz, Pachter and Fein2015). Thus, potentially underestimated adversity exposure among marginalized youth. Nevertheless, marginalized youth in our study experienced greater ACEs exposure, highlighting disparities and identifying those at risk for poorer mental health outcomes. Future research should incorporate expanded ACEs and examine their longitudinal associations with internalizing problems to better understand these disparities. Furthermore, the ACEs measure of parental mental health was limited to mothers’ and fathers’ depressive symptoms, and other relevant mental health conditions were not assessed. This may have limited our ability to capture the full range of parental mental health experiences. Future studies should assess a broader range of parental mental health conditions. There are also limitations in the measurement of parental divorce/separation. No measure singly assessed parents’ relationship status with input from both parents; thus, mothers’ and fathers’ individual reports of their relationship status had to be used. In cases of discrepant reporting between mothers and fathers, divorce/separation was coded as present if either parent endorsed a separation-related response. This approach was taken to capture relationship disruption among parents. While discrepant reports did not occur frequently, this approach may have introduced some misclassification of parental divorce/separation. Third, only three time points with unequal spacing between waves were utilized, which may limit the ability to capture developmental change and detect nonlinear or short-term change adequately. Furthermore, ACEs measures varied in their reference periods (e.g., since last wave, past month, past two weeks), which can potentially introduce inconsistency in exposure assessment over time. Data with more densely spaced (e.g., yearly) time points that extend into later ages in development and provide more consistency in ACEs measures could improve consistency and help identify sensitive periods in development. Fourth, child race/ethnicity and primary caregiver’s income were constructed using combined information from biological mothers and fathers, which may introduce potential measurement error and misclassification. Finally, this study relied on caregiver reports on measures of ACEs and internalizing problems, which may lead to underreporting from caregivers due to fear of consequences or shame.
Implications
Our findings have several implications for screening, intervention, prevention, and social policy efforts. Although our findings did not identify any sensitive periods related to ACEs exposure nor a clear dose–response relationship across the identified classes, they do highlight that many youth in this sample experienced consistent, and in some cases high, exposure to adversity across childhood. Thus, consistent screening for ACEs may be beneficial for identifying ongoing family needs, detecting potential child maltreatment or exposure to adversity, and facilitating connections to supportive services and resources, which could reduce exposure to ACEs (Gordon & Felitti, Reference Gordon and Felitti2023). An assessment of mental health difficulties should also accompany such screening to determine whether mental health services are needed or would be beneficial (Gordon & Felitti, Reference Gordon and Felitti2023). Accordingly, early identification through combined ACEs and mental health screening may help identify those who could benefit from early intervention and support, and promote better outcomes (Alvarez et al., Reference Alvarez, Cervantes, Nelson, Seag, Horwitz and Hoagwood2022). This type of screening may be particularly beneficial for marginalized youth (e.g., Youth of Color and low-income youth), who face systemic barriers to accessing mental health care, thus potentially increasing access to services among this youth who are at elevated risk for ACEs exposure and mental health concerns based on our findings, particularly when screening is conducted in settings that families already access (e.g., pediatric or community settings). Furthermore, given our study’s findings indicating that youth experienced a relatively stable number of ACEs over time, suggesting potential chronic exposure to adversity across childhood, youth with high and consistent exposure to ACEs may benefit from culturally responsive, trauma-informed interventions that address contextual factors affecting marginalized families (Alvarez et al., Reference Alvarez, Cervantes, Nelson, Seag, Horwitz and Hoagwood2022). For instance, parenting programs may support caregivers in responding to ongoing adversity and promoting adaptive parenting practices. Research suggests that parenting interventions may reduce children’s exposure to adversity and associated negative outcomes (World Health Organization, 2022). Parenting interventions may be particularly beneficial for low-income families and families of color when adapted to address contextual needs, including basic needs, childcare needs, and other socioeconomic stressors that may affect daily functioning and engagement in services (Podorefsky et al., Reference Podorefsky, McDonald-Dowdell and Beardslee2001).
It is important that our findings are not interpreted as blaming marginalized families for exposing youth to increased ACEs and instead should be understood through a critical lens that emphasizes how positions of social vulnerability increase the risk for experiencing adversity among marginalized individuals (Alvarez et al., Reference Alvarez, Cervantes, Nelson, Seag, Horwitz and Hoagwood2022). Thus, interventions and prevention efforts should consider systemic and contextual factors that influence youth well-being, including organizational, community, and policy-level approaches, to promote equity and support marginalized families (Alvarez et al., Reference Alvarez, Cervantes, Nelson, Seag, Horwitz and Hoagwood2022). Efforts might include approaches shown to address systemic inequities affecting low-income families and families of color such as connecting families with community organizations to reduce housing and food insecurity, enhancing neighborhood safety, and strengthening support networks (Alvarez et al., Reference Alvarez, Cervantes, Nelson, Seag, Horwitz and Hoagwood2022).



 Open access

