

War is arguably one of the most severe disasters that could affect a stock market. Most academic discussions focus on the effects of war in the post-WWI period for bonds (e.g., Oosterlinck and Landon-Lane Reference Oosterlinck and Landon-Lane2006; Moore and Kaluzny Reference Moore and Kaluzny2005; Sussman and Yafeh Reference Sussman and Yafeh1998) and stocks (e.g., Berkman, Jacobsen, and Lee Reference Berkman, Jacobsen and Lee2011; Le Bris Reference Le Bris2012; Zussman, Zussman, and Nielsen Reference Zussman, Zussman and Nielsen2008). To date, there has been little evidence for the pre-WWI period and, more specifically, on managerial behavior.Footnote 1 Researchers are generally hampered by a lack of high-quality data, mainly because wars occur infrequently. I overcome this issue by creating two war risk measures based on military threat and act. With the measures, I attempt to deepen our understanding of how managerial and investor behavior is affected by military turmoil, by focusing on the Brussels Stock Exchange (BSE) in the buildup to WWI.
I use the time period from January 1885 to June 1914. This period is interesting from five perspectives. First, this era was characterized by multiple conflicts that had the potential to turn into a major global war (i.e., The First Balkan War and the Italo-Turkish War). Although WWI seemed inevitable, nobody knew how the conflict would unfold. Second, globalization peaked at a level that was only re-obtained in the 1990s (Obstfeld and Taylor Reference Obstfeld, Taylor, Bordo, Taylor and Williamson2003).Footnote 2 Belgium established itself as a global trade partner with the ports of Antwerp and Bruges. On the eve of WWI, Belgium’s total trade accounted for more than 80 percent of its gross national product (GNP), only preceding the Netherlands (Estevadeordal Reference Estevadeordal1997). Third, almost all nations adopted the classical Gold Standard, which fixed the value of local currencies to a specified amount of gold (Eichengreen and Flandreau Reference Eichengreen and Flandreau1994). Therefore, I can more easily compare companies across countries. Four, Belgium was an unregulated capital market. Tax rates were effectively zero.Footnote 3 Therefore, I rule out that some important market frictions are driving the results. Fifth, the BSE was one of the world’s most important stock exchanges (Chambers and Dimson Reference Chambers and Dimson2016). It had stock listings from a wide selection of industries and countries, making it an interesting case to examine these problems (Moore Reference Moore2012).
I start by collecting a sample of articles from the archives of The Economist to construct two war risk metrics, Threat and Act. This sample contains 100,803 articles from the period January 1885 to July 1914. I draw on the methodology of both Publication year of in-text citation “Baker et al. (2016)” has been changed to “2015” as per the reference list. Please check.Baker, Bloom, and Davis (Reference Baker, Bloom and Davis2015) and Caldara and Iacoviello (Reference Caldara and Iacoviello2018). Every issue, I run a textual analysis to count the number of articles that discuss a potential military conflict (Threat) or the onset of a war (Act). To be considered, each article must mention at least two predetermined search terms and one nation that was both a key trade partner for Belgium and had a sizeable number of stock listings on the BSE—that is, Belgium, France, Germany, Italy, Russia, Spain, the Netherlands, and the United Kingdom (Huberman, Meissner, and Oosterlinck Reference Huberman, Meissner and Oosterlinck2017; Estevadeordal Reference Estevadeordal1997). Subsequently, I perform a human reading on all articles from the textual analysis and a randomly selected subset of other articles with the key words. This human reading part is important since I want to remove all articles that discuss the aftermath of a war or that report on tariff wars.
This approach offers the following potential advantages. First, newspapers are a detailed source of narrative history that help us understand our (recent) history. It is insightful to evaluate what people were discussing, rather than what is perceived with hindsight. Most papers use price data to understand war (Ferguson Reference Ferguson2006; Le Bris Reference Le Bris2012; Oosterlinck and Landon-Lane Reference Oosterlinck and Landon-Lane2006). In comparison, I focus on potential disasters to understand managerial or investor behavior. Second, the measures allow me to continuously track war risk, which makes it quantifiable. I do not have to use an event study to infer the effects of war (i.e., Le Bris Reference Le Bris2012) nor do I have to rely on dummy variables that neglect the magnitude of these conflicts (Berkman, Jacobsen, and Lee Reference Berkman, Jacobsen and Lee2011).Footnote 4 I include those changes in news coverage when no actual conflict materialized. This keeps me out of the trap of historical simplification. Finally, there was a lack of news dissemination. Investors had to rely more heavily on classical outlets (i.e., newspapers). With the lack of general media, such as radio or television, information traveled more slowly.Footnote 5 Hence, the content in newspapers is arguably more valuable relative to current media.
There are two questions in assessing the effect of war risks in financial markets. First, did companies mitigate war risks? In a period when dividends were used as a key information channel for investors, I document that an increase in Act corresponds to a decrease of dividend growth. This result is robust when I control for other risk factors such as business cycle variation, political and economic uncertainty, and industry-specific effects. In turn, an increase in Threat does not systematically lead to a dividend cut. These findings suggest that firms would only adjust their dividend policy when news was really bad. This reconciles with previous research that highlighted a negative effect of dividend cuts on stock prices (Braggion and Moore Reference Braggion and Moore2011; Turner, Ye, and Zhan Reference Turner, Ye and Zhan2013). More importantly, I show that firms were establishing a war chest to anticipate potential low demand or trade opportunities as the result from an outbreak of war. That is, I fail to find a relationship between Act and firm earnings, future dividend growth rates, or number of bankruptcies. In turn, I provide anecdotal evidence that firms were more reluctant in their payout policy. The accumulated evidence indicates that firms became more risk averse due to the (potential) war.
I complete my analysis on managerial behavior by focusing on the timing of key firm financing decisions. First, I document that an increase in Threat and Act has a negative impact on the number of future initial public offerings (IPOs). Since such an investment decision is irreversible and can be postponed, it is intuitive for companies to wait for additional information rather than invest now. This evidence is in support of the risk-aversion hypothesis. Second, I find that foreign companies were more likely to delist after the increase in Act, while there is no effect for Threat. Since delisting is a costly decision, it is reasonable that firms only made that decision when war happened. However, there could be several explanations why a foreign firm would delist, such as bankruptcy, to prevent potential hostile (foreign) takeover, or to keep important (military) information within the foreign country. Nevertheless, it is possible that risk aversion also played a role in a firm’s delisting decision. The additional findings help me address concerns that the dividend policy evidence is spurious and that they are driven by other (omitted) economic drivers.
The second question is how investors reacted to changes in war news coverage. First, I show that an increase in Threat or Act has a contemporaneous negative effect on stock prices. The magnitude of this effect is larger for Act, which is explained by the negative relationship on dividend growth rates or the increased uncertainty as a consequence of war (Barro Reference Barro2009). Nevertheless, the evidence indicates that investors became more risk averse after an increase in war news. This conclusion reconfirms the evidence from managerial behavior. The findings complement the evidence from a contemporary time period (e.g., Campbell, Quinn, and Turner Reference Campbell, Quinn and Turner2017; Sussman and Yafeh Reference Sussman and Yafeh1998). Furthermore, I show that past information played a more prominent role after the outbreak of a war. The effect of Act on stock prices is permanent rather than temporary. This is intuitive since wars are associated with higher welfare costs. In turn, I find that stock prices quickly revert to the mean when Threat is not followed by Act. This suggests that the BSE was relatively efficient in the sample period.
Second, I highlight the importance of proximity to wars. For European nations that are not captured in Threat and Act, I document a contemporaneous decrease in stock prices after the increase in both risk measures. In turn, I find that an increase in Threat or Act is not associated with a decrease in dividend payout. This indicates that firms from other European countries did not change their dividend policy as a consequence of war when they were not involved in the military conflicts. Similar to the overall results, the stock price changes because the investors change their return expectations. For non-European countries, I document no relationship between the risk measures and stock returns. Therefore, I conclude that investors and firms did not appear concerned when war was far away or when potential spillovers were small. This suggests that war risks are local rather than global. Furthermore, I question the existence of an “empire effect” for stocks (Ferguson and Schularick Reference Ferguson and Schularick2006), since stock prices of colonies did not react to the general trend on the BSE.
HISTORICAL BACKGROUND
I focus on the 1885–1914 period to examine how companies mitigate war risk and how war risk is priced on the stock market. The rationale behind the starting point is twofold. First, I capture the Bulgarian crisis, which is sometimes referred to as the onset of the escalating period before WWI (Ferguson Reference Ferguson2006). July 1914 is the natural cut-off point since the BSE was closed from 27 July due to the outbreak of WWI. Second, starting in 1885, there are a notable number of foreign stocks listed on the BSE. Aside from data availability, the choice of Belgium demands further explanation, which I detail in the subsequent sections.
Economic Development
Globalization during the late nineteenth and early twentieth centuries was deep and durable. In the 1885–1914 period, Belgium was a well-developed economy, contributing to worldwide foreign direct investments. There are three key catalysts for this evolution. First, Belgium was one of the first nations in Europe to industrialize, which attracted many business opportunities (Annaert, Buelens, and Cuyvers Reference Annaert, Buelens and Cuyvers2018; Annaert, Buelens, and De Ceuster Reference Annaert, Buelens and De Ceuster2012). Second, due to its favorable tax regimes, Belgium saw a remarkable inflow of foreign investors and capital, especially due to the Franco-Prussian War (1870/71). In fact, Belgium had almost no taxation on company profits or dividends, in contrast to other nations. Many foreign companies even used securities that were trading on the BSE as a means of payment for Belgian exports (Van Nieuwerburgh, Buelens, and Cuyvers Reference Van Nieuwerburgh, Buelens and Cuyvers2006).Footnote 6 The inflow of foreign capital aided the BSE to become one of the largest stock exchanges, in terms of market capitalization, in the world (Chambers and Dimson Reference Chambers and Dimson2016; Annaert, Buelens, and De Ceuster Reference Annaert, Buelens and De Ceuster2012). The aggregate market value of Belgian joint-stock companies relative to its GDP equaled 0.99 in 1913 (Rajan and Zingales Reference Rajan and Zingales2003). In comparison, this measure in France, the Netherlands, the United Kingdom, and the United States was, respectively, equal to 0.78, 0.56, 1.09, and 0.39. In fact, there were 108.70 listed companies per million people in Belgium compared to 13.29 for France, 65.87 for the Netherlands, 47.06 for the United Kingdom, and 4.75 for the United States. This highlights the importance of the BSE in the international framework. More importantly, Brussels received great interest from Argentina, China, Egypt, Russia, the Ottoman Empire, and so forth. Participation rates of foreign capital in newly founded Belgian-based, foreign-operated, joint-stock companies surged to 64 percent in 1913 (Van de Velde Reference Van de Velde1943). Third, the Belgian Worker’s Party, which was established in 1885, had free trade as one of the main items on its program. During the general election of 1894, the party gained its first parliamentary representation and pushed more toward openness.Footnote 7
Belgium followed the general European trend to become an important source of capital (Lebergott Reference Lebergott1980). In fact, Belgium signed its own trade agreements with France (1861), Britain (1862), the Netherlands (1863), and Prussia (1865) (Huberman Reference Huberman2008). Between 1900 and 1914, Belgium’s international exposure increased at 1.50 percent per year (Huberman, Meissner, and Oosterlinck Reference Huberman, Meissner and Oosterlinck2017). In 1913, trade accounted for more than 80 percent of Belgian GNP compared to 39 percent for France, 40 percent for Germany, and 48 percent for the United Kingdom, preceding the Netherlands (Estevadeordal Reference Estevadeordal1997). On a per capita basis, the surge in Belgium’s trade was the most pronounced in Europe. Belgium’s commitment to openness was relatively stable in this period. It was mostly trading agricultural and manufacturing products such as textiles and clothing (Huberman, Meissner, and Oosterlinck Reference Huberman, Meissner and Oosterlinck2017) and tram- and railways (Annaert, Buelens, and Cuyvers Reference Annaert, Buelens and Cuyvers2018; Annaert, Buelens, and De Ceuster Reference Annaert, Buelens and De Ceuster2012).Footnote 8 The dependence of trade and cross-border investments made the Belgian economy and the BSE much more vulnerable to war abroad.Footnote 9 More generally, since globalization reached a high level before WWI, the effects of war could have had a huge impact on other countries (Obstfeld and Taylor Reference Obstfeld, Taylor, Bordo, Taylor and Williamson2003).
Relative to other countries, where only a very few sectors were developed, the Belgian economy was already relatively diversified (i.e., Chambers and Dimson Reference Chambers and Dimson2016; Annaert, Buelens, and De Ceuster Reference Annaert, Buelens and De Ceuster2012). Since Belgium was not specialized in one specific product, the distribution of various industries was arguably more different than other exchanges. For instance, railways dominated the U.S. and U.K. stock markets with a relative market share of, respectively, 63 percent and 50 percent (i.e., Chambers and Dimson Reference Chambers and Dimson2016). German exchanges consisted largely of manufacturing and mining companies (Moore Reference Moore2012). In turn, the BSE’s relative market capitalization equaled 40 percent for transportation, 25 percent for financial, 20 percent for industrial, and 15 percent for mining companies.Footnote 10 Moreover, the BSE was also diversified in terms of foreign cross-listings relative to other exchanges (Lebergott Reference Lebergott1980; Moore Reference Moore2012). However, the BSE’s cross-listings were not always representative of the foreign country’s economy. In fact, the Russian stocks on the BSE were companies concentrated in Southern Russia, mainly active in mining, metal, and transportation. Russian firms on the St. Petersburg exchange were concentrated around Moscow in the textile industry (Annaert, Buelens, and Cuyvers Reference Annaert, Buelens and Cuyvers2018; Moore Reference Moore2012). To circumvent this issue, I include robustness tests from other data sources in the Online Appendix.
Military Development
While war seemed inevitable, few people foresaw its onset and the participants. For instance, The Economist published an article on 5 April 1913:
Dr. Charles Richet, a professor in the University of Paris, has recently calculated the cost of a European war at the present day. It is impossible, of course, to control all his estimates, but nevertheless this interesting attempt deserves attention. Should a war break out tomorrow, he says, over the question of a Servian harbour on the Adriatic or the frontiers of Albania, the Triple Alliance and the Triple Entente would…
In the pre-WWI period, alliances between nations changed frequently, which made predictions rather complicated.Footnote 11 The two prominent alliances are the Triple Entente and Triple Alliance. The Triple Alliance was established out of the Dual Alliance between Germany and Austria-Hungary, which had its origins in 1879. Russia and Italy joined, respectively, in 1881 and 1882. When Germany refused to sign the Reinsurance treaty in 1890, Russia backed out of the accord. In turn, the Triple Entente was created with a Franco-Russian alliance in 1893. In 1904, the United Kingdom joined as the result of the formal entente with France. Nevertheless, these alliances were contested. First, as discussed earlier, France and the United Kingdom were in conflict at the turn of the twentieth century. Entente Cordiale (1904) was the result of remarkable improvements in the Anglo-Franco relations. Second, during the Russo-Japanese War (1904/05), the United Kingdom was the ally of Japan, although they remained neutral in that war.Footnote 12 In 1907, the United Kingdom signed the Anglo-Russian convention, which eased the tension between them.
In the period before 1914, wars between European nations had been few and relatively brief. Many of these historical events are generally undisputed and their dating poses few problems. With the benefit of hindsight, one can easily fall into the trap of historical simplification. There are a few examples of this bias in the sample period. First, there was increased uneasiness in Europe after the Servia-Bulgarian conflict (1885). In July 1887, The Economist reported:
The general belief of Europe that war is improbable this year … is probably well-founded; but we should not be wanting in our duty if we did not point out that some lowering clouds are settling over Europe. In the extreme East, the Bulgarian situation, though it seems simple to Englishmen, may at any time involve results of the highest moments. The tension in Sofia itself is growing acute…
Second, the Franco-Hova War (1883–1895) made up two French attacks fought in Madagascar. However, The Economist published the article “The French Declaration of War against Madagascar” on 17 November 1894:
The English have no right to prevent the French from conquering Madagascar if they can…. It is natural, therefore, that the British should sympathize with the Malagasy in the coming war.
From the title alone, one would deduce that this was a distant African conflict. Nevertheless, the writer urged the British government to fight alongside the Malagasy against France. This increased military tensions within Europe as well.
Third, the Spanish–American War (1898) had an impact on multiple European nations, which were not directly involved in this conflict. In Europe, there was uncertainty surrounding a potential front of the British with the United States against other European countries.Footnote 13 In Italy, this war gave rise to economic and political instability. There was a premature attempt at a revolution, as a consequence of the increase in commodity prices.Footnote 14
This example is interesting from other viewpoints. First, starting with the Spanish–American War, there was an intensified arms race among the European nations, in particular between the United Kingdom and Germany (Eloranta Reference Eloranta2007). This created additional military tensions throughout Europe. Second, Italy felt economic consequences (the increase in commodity prices) and military consequences (the potential front against the United Kingdom) from this war, even without an active participation.
Belgium was never involved in any military conflict in the pre-WWI period. Nevertheless, it could have had spillover effects from war (threat) abroad, which is through a decrease in trade opportunities or through an invasion, given their geographical location. In fact, an increase in military threat was a real concern for the Belgian government. The Economist reported on 16 November 1912:
…The Ministerial declaration, which is decidedly pessimistic as regards the prospects of peace in Europe, points out that all the Powers guaranteeing Belgian neutrality may possibly be belligerents at once … Belgium, therefore, is proposing to defend her own neutrality solely by her own troops…
The changing political landscape intensified the military threat in Europe.Footnote 15 Belgium, and other nations, could easily experience a negative fallout of heightened military threat without active involvement. This highlights the importance of search-based war risk measures to understand managerial and investor behavior.
WAR RISK MEASURES
I use The Economist as the information source to examine the effect of war news on companies and investors on the BSE. In fact, I do not require that investors read the magazine, rather that The Economist is a proxy of European war news coverage. First, Galtung and Holmboe Ruge (Reference Galtung and Ruge1965) show that, if foreign news is both unique and close by, the likelihood of it being picked up by (domestic) news outlets is higher. Since military conflicts were both unique and close to the United Kingdom, and with a major European war looming, this hypothesis is reasonable. Second, Sussman and Yishay (Reference Sussman and Yafeh1998) document that the London Times wrote at least 150 articles on Japan’s internal (military) instability between 1870 and 1914. This indicates that these issues were being published in general British media.
The preference for the magazine is threefold. First, The Economist had its focus on stock markets. Other news outlets could miss events they did not deem important for their readership. Second, The Economist allows me to use one glossary to construct Threat or Act. To capture the same information among countries, I otherwise needed to combine multiple news sources and languages. This introduces measurement error due to varying quality in the level of journalism, different word lists, and editorial choices. Finally, The Economist is a weekly magazine. Since there was a sizeable amount of news produced each day, I infer that an item had to be more important to end up in a weekly magazine compared to daily newspapers. Focusing on daily news potentially introduces noise, while The Economist overcomes these shortcomings.
Textual Analysis
From January 1885 until July 1914, The Economist published 100,803 articles. I focus on three sections, News, Business News, and Opinion and Editorial, which cover around 67.52 percent of articles in that time period. I exclude all articles from the sections Financial and Commercial Tables and Company Meeting Reports and Statements. The sections mainly consist of tables, which did not contain any information on potential military conflicts. Including those articles would decrease the signal-to-noise ratio of the war risk measures. Therefore, I run a textual analysis on 68,064 articles.
All relevant articles must mention a combination of search words military and war and at least one of 12 words about potential conflicts (Threat) and the start of war (Act). To capture Threat, I search for those articles that mention either risk, fear, concern, uncertain, threat, or tension (or derivatives of these terms). To capture Act, I search for the key terms invasion, army, start, beginning, battle, and outbreak (or derivatives of these terms). I excluded the articles that contained search words from both categories. Hence, Threat only captures articles without the search terms of Act, and vice versa. The main reason for this procedure is measurement error. If one allows both terms in one article, the interpretation of Threat or Act fades away.
An additional requirement is that all relevant articles must also mention at least one country that either was an important trading partner for Belgium or had at least 5 percent of average weight of foreign stock listings on the BSE. In particular, I focus on Belgium, France, Germany, Italy, Russia, Spain, the Netherlands, and the United Kingdom (or articles that only include the capital). The rationale is that, since Belgium was an open economy, the countries arguably have had the biggest impact on the BSE.
Each issue, I sum up the article frequency to obtain a monthly count. Hence, Threat and Act are end-of-month metrics. To control for the amount of news that was being produced, this frequency is divided by the number of issues per month, in the spirit of Mathy and Ziebarth (Reference Mathy and Ziebarth2017). The metrics are multiplied by 100 and logged, as in Brogaard and Detzel (Reference Brogaard and Detzel2012):
 $${Z_t} = {\rm{ln}}\left( {100 \times {{number\;of\;war\;related\;article{s_t}} \over {number\;of\;magazine\;issue{s_t}}}} \right),$$
Where Zt is Threat or Act in month t. The number of issues varies between three and five.
Due to the large amount of high-frequency movements, I smooth the risk measures with a Savitzky and Golay filter, in the spirit of Mathy and Ziebarth (Reference Mathy and Ziebarth2017). The technique fits a subset of data points with a lower degree polynomial through linear least squares. This decreases the noise without distorting the signal. I plot the two measures in Figure 1, together with the most important European wars (cf. Table A1). The Act measure clearly increases at the outbreak of a conflict, as one would expect. In turn, the Threat measure increases before a conflict. More importantly, Figure 1 suggests that there is a lot of independent variation between the war risk measures.
THREAT versus ACT

The measurement of Act is important to quantify the magnitude of a certain event. If one uses a dummy variable, all events have equal significance. However, when a war breaks out, one does not know how long this conflict will last. Since the words battle, invasion, or army can still be used after the onset of a war, there is much variability in Act, even after the outbreak of the war. Furthermore, it is possible that multiple conflicts happened at the same time. A continuous measure of Act, therefore, would be an improvement over a binary dummy variable or an event study (Caldara and Iacoviello Reference Caldara and Iacoviello2018).
Search Words
The search words are selected from the combination of three sources. First, through a human reading of The Economist, I derive the lexicon from The Economist (cf. Table A2). Second, I search for the most popular words in two books on WWI (cf. Table A3). Third, I follow a similar method as in Caldara and Iacoviello (Reference Caldara and Iacoviello2018). The most important feature of these search terms is that they were predominately used, and associated with, an increase in risk of war. To ensure that I only select those articles that use the key terms in this fashion and report on potential conflicts or the outbreak of war, rather than the aftermath of a past war, I use a two-step approach. First, a textual analysis reduces the number of articles that only mention war and military to 9,879. Second, and more importantly, I increase the signal in the measures by focusing on the combination of words—that is, each article has to have at least three key terms (war/military, one of 12 search terms, and a country).
These articles are subjected to a thorough audit study, since using news-based measures raises several issues about their accuracy and potential biases. The most important leg of the audit study is a human reading of these relevant articles. This is necessary since I only want to incorporate the articles that discussed potential threats of war and the outbreak of a military conflict, rather than a discussion of the aftermath of war. Including the latter biases the measures. After a thorough human reading, I limit the number of articles in the measures to 2,249. The most frequent reasons for the exclusion are a discussion of the aftermath of wars (67.03 percent) or that these articles did not discuss an increase in potential military conflicts (21.87 percent).
In the second leg of the audit study, I randomly select 10 articles each month among all articles that contain military or war and, more importantly, that have not been used in the final calculation of Threat or Act (Baker, Bloom, and Davis Reference Baker, Bloom and Davis2015). This is appealing since I do not want to construct a measure that excludes important articles with a different glossary. This is a robustness check of the search words used in the measurement of Threat and Act. With this procedure, I include 74 additional articles. Hence, the entire sample totaled 2,385 articles, which is 2.36 percent of all the articles in The Economist (or 3.50 percent of articles in the three selected sections).
Data Summary
In Panel A of Table 1, I report the summary statistics of Threat and Act. The average level (4.05 in both measures) and variation of Threat (0.66) and Act (0.63) are relatively similar. Nevertheless, the correlation between the measures is relatively low (0.26). This indicates there is a non-trivial amount of independence between Threat and Act. This independence is important in regression analyses to control for Act when I study the effects of Threat, and vice versa. In addition, the persistence of Threat and Act is relatively low (around 0.20). This shows that The Economist did not write about war constantly, which was the case for other outlets (Ferguson Reference Ferguson1998). This provides additional evidence on the usefulness of these measures in this framework.
THREAT AND ACT

* = Significant at the 10 percent level.
** = Significant at the 5 percent level.
*** = Significant at the 1 percent level.
Notes: Table 1 reports the summary statistics of Threat and Act. Panel A reports the mean and standard deviation (Std. Dev.), minimum and maximum values, and the correlation between the variables. Panel B reports the coefficients from an AR(4) model with lagged market excess returns ( ${r_{t - 1}}$) to isolate stock market innovations. Panel C reports the coefficients from the logit regression
 $Conflic{t_t} = \alpha + \;{\beta _1}{Z_{t - h}} + {\varepsilon _{t + h}}$, where Conflict is the onset of the military conflict (all defined in Online Appendix Table A1), Z is Threat or Act, and h is the time horizon. AR² is the adjusted R-squared. All regressions include a constant (not reported).
Source: The Economist.
DISASTER PREDICTABILITY
The assumption that The Economist is a good proxy for European war news coverage is essential in this paper. An approach to test this formally is to focus on two questions. First, “Is Threat a predictor for actual future military conflicts?” Second, “Does Act only capture the outbreak of war contemporaneously?” To answer these questions, I use a logit regression,
 $$Conflic{t_t} = \alpha + \;{\beta _1}{Z_{t - h}} + {\varepsilon _{t + h}},$$
where
 $$Conflic{t_t} = \left\{ {\matrix{1 & {if\;a\;military\;conflict\;starts} \cr 0 & {otherwise} \cr } } \right.{\rm{and}}\,\,\,\,{Z_{t - h}}\,{\rm{is}}\,Threat\,or\,Act\,{\rm{in}}\,{\rm{month}}\,t - h.$$
The results are reported in Panel C of Table 1. First, I document a positive statistically significant relationship between Threat and military conflicts. The regression coefficients varied from 2.48 (five-month lag) to 4.04 (one-month lag). The t-statistics for all lags remained statistically significant at the 1 percent confidence level. This indicates that an increase in Threat translated into a higher probability of war. The contemporaneous relationship between Threat and actual military conflicts remained positive but lost its significance. This confirms the observation that Threat decreases when the conflict materializes. Overall, this result is intuitive since the threat of war is significantly lower when war actually breaks out.
Second, I document a strong contemporaneous relationship between Act and military conflicts. This suggests that the war risk metric is good at picking up actual events. In addition, only one lag of Act is positively significant in the logit regression. Since Act is measured at the end of the month, it is possible that events happened after the final publication of The Economist in that month and, hence, were written about in the following issue.
In sum, the evidence indicates that the level of Threat increases before actual events. The level of Act, on the other hand, only captures the outbreak of military conflicts. This justifies the use of the war risk measures in this framework. More importantly, this indicates that economic agents on the BSE were not required to read The Economist, since it captures the overall European war sentiment well.
DATA
In this paper, I study whether companies and investors responded to an increase in war risk. To answer these questions, I rely on the database StudieCentrum voor Onderneming en Beurs of the University of Antwerp. This database contains complete information on every stock ever listed on the BSE, for instance, the end-of-month prices, number of shares outstanding, high-quality dividend data (e.g., ex-dividend day and the amount of dividends paid), and capital operations (e.g., stock splits). This is important since dividends made up a large part of realized stock returns. Moreover, it enables me to create highly reliable value-weighted indices. Since the official archives of the BSE are the main source, the database is not subject to severe data flaws such as survivorship bias or incomprehensive or inconsistent data.
Scope
In this article, I focus on Belgian and foreign stocks listed on the BSE. The Belgian stocks are Belgian companies with their main economic activity located in Belgium. In turn, foreign stocks are foreign companies with their economic activities abroad and Belgian companies with their activity exclusively abroad. I use data on France, Germany, Italy, Russia, Spain, and the Netherlands, which are the countries I focus on in the construction of the risk measures. Due to data availability, I exclude British stocks.
I plot the evolution of the number of stock listings in Figure 2. Apart from Germany and the Netherlands, the figure shows a positive trend in the number stock listings from the other foreign countries. One explanation, apart from the attractiveness of Brussels as a financial center, is that Belgium was a neutral country in military conflicts before WWI. For instance, after the creation of the Triple Alliance, the number of Italian stock listings decreased substantially on French stock exchanges (Annaert, Buelens, and De Ceuster Reference Annaert, Buelens and De Ceuster2012). In turn, this number more than tripled over the course of 20 years on the BSE. Moreover, Russian foreign investments were considered to be of strategic importance against Germany. The inflow of Russian capital to Belgium was arguably less of an issue relative to other countries (Annaert, Buelens, and Cuyvers Reference Annaert, Buelens and Cuyvers2018). In 1914, the market capitalization of all Belgian stocks on the BSE totaled 4.09 billion BEF relative to the market capitalization for Russia (1.56 billion BEF), France (1.25 billion BEF), Germany (0.77 billion BEF), and Spain (0.70 billion BEF).
EVOLUTION OF STOCK LISTINGS
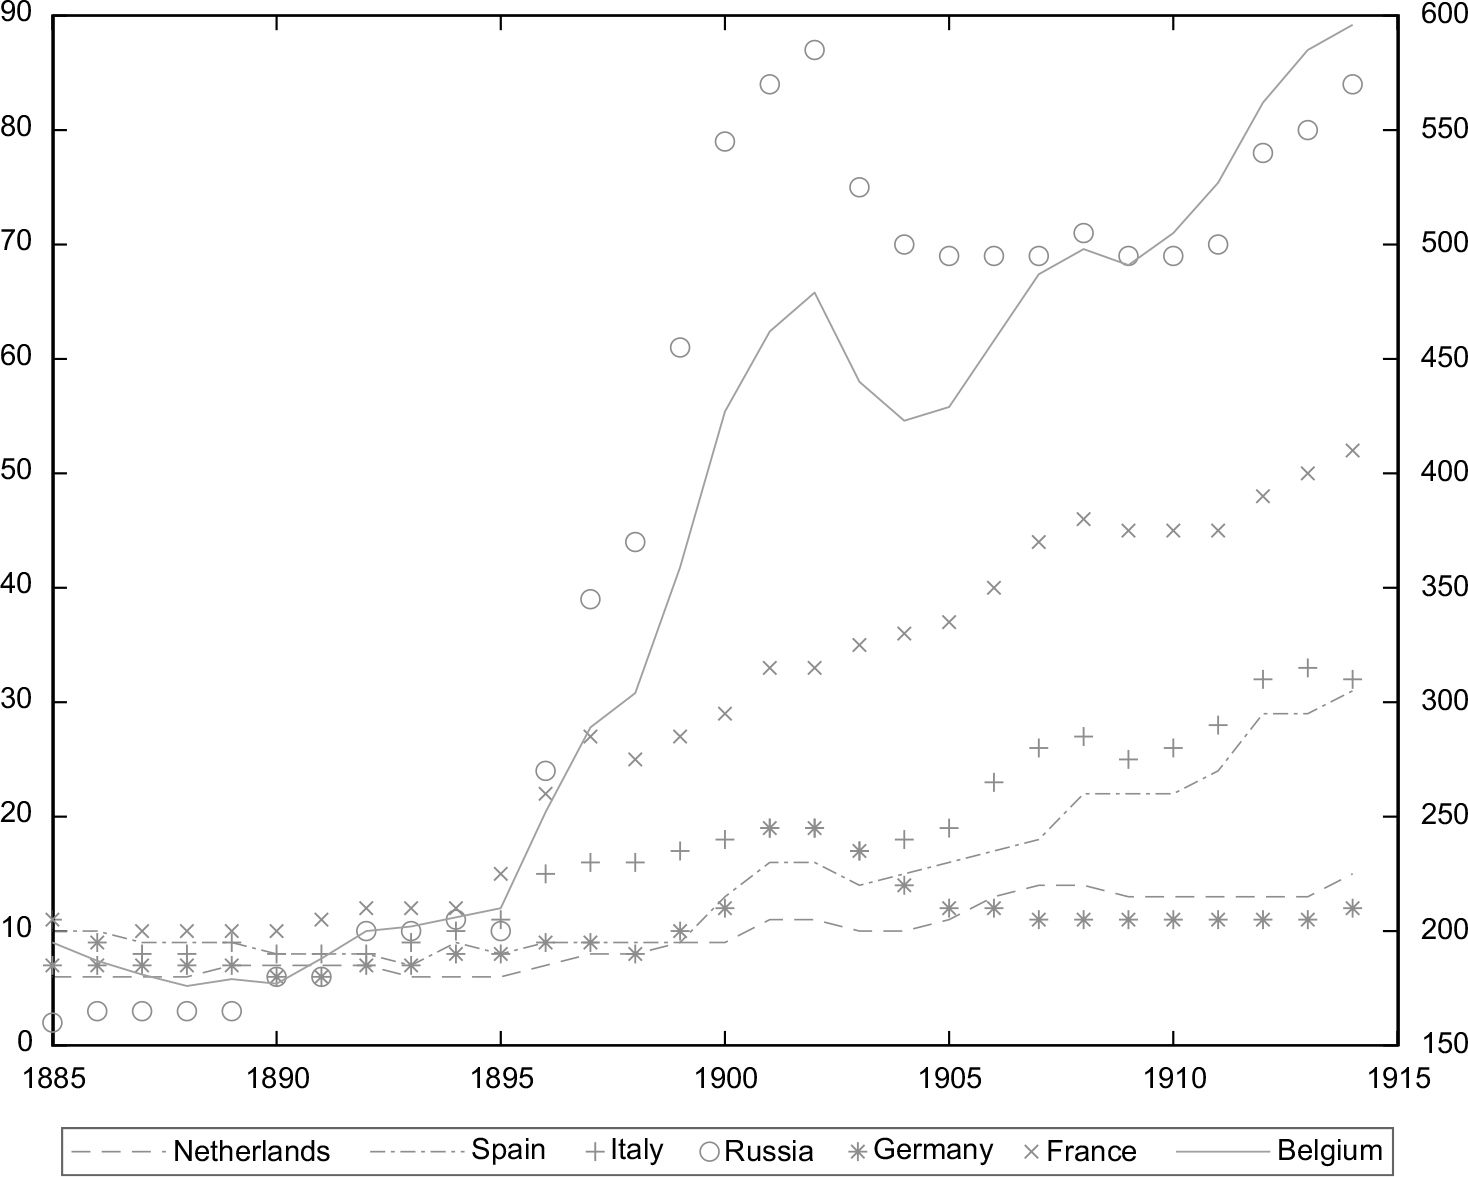
The international character of the BSE was the most pronounced before WWI (e.g., Van Nieuwerburgh, Buelens, and Cuyvers Reference Van Nieuwerburgh, Buelens and Cuyvers2006). If we put the numbers in perspective, foreign stock listings from these countries (divided by all stock listings on the BSE) increased from 15 percent in 1885 to 20 percent before the onset of WWI. In 1913, there were 235 foreign stock listings from the six countries of interest on the BSE. In turn, there were only 155 total foreign stock listings in Amsterdam, 34 listings in Berlin, 21 listings in Paris, and 6 listings in New York (Moore Reference Moore2012). According to Moore (Reference Moore2012), Brussels was second to London in terms of foreign stock listings.
Managerial Behavior
There are many decisions a manager can make that have impact on investors. In this paper, I focus on dividend policy, the timing of equity and bond IPOs, and stock delistings. Due to data limitations, I cannot include other decisions such as leverage and cash holdings.
Dividend Growth
I compute dividend growth as the 12-month trailing sum of dividends, which excludes seasonality in dividend payments. I divide the sum of dividends by last year’s sum. Following Verdickt, Annaert, and Deloof (Reference Verdickt, Annaert and Deloof2019), I do not reinvest dividends received within a year since this clouds dividend growth rates with a sizeable return component. Monthly dividend growth is calculated as
 $$d{g_t} = \;\ln \left[ {{{D_t^{12}} \over {D_{t - 1}^{12}}}} \right]$$
where  $D_t^{12}$ is a 12-month trailing sum of dividends in month t. Dividends are denominated in local currencies. I do not convert dividends to Francs due to limited exchange rate variation (Eichengreen and Flandreau Reference Eichengreen and Flandreau1994).
I report the summary statistics in Table 2. Average value-weighted dividend growth rates vary from 1.3 percent for Spain to 2.5 percent for Germany. The difference between dividend growth volatilities is remarkably high—8.6 percent for France and 22.4 percent for Germany. Nevertheless, the values are similar to other time periods and countries (Verdickt, Annaert, and Deloof Reference Verdickt, Annaert and Deloof2019). More than 50 percent of firms distributed dividends, which is comparable to post-WWI evidence (e.g., Moortgat, Annaert, and Deloof Reference Moortgat, Annaert and Deloof2017).
SUMMARY STATISTICS
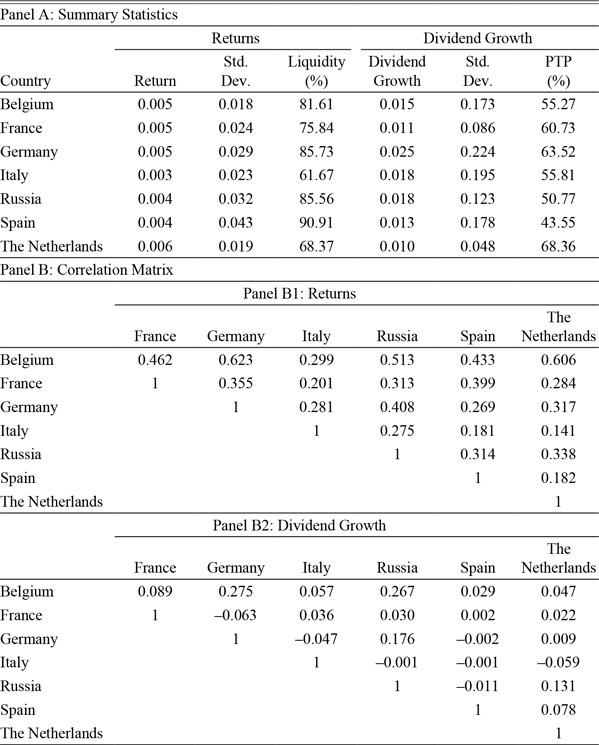
Notes: Table 2 reports summary statistics for all value-weighted country indices. I report the monthly log total excess return and its standard deviation (Std. Dev.), dividend growth and its standard deviation (Std. Dev.), and dividend yield and propensity to pay (PTP). Dividend growth is calculated as the log of the 12-month trailing sum of dividends in month t divided by the trailing sum of dividends in month t of the previous year. Liquidity is calculated as the value-weighted average of (1 –  ${{number\;of\;months\;with\;a\;zero\;return} \over {number\;of\;months\;in\;which\;asset\;i\;was\;listed}}$) in any year. The PTP is the average percentage of dividend paying stocks in the total country sample. In Panel B, I report the correlation among excess market returns (Panel B1) and dividend growth rates (Panel B2).
Results are based on the period January 1885–July 1914.
Source: SCOB.
Stock Delistings
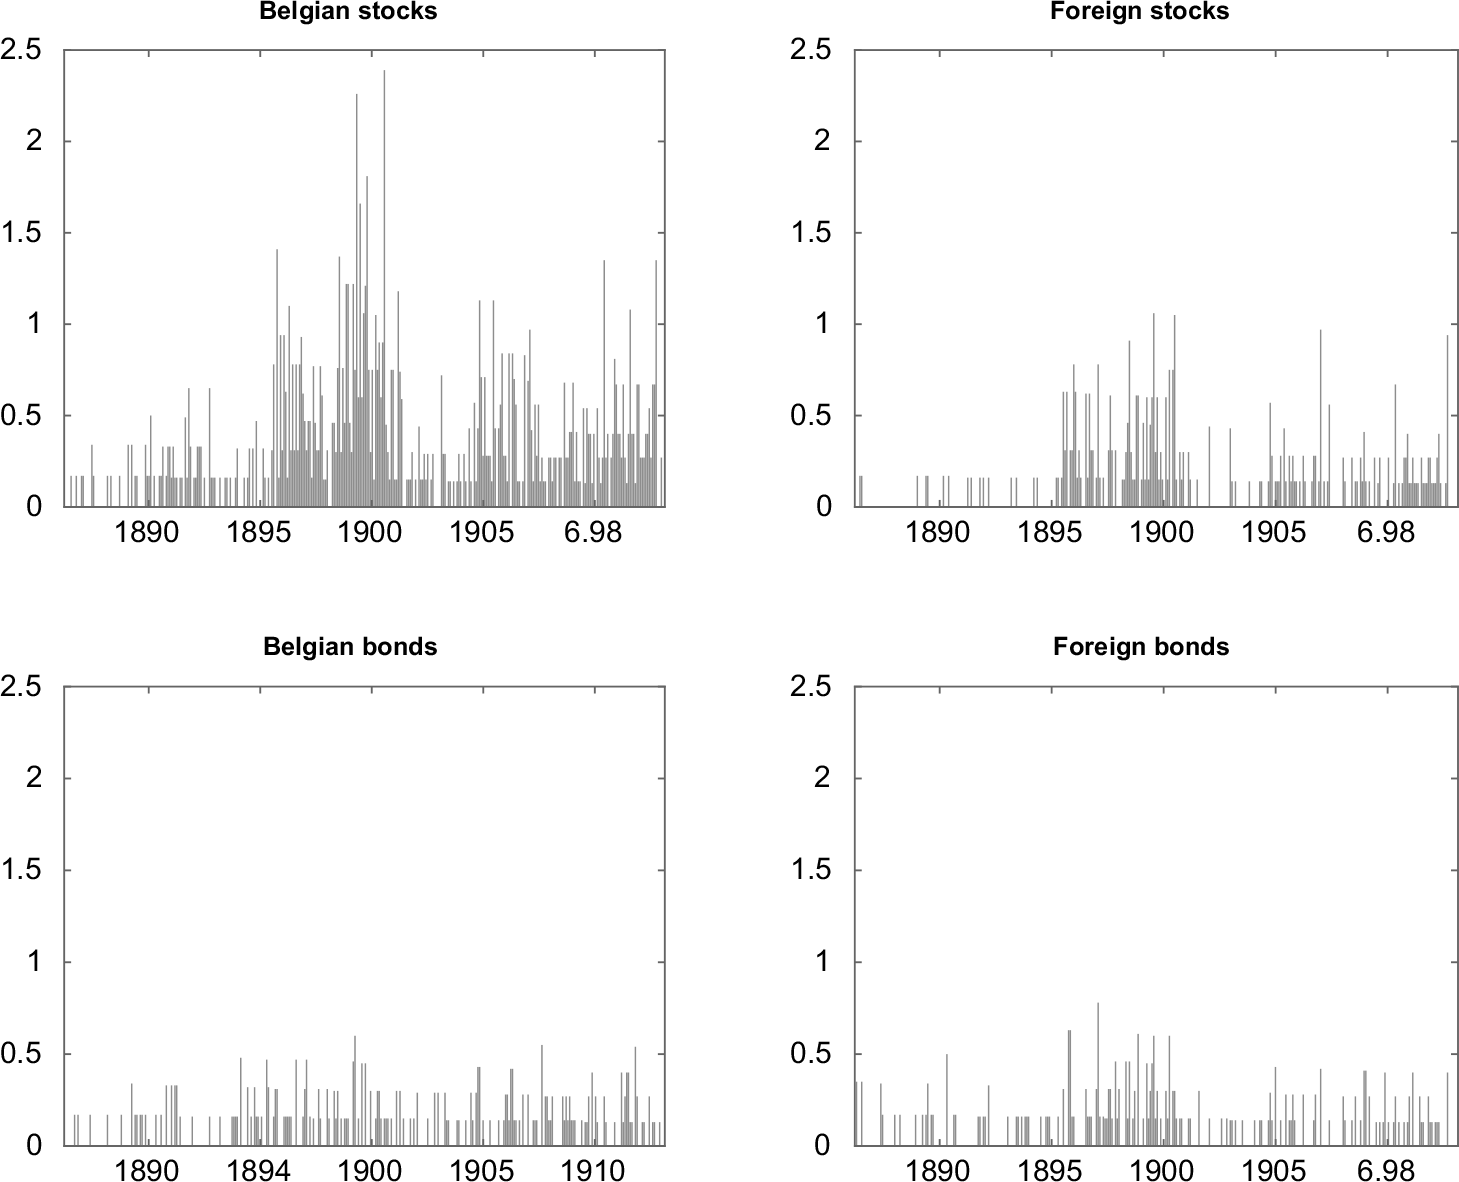
I define an IPO as the first appearance of a company in the archives of the BSE. If the company already issued a stock on the BSE, I only focus on its first listing. To the best of my knowledge, the IPOs were from companies that raised capital on the BSE.Footnote 16 Nevertheless, in times when war risk was high, requesting the additional listing was arguably not the most appealing decision for joint-stock companies either.Footnote 17 To circumvent this issue, I introduce data on bond IPOs since the securities were used to raise capital directly from investors. I include firms that re-issued bonds after bond maturity. This provides the comprehensive measure of IPOs. The evolution of domestic and foreign equity and bond IPOs is provided in Figure 3. During the course of the sample period, there were, respectively, 435 and 239 Belgian stock and bond IPOs (Panel A), or 303 and 206 foreign stock bond IPOs (Panel B).
EVOLUTION OF IPOs
There are two drawbacks to this approach. First, there is little information on the duration of the IPO process. In the recent period, a listing takes about 12 months, on average. Since there was less regulation in the 1885–1914 period, I assume that it takes around five months. Second, there are no data on withdrawn IPOs. I am not able to capture those offerings that were initiated but were eventually canceled, potentially due to the threat or act of war. To circumvent this issue, I introduce data on stock delistings. I define a delisting as the complete disappearance of a stock from the BSE for the remaining sample period. If a stock has missing observations or is excluded due to illiquidity, I do not consider this a stock delisting. In general, it is plausible that foreign firms delisted due to war. For instance, firms could be subject to hostile foreign takeovers (Gerlach and Yook Reference Gerlach and Yook2016) or foreign governments could refuse cross-listings, since this potentially provided information on their military expansions. Hence, I limit the sample to foreign stocks. I plot the evolution of stock delistings in Figure 4. In total, there were 159 stock delistings. More than half of the delistings occurred in the post-1900 period, when Threat and Act increased substantially.
EVOLUTION OF FOREIGN STOCK DELISTINGS

Investor Behavior
As a proxy for investor behavior, I use common stock returns listed on the spot market. I ignore instruments with mixed characteristics, such as founder’s stocks, preferred stocks, and bonus stocks. In the pre-WWI period, the spot market had a wider coverage than the forward market because stocks listed on the forward market had to be listed on the spot market but not vice versa. Therefore, I limit the sample to stocks on the spot market. I use monthly excess returns:
 $${r_t} = \;\ln \left[ {{{{P_t} + {D_t}} \over {{P_{t - 1}}}}} \right] - r{f_t},$$
where Pt is the stock price, Dt represents dividends, and rft is the commercial paper rate at the end of month t. The stock prices are denominated in BEF. I use monthly excess returns to focus on the risk premium of the stock market on top of the risk-free rate.
I report the summary statistics in Table 2. The monthly average value-weighted returns vary around 0.3 percent and 0.6 percent, equal to an annual return of 3.6 percent and 7.4 percent. The correlation between countries varies between 0.18 and 0.62. This is preliminary evidence that data pooling is allowed. Moreover, the correlation for stocks is higher than the correlation of dividend growth, which is comparable to previous papers. This indicates that, if war broke out in a country, other stock prices were also affected (even without an active participation). This hints that war is a systematic risk. In addition, I document that stock liquidity is relatively high (approximately 80 percent of the value-weighted market was traded) across countries. In comparison, Campbell, Turner, and Ye (Reference Campbell, Turner and Ye2018) show that the average liquidity of the London Stock Exchange in the 1825–1870 period equaled only 46.7 percent.
DIVIDEND POLICY
The first question in this article is how managers react to a change in war news. In the pre-WWI period, dividends were used as an important information channel to assess the quality of a firm (Turner, Ye, and Zhan Reference Turner, Ye and Zhan2013; Braggion and Moore Reference Braggion and Moore2011; Campbell and Turner Reference Campbell and Turner2011). Therefore, it is useful to see how companies mitigated war risk through their dividend policy.
Methodology
To measure the extent to which war risk affects dividend growth, I run a pooled regression,
 $$dg_t^i = {\alpha ^i} + {\beta _1}{Z_t} + {\beta _2}Z_t^\varepsilon + \gamma X_t^i + \varepsilon _t^i,$$
for i = 1,…, N countries, where  $dg_t^i$ is the monthly value-weighted log dividend growth in month t, Zt is Threat and Act in period t, and X represents control variables: relative risk-free rate, term spread, dividend yield, and an election dummy. I define the control variables in the Online Appendix. I add
 $\;Z_t^\varepsilon $, which is the residual from the regression
 $Ac{t_t} = \alpha + {\beta _1}Threa{t_t} + {\varepsilon _t}$, to isolate news in Act that is not yet captured by Threat. By design, this variable is orthogonal to other risk metrics, which do not introduce multicollinearity issues. I adjust the standard errors for heteroscedasticity, cross-sectional correlations, autocorrelations, and a moving-average structure created through the use of overlapping returns (Ang and Bekaert Reference Ang and Bekaert2007).
Pooled regressions provide unbiased and consistent parameter estimates. Moreover, they enhance efficiency for dividend growth predictability regressions (Ang and Bekaert Reference Ang and Bekaert2007) and dominate other approaches in terms of bias-variance trade-off (Hjalmarsson Reference Hjalmarsson2010). In light of this paper, the advantage of pooled regression over event studies is that I do not have to take a stance on the event dates, ex ante (historical simplification). Through the use of pooled regression, I included those military threats that did not materialize into a conflict. A drawback of pooled regressions is that it imposes the restriction that β 1 is equal across countries. However, the estimates still pick up the average effects if this restriction does not hold (Hjalmarsson Reference Hjalmarsson2010). To capture unobserved heterogeneity between countries and sectors, I use a panel regression in a second specification.
In Table 3, I show that Act has significant negative effects on dividend growth rates. The decrease in dividend growth across countries is equal to 14 percent, when we control for economic and political uncertainty and business cycle variation. In turn, Threat is only significant in the first regression specification. When I control for other factors, the effect vanishes. The findings suggest that firms only adjusted their dividend policies in times of war, rather than when military threat increased. Even when I control for sector effects, the qualitative conclusions hold. Only when news was bad were companies willing to take (or forced to take) drastic actions. This reconciles with the previous literature (e.g., Braggion and Moore Reference Braggion and Moore2011; Turner, Ye, and Zhan Reference Turner, Ye and Zhan2013). Van de Velde (Reference Van de Velde1943) notes that dividend growth rates often fluctuated more than stock returns on the BSE. I document that news about the outbreak of war was one of the explanations for the variability of the dividend growth rates.
DIVIDEND POLICY

* = Significant at the 10 percent level.
** = Significant at the 5 percent level.
*** = Significant at the 1 percent level.
Notes: Table 3 presents the results from Equations (5) and (6). Panel A reports the contemporaneous relationship with dividend growth, Panel B reports the longevity of the relationship on dividend growth, and Panel C reports the predictive regressions with dividend growth rate. In Panel A, regression specifications 1–3 or 5–7 are pooled regressions, where the regression coefficients are produced by constraining the predictive coefficients to be the same across countries. Regression specifications 4 and 8 use a panel regression with country and sector fixed effects to capture unobserved heterogeneity across sectors and countries. The independent variable is Zt, which denotes Threat and Act;  $Z_t^\varepsilon $ is the residual from the regression
 $Threa{t_t} = \alpha + {\beta _1}Ac{t_t} + {\varepsilon _t}$ in Act and vice versa; the term spread is the difference between the Belgian long-term government bond and commercial paper yield; and the dividend yield is the smoothed dividend yield of country j and election year, which is a dummy that yields one 12 months before a legislative election in country j. T-statistics are in parentheses and are computed using Ang and Bekaert’s (Reference Ang and Bekaert2007) seemingly unrelated regression standard errors for pooled regressions or computed with standard errors clustered by country and sectors for panel data regressions. AR² is the adjusted R-squared. I focus on dividend growth rates for Belgium, France, Germany, Italy, Russia, Spain, and the Netherlands. All regressions include a constant (not reported). Results are based on the period January 1885–July 1914.
Sources: SCOB and The Economist.
Discussion
To better understand the negative effect of Act on dividend growth, I run two additional tests. First, I examine the longevity of the evidence with an autoregressive distributed lag model. I extend the simple one-lag model to one with three lags; that is,
 $$dg_t^i = {\alpha ^i} + {\beta _1}{Z_t} + {\beta _2}{Z_{t - 1}} + {\beta _{3\;}}{Z_{t - 2}} + {\beta _{4\;}}{Z_{t - 3}} + \varepsilon _t^i$$
for i = 1, …, N countries, where  $dg_t^i$
is the monthly value-weighted log dividend growth rate in month t and Zt is Threat or Act.
In Panel B of Table 3, I document the lack of a long-run relationship between Act and dividend growth. The result suggests that companies only cut dividends at the outbreak of wars. Since past information did not affect dividend policy decisions, this indicates that firms did not anticipate potential conflicts. Overall, firms did not seem willing to take any risks in cutting dividends when the threat of war increased, arguably due to negative effects on their stock prices. Hence, this conclusion reconciles with the literature on signaling theories, which highlights the importance of dividends as a key information channel for investors (Braggion and Moore Reference Braggion and Moore2011; Turner, Ye, and Zhan Reference Turner, Ye and Zhan2013).
Second, I run predictive regressions to examine the relationship of the war measures with expected dividend growth rates. The regression specification becomes
 $$dg_{t,t + h}^i = {\alpha ^i} + {\beta _1}{Z_t} + {\beta _2}Z_t^\varepsilon + \gamma X_t^i + \varepsilon _{t + h}^i$$
for i = 1, …, N countries, where  $dg_{t,\;t + h}^i$ is the cumulative value-weighted log dividend growth rate during month t through t + h. All control variables are similar to Equation (5).
In Panel C of Table 3, I show that the increase in Act does not lead to negative dividend growth, up to 12 months ahead. Even when I control for economic and political factors, there is no predictive ability in Act on dividend growth rates. More importantly, this indicates that Act has a permanent effect on the dividend payout policy. If the impact were temporary, one would see an increase in average dividend growth rates after several months when more information was available. Since there is no increase, dividend growth rates did not revert to their normal level. This finding suggests that war leads to increased uncertainty, as suggested by Barro (Reference Barro2009).
The important question, however, is why companies were cutting dividends. Either the decrease in dividend growth is the consequence of the decrease in earnings (cash-flow explanation) or it is a precautionary measure (risk-aversion explanation). To test for the cash-flow explanation hypothesis, I introduce data on bankruptcy, earnings growth, and GDP growth (cf. Online Appendix). For instance, for a subsample of joint-stock companies, I run a panel regression with firm and year fixed effects.Footnote 18 I also examine the relationship between Act and the number of bankruptcies and Belgian GDP growth. In all these regressions, I find no evidence that the outbreak of war impacts cash flows systematically. Hence, I conclude that firms were more likely to cut dividends as a precautionary measure to mitigate war risk. There is some anecdotal evidence in support of this conclusion.Footnote 19
OTHER MANAGERIAL DECISIONS
In the previous section, I show that dividend cuts were primarily used as a precautionary measure. To confirm that this is not a spurious result, I study the effects of war news coverage on other managerial decisions such as timing of IPOs and stock delistings.
IPO Activity
The timing of IPOs is an example of a costly irredeemable decision. Previous literature shows that companies strategically time their IPOs (Çolak and Günay Reference Çolak and Günay2011; Çolak, Durnev, and Qian Reference Çolak, Durnev and Qian2017). However, there has been little attempt to study the impact of war on IPO activity. Therefore, I run the following regression:
 $$IPO_{t + 5}^i = {\alpha ^i} + {\beta _1}{Z_t} + {\beta _2}Z_t^\varepsilon + \gamma X_t^i + \varepsilon _{t + 5}^i,$$
where  $y_{t + 5}^i$ is the number of stock or bond IPOs per capita five months ahead. I add controls for total returns, the lagged number of IPOs, and a hot-IPO market dummy. The control variables are lagged to reduce potential endogeneity issues between IPO activity and other economic metrics.
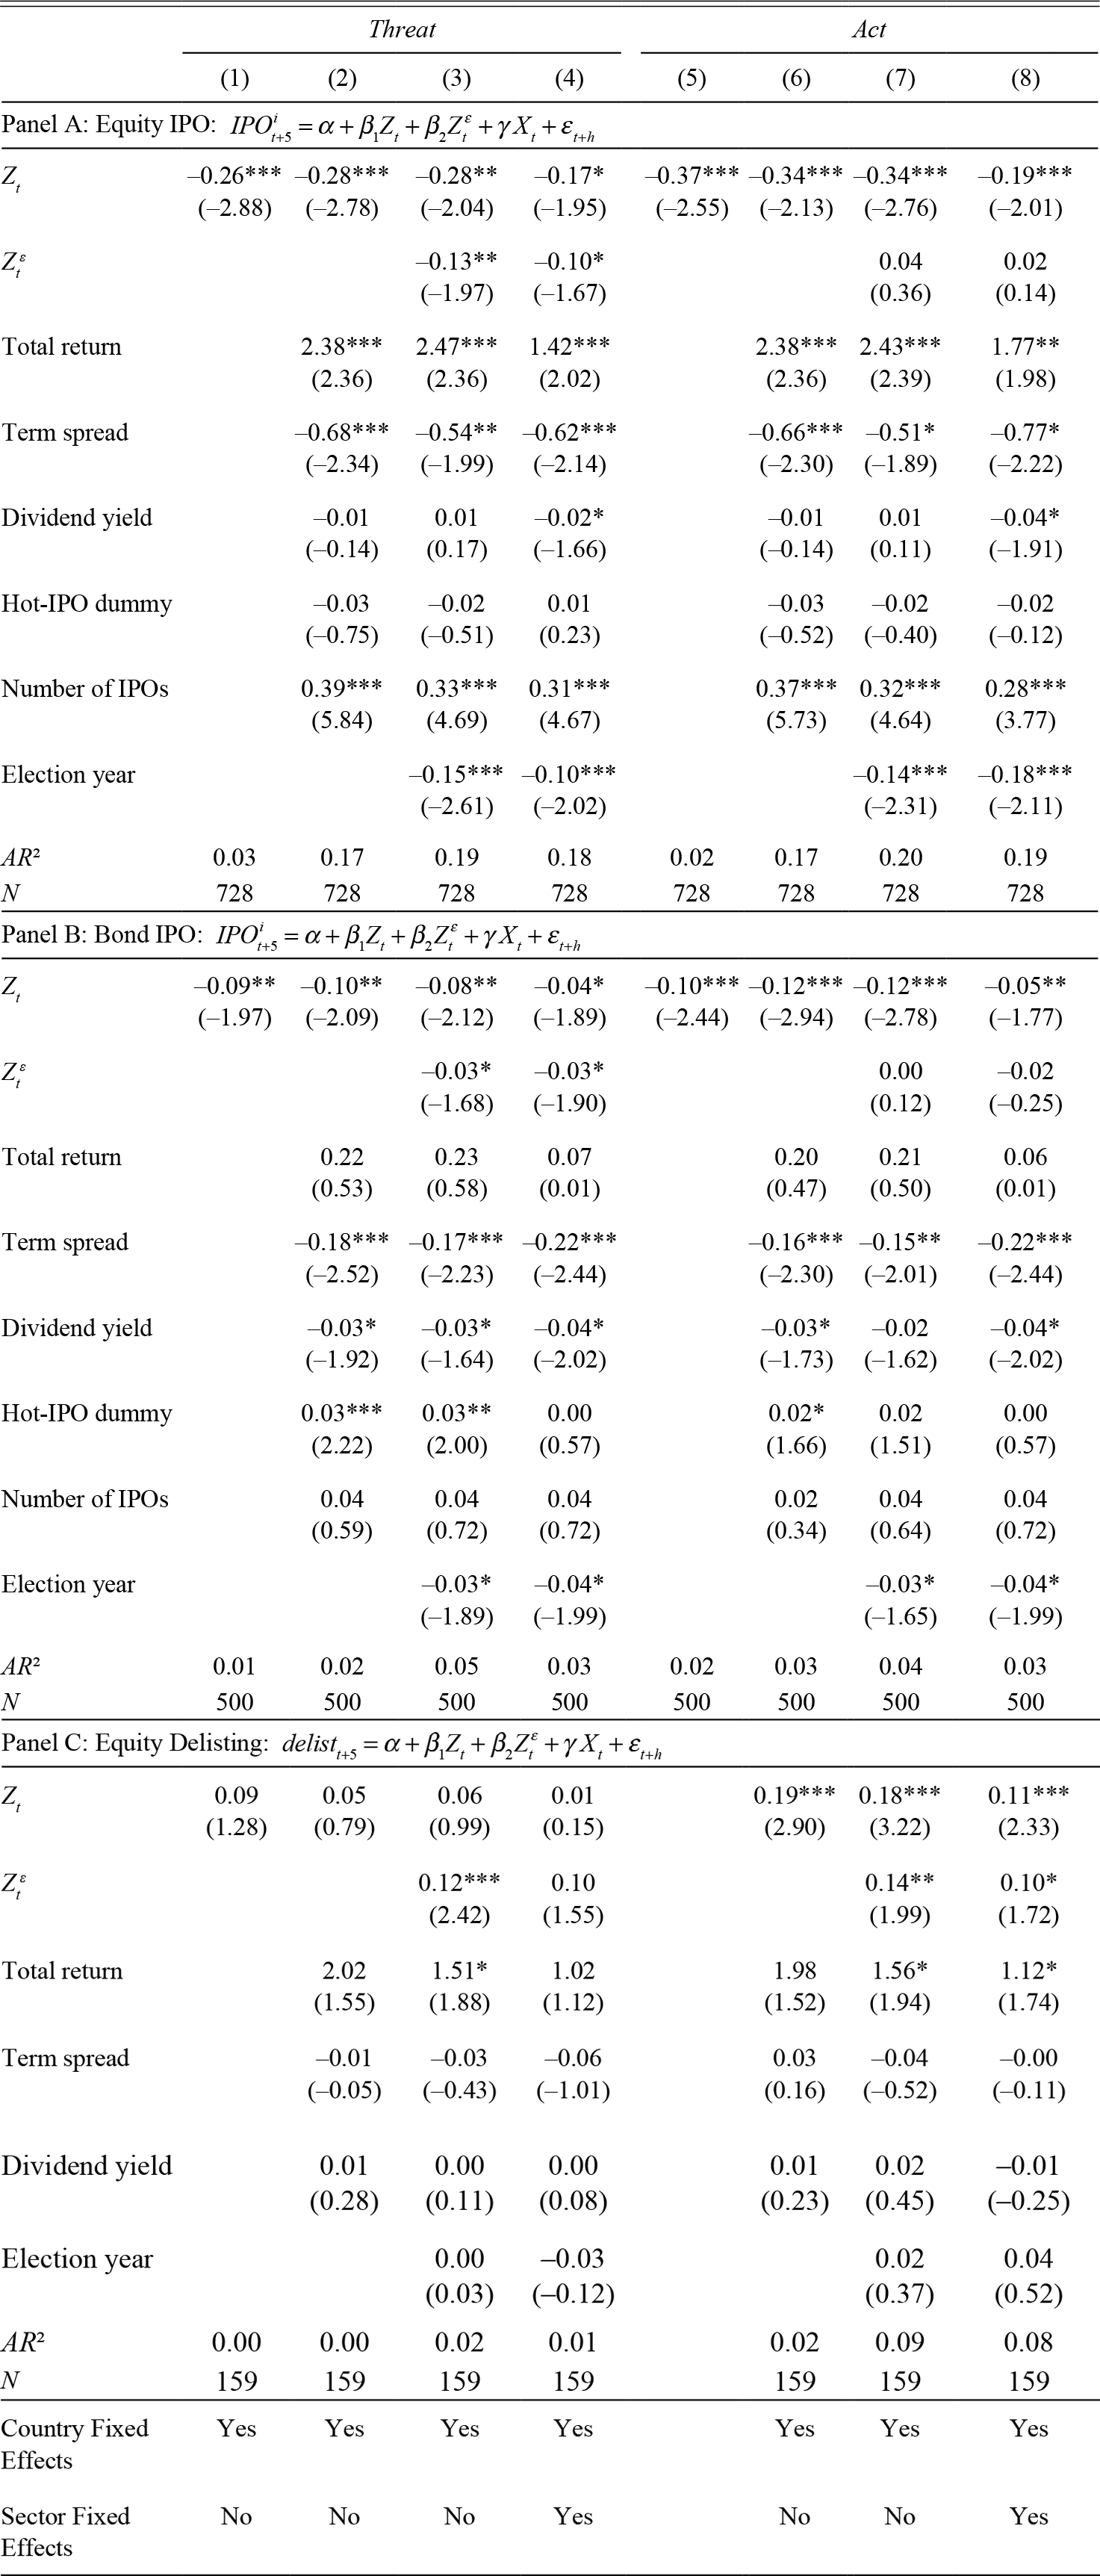
In Table 4, I show that, regardless of the regression specification, the war risk measures have a negative effect on listing activity. The number of scaled first stock listings is reduced by 0.34 following the increase in Threat. For bonds, the number of listings is reduced by 0.12 when Act increased. The disparity between securities is due to a lower number of bond IPOs on the BSE in the sample period. Overall, the findings indicate that firms mitigated war risk through the postponement of IPOs, for instance, through an increase in the manager’s risk aversion.Footnote 20 Since IPOs are expensive and often irreversible, it is rational for firms to pay attention to news on military threat and the start of war. Only when uncertainty surrounding war is resolved will managers most likely continue with the listing process. Moreover, this finding indicates that companies did not systematically take the opportunities that war offers, such as the production of weapons (i.e., Welter and Kim Reference Welter and Kim2018).
FIRM FINANCING DECISIONS
* = Significant at the 10 percent level.
** = Significant at the 5 percent level.
*** = Significant at the 1 percent level.
Notes: Table 4 presents the results from Equations (7) and (8). Panel A reports the number of equity IPOs per capita five months ahead, Panel B reports the number of bond IPOs per capita, and Panel C reports the number of foreign stock delistings five months ahead. Regression specifications 1–3 and 5–7 use a panel data regression with country fixed effects, and regression specifications 4 and 8 use a panel data regression with country and sector fixed effects. The independent variable is Zt, which denotes Threat and Act; $Z_t^\varepsilon $ is the residual from the regression $Threa{t_t} = \alpha + {\beta _1}Ac{t_t} + {\varepsilon _t}$ in Act and vice versa; term spread is the difference between the Belgian long-term government bond and commercial paper yield; dividend yield is the smoothed dividend yield of country j; there are a lagged number of IPOs on the exchange level; there are a lagged number of stock delistings on the exchange level; and election year is a dummy that yields one 12 months before a legislative election in country j. T-statistics are in parentheses, computed with standard errors clustered by country and industry. AR² is the adjusted R-squared. I use all stock and bond IPOs from Belgium, France, Germany, Italy, Russia, Spain, and the Netherlands (Panels A and B) and exclude Belgium for stock delistings (Panel C). All regressions include a constant (not reported). Results are based on the period January 1885–July 1914.
Source: SCOB.
For control variables, I document four interesting results. First, I find that the past performance of the market index positively influences the timing of equity IPOs. There is a positive relationship, which indicates that the higher past market returns make firms more likely to go public. There is no relationship between the market index and the timing of bond IPOs, which is not surprising. Past stock performance hardly affects the yield on corporate bonds. Second, I show that there are stock IPO cycles (Çolak, Durnev, and Qian Reference Çolak, Durnev and Qian2017). This suggests that firms are more likely to issue new stocks when more firms choose to issue them. However, I fail to find such a relationship for bonds. Momentum in bond IPO activity does not affect the likelihood that other firms issued new bonds. Third, I show that the term spread has a negative relationship with IPO activity, regardless of the underlying security. An increase in the term spread indicates that the expected future risk-free rate increases, which, in turn, leads to an increase in the cost of capital, and causes stock prices to decrease. Therefore, a negative relationship between term spread and IPO activity is expected. The evidence confirms previous results for the issue cycles of IPOs (Ivanov and Lewis Reference Ivanov and Lewis2008). Last, I find a strong negative relationship between political uncertainty and IPO activity, regardless of the security. This suggests that fewer companies go public when there is more political uncertainty, which confirms previous findings (Çolak, Durnev, and Qian Reference Çolak, Durnev and Qian2017).
Stock Delistings
The transmission mechanism through which war risks can affect the real economy is lower demand and trade opportunities, apart from the destruction of property. Firms that depend on trade, such as those with their main activity abroad, are more likely to go bankrupt. Moreover, foreign companies could become more vulnerable to takeovers, for instance, by the country they are at war with. To test this hypothesis, I run the regression
 $$delist_{t + 5}^i = {\alpha ^i} + {\beta _1}{Z_t} + {\beta _2}Z_t^\varepsilon + \gamma X_t^i + \varepsilon _{t + 5}^i,$$
where  $delist_{t + 5}^i$ is the number of stock delistings per capita five months ahead. I report the results in Panel C of Table 4.
The findings indicate that, regardless of the regression specification, an increase in Act has significant positive effect on the number of stock delistings. Managers are more likely to delist after the outbreak of war. In turn, Threat has no significant effect on the number of stock delistings. How do we reconcile this with previous results? The opportunity cost to wait for additional information on war is arguably small relative to the cost associated with stock delistings. Similar to dividend policy, companies postponed these drastic decisions only when news was really bad, such as the outbreak of war. This further strengthens the conclusion of precautionary controls.
Since a stock delisting is a costly and irreversible decision, it is not surprising that only the occurrence of a sizeable disaster has a significant impact. Since wars are associated with high uncertainty and welfare costs, the number of stock listings can decrease due to bankruptcy or negative outlook by companies. Furthermore, a stock delisting is a way to keep the company out of foreign hands. Gerlach and Yook (Reference Gerlach and Yook2016) document that, for a different sample period, foreigners buy more stocks on attack days than the days before. If the foreign companies on the BSE feared a hostile takeover, this could also explain why they would want to delist.
Discussion
There are many decisions a company could make that have an impact on stock markets. In this paper, I focused on dividend payout policy, financing decisions, and stock delistings. The evidence points in the same direction: Managers on the BSE became more risk averse after the onset of wars. One could formally test the war chest hypothesis by studying the effect of war news on cash holdings of joint-stock companies. Furthermore, there are other managerial decisions that are important, such as share repurchases and leverage choices. Although interesting, I am unable to explore these routes due to data limitations. Nevertheless, I already focus on three important firm decisions. In the Online Appendix, I provide (preliminary) evidence on the negative relationship between war news coverage and merger activity.
In the finance literature, there are many factors introduced that have an effect on managerial decisions. They can be sorted into three categories: stock market performance, economic environment, and political landscape. In the Online Appendix, I document that both Threat and Act are exogenous with respect to these factors. In fact, in a standardized regression, I find that the control variables (together with cross-sectional volatility and skewness) only explain 9 percent (22 percent) of the variation in Threat (Act). I, therefore, confirm the conclusion of Caldara and Iacoviello (Reference Caldara and Iacoviello2018) that war risk is an additional source of risk, on top of economic and political uncertainty.
INVESTOR BEHAVIOR
The second question in this paper is how investors reacted to a change in war news. Theory shows that stock returns are decomposed into changes of current and expected cash flows or expected returns (Brogaard and Detzel Reference Brogaard and Detzel2012). In the context of war, changes in expected returns are straightforward. Investors demand less compensation for stocks that provide a protection when war occurs. In turn, they become more risk averse and, therefore, increase the expected returns for stocks that do not offer such a protection. When uncertainty resolves, stock prices should revert to their mean. To test this hypothesis, I run the predictive regression
 $$r_{t,t + h}^i = {\alpha ^i} + {\beta _1}{Z_t} + {\beta _2}Z_t^\varepsilon + {\beta _3}dg_t^\varepsilon + \gamma X_t^i + \varepsilon _{t + h}^i$$
for i = 1, …, N countries, where  $r_{t,\;t + h}^i$ is a cumulative value-weighted log excess return during month t through t + h. All variables and control variables are similar to Equation (5). I report the results in Table 5.
EXPECTED RETURNS

* = Significant at the 10 percent level.
** = Significant at the 5 percent level.
*** = Significant at the 1 percent level.
Notes: Table 5 presents the results from Equations (6) and (9). Panel A reports the contemporaneous and predictive relationship with expected returns, and Panel B reports the longevity of the relationship for expected returns. Regression specifications 1–3 and 5–7 use a pooled regression, where the regression coefficients are produced by constraining the predictive coefficients to be the same across countries. Regression specifications 4 and 8 use a panel regression with country and sector fixed effects to capture unobserved heterogeneity across sectors and countries. The independent variable is Zt, which denotes Threat and Act; $Z_t^\varepsilon $ is the residual from the regression  $Threa{t_t} = {\rm{\alpha }} + {\beta _1}Ac{t_t} + {\varepsilon _t}$ in Act and vice versa;
 $dg_t^\varepsilon $ is the residual from the regression
 $d{g_t} = {\rm{\alpha }} + {\beta _1}{r_t} + {\varepsilon _t}$; term spread is the difference between the Belgian long-term government bond and commercial paper yields; relative risk-free rate is the difference between commercial paper yield and its 12-month moving average; dividend yield is the smoothed dividend yield of country j and election year, which is a dummy that yields one 12 months before a legislative election in country j. T-statistics in parentheses are computed using Ang and Bekaert’s (Reference Ang and Bekaert2007) seemingly unrelated regression standard errors for pooled regressions or computed with standard errors clustered by country and sectors for panel data regressions. AR² is the adjusted R-squared. I focus on stock returns from Belgium, France, Germany, Italy, Russia, Spain, and the Netherlands. All regressions include a constant (not reported). Results are based on the period January 1885–July 1914.
Sources: SCOB and The Economist.
Threat
I document a negative contemporaneous relationship between Threat and stock prices. If there is more news on potential military conflicts, stock prices drop by 7 percent. This effect is significant, even when I control for other economic, political, or business cycle measures, which confirms previous conclusions (Gerlach and Yook Reference Gerlach and Yook2016; Zussman, Zussman, and Nielsen Reference Zussman, Zussman and Nielsen2008). In a rational asset-pricing framework, the findings imply that investors sold their stocks due to an increase in war tension. In other words, investors increased their expected returns. Since there is no relationship with expected dividend growth rates, the stock price changes are predominately explained by changes in return expectations and current dividend growth. This positive relationship between expected returns and Threat is the fundamental prediction of rare disaster models (Berkman, Jacobsen, and Lee Reference Berkman, Jacobsen and Lee2011). This result is intuitive: When war threat increases, investors are more reluctant to buy stocks. They want additional compensation for these stocks (i.e., a higher expected return).
Similar to the longevity analysis for dividend growth, I extend the one-lag model to a four-lag model, to better understand the relationship between expected returns and Threat. In Panel B of Table 5, I document that only the first lag of Threat is significant (and positive). If a Threat is not followed by an Act, the contemporaneous decrease is followed by an increase in stock prices in the subsequent month. This is referred to as mean reversion. The initial underperformance in the coefficient is followed by a subsequent overperformance. Stock prices revert to their original level once new information is incorporated.Footnote 21 The stock market behaves relatively efficiently.
I complete the analysis by focusing on the forecasting ability of Threat on future excess returns (Panel A). The one month ahead return is positive and remains relatively constant afterward. This strengthens the evidence for mean reversion. When I control for sectors, I find a similar result. This indicates that the average effect is constant over industries, which echoes the conclusions of Le Bris (Reference Le Bris2012) that there is no real difference between military or non-military sectors. When I focus on three sectors, I confirm this finding (cf. Table A10).
Act
Similar to Threat, I find a negative contemporaneous relationship between Act and excess returns. This effect is significant at the 1 percent level and, more importantly, is robust after controlling for other variables. There are two reasons why the impact on stock prices is larger for Act than Threat. First, the start of war is accompanied by uncertainty (Barro Reference Barro2009). Second, and more importantly, the contemporaneous dividend growth rates decrease when Act increases (not when Threat increases). Since stock returns can be decomposed into current dividends, expected dividend growth, and returns, the magnitude of Act is, by design, larger than for the Threat of war. The findings are in line with the previous evidence. For instance, Sussman and Yafeh (Reference Sussman and Yafeh1998) find that expected returns on Japanese stocks increased at the start of the Sino-Japanese War (1894/95) and Russo-Japanese War (1904/05). In comparison, I document that Russian stock prices declined at the outbreak of war in my sample period (which also includes the Russo-Japanese War and the Russian Revolution of 1905).
When I focus on the predictive abilities of Act on expected returns, I document that there is a strong negative relationship. This indicates that investors demanded higher risk premia after the outbreak of war. In line with the previous section, industry effects do not influence the qualitative conclusions. If investors were irrational, the evidence suggests that they would exhibit excessive pessimism as a consequence of war news. Given the higher uncertainty and information asymmetry surrounding wars, it is reasonable to assume that investors were not irrational (Barro Reference Barro2009). In fact, when I examine the longevity of this relationship, I find a negative drift in stock prices. An increase in Act has a permanent rather than temporary impact on stock prices. This confirms the assumption about rational investors. This confirms the evidence that there was little differentiation in stock price reactions between the sectors on the BSE. This finding is in line with contemporaneous French evidence (Le Bris Reference Le Bris2012). On average, stock prices decreased (or investors became more risk averse) when Act increased. Therefore, I conclude that war risk is a form of systematic risk.
International Evidence
In this section, I use foreign stock listings on the BSE. I categorize stocks as European or non-European stocks. These countries were not directly captured in the measurement of Act and Threat. In particular, for European stocks, I target Austria-Hungary, Greece, Luxembourg, Poland, Portugal, Romania, and Serbia. Non-European countries include Argentina, Brazil, Cameroon, Canada, China, Congo, the Ottoman Empire, India, Japan, and South Africa. Almost all countries had their monetary systems linked to the gold, silver, or bimetallic standard in 1868 and transferred to the classical Gold Standard in 1908 (Eichengreen and Flandreau Reference Eichengreen and Flandreau1994). One obvious drawback in this analysis is the underrepresentation of certain sectors in the country value-weighted indices.
For European countries that are not mentioned in the risk metrics, I find a negative contemporaneous impact on stock prices by Threat (–4 percent) and Act (–7 percent) (Table 6). More importantly, I fail to show a relationship between Threat or Act and dividend growth. This has three implications. First, this strengthens the conclusion that companies are only willing to cut dividends when news is bad. If a military conflict is not close or when the likelihood of spillover is small, managers do not decrease dividend payout. Second, due to a lack of a relationship between dividend growth and the risk measures, stock price changes are predominately driven by changes in expected returns. Third, since investor expectations are a driver of the apparent stock volatility, this evidence indicates that war risk is a form of systematic risk.
INTERNATIONAL REGRESSION ANALYSIS

* = Significant at the 10 percent level.
** = Significant at the 5 percent level.
*** = Significant at the 1 percent level.
Notes: Table 6 presents the results from Equation (9). Panel A reports the contemporaneous and predictive relationship with expected returns, and Panel B reports the contemporaneous and predictive relationship with dividend growth. Regression coefficients are estimated through a panel data regression with country and sector fixed effects to capture unobserved heterogeneity across sectors and countries. The independent variable is Zt, which denotes Threat and Act; $Z_t^\varepsilon $ is the residual from the regression Threatt = α + β1Actt + εt in Act and vice versa; term spread is the difference between the Belgian long-term government bond and commercial paper yields; relative risk-free rate is the difference between commercial paper yield and its 12-month moving average; the dividend yield is the smoothed dividend yield of country j and election year, which is a dummy that yields one 12 months before a legislative election in country j. T-statistics in parentheses are computed with standard errors clustered by country and sectors. AR² is the adjusted R-squared. The European countries include Austria-Hungary, Greece, Luxembourg, Poland, Portugal, Romania, and Serbia. Non-European countries include Argentina, Brazil, Cameroon, Canada, China, Congo, the Ottoman Empire, India, Japan, and South Africa. All stocks were listed on the BSE. All regressions include a constant (not reported). Results are based on the period January 1885–July 1914.
Sources: SCOB and The Economist.
I fail to find any predictive abilities between Threat or Act and expected returns or expected dividend growth. Therefore, I conclude that distant conflicts only have a temporary effect on other European countries’ returns. The lack of forecasting effects confirms that investors assessed the potential spillover of a major war to be relatively small when a country was not included in the war risk measures.
For non-European countries, I fail to show a significant contemporaneous relationship between Threat or Act and stock returns and dividend growth rates. This finding has two important consequences. First, it highlights the importance of proximity to military conflicts. When companies are close to an outbreak of war, such as in European countries, potential spillovers are relatively large or trade opportunities decrease more quickly relative to distant nations. This result confirms the conclusion from Sussman and Yafeh (Reference Sussman and Yafeh1998) who document that only Japan-specific events are able to explain Japanese risk premia, rather than events elsewhere in the world. I draw a similar conclusion: Stock prices from non-European nations do not move on news from major European countries. I extend the results of Campbell, Quinn, and Turner (Reference Campbell, Quinn and Turner2017) who find that U.S. wars have little influence on British stock prices. I show that there is a temporary short-term effect on stocks of other European countries and no effect for non-European countries.
Second, since there were no effects on non-European countries’ stock returns, this indicates that war risk is a local rather than a global form of systematic risk. Furthermore, the lack of predictive ability of the risk metrics for expected returns puts in question the existence of the empire effect. Colonial stocks did not follow the European stock market trends, as the bond evidence suggested (Ferguson and Schularick Reference Ferguson and Schularick2006). However, these results do not necessarily lead to a rejection of the empire effect. These findings show that the conclusions cannot be generalized to other countries or securities. If war risks intensified, the effects did not spread to the entire BSE. This also highlights possible diversification opportunities for investors. Since sectors were not driving the findings, diversification should happen on a country level after an increase in Act.
CONCLUSION
The literature on the effects of military turmoil in the pre-WWI period is relatively scarce due to a lack of high-quality data. I turn to the archives of The Economist to overcome this issue. Through a textual analysis and human reading, I construct two risk measures: Threat and Act. These measures allow me to continuously track war risks. Therefore, I improve over classical event studies and can capture military threat that did not materialize. Furthermore, I do not have to impose any assumption regarding disaster probabilities or investor preferences. In fact, I focus on what people were actually reading in the buildup to WWI. With these measures, I deepen our overall understanding of how managers and investors mitigate war risks.
First, I show that managers mitigated war risk through their dividend policy. I document a contemporaneous decrease in dividend growth when Act increased, while there is no significant effect when Threat increased. This finding confirms the importance of dividends as an information channel for investors. Only when news was really bad were companies willing to consider a dividend cut. I also investigate the mechanism behind this effect. I show that the dividend cuts were not the result of a decrease in cash flow but rather the establishment of a war chest. The findings suggest that the outbreak of war made firms more risk averse. This conclusion is supported through robustness tests and anecdotal evidence.
Another important decision managers can make is the timing of equity and bond IPOs. I find that an increase in Threat and Act leads to a significant decrease in the number of domestic and foreign IPOs. Even when I control for IPO waves, business cycle variation, or past stock returns, the evidence suggests that firms postponed their IPOs due to the increase in war news coverage. This points to managers becoming more risk averse. Moreover, I show that foreign companies were more likely to delist from the BSE after an increase in Act, while there was no effect for Threat. Since stock delisting is costly, and most often an irredeemable decision, it is intuitive that companies delayed such a decision to only when news was really bad. Therefore, the evidence shows that war risk was an important factor in managerial decisions.
Second, I document that investors changed their expectations as a consequence of war risk. An increase in Threat and Act has a contemporaneous decrease in stock prices. In the case of Threat, the results point to an increase in expected returns. Since there is only one significant lag of Threat, this indicates that the effect is temporary (i.e., mean reversion). When Act increases, the magnitude of the impact is larger. There are two explanations. First, investors became more risk averse. They changed expectations on future returns and current dividend growth rates, simultaneously. Second, the outbreak of wars was associated with larger uncertainty and welfare costs. I show that Act has a permanent negative impact on stock prices (i.e., negative drift). Hence, I conclude that investors wanted to be compensated for the additional risks and, thus, increased their expected returns.
There is evidence of the importance of proximity to war. Increases in the metrics led to a contemporaneous decrease in stock prices for European countries, not captured by the measures. For other countries, however, there was no significant change in stock prices following an increase in the level of Threat and Act. This suggests that investors assess the likelihood of spillover to other countries. Investors would only sell stocks when they consider the possibility of a war to be high. This highlights that war risk was an important source of systematic risk, but it was local rather than global. I fail to find evidence that colonial stocks are affected by events in their controlling countries, also referred to as the empire effect (Ferguson and Schularick Reference Ferguson and Schularick2006). In turn, this highlights potential diversification opportunities for investors. Since the industries are not driving the results, investors should diversify their portfolios on the country rather than sector level.



