Introduction
The discovery of the herbicidal properties of the phenoxyacetic acids in Britain and the United States during 1942 and 1944 (Blackman Reference Blackman1948; Hamner and Tukey Reference Hamner and Tukey1944; Mitchell and Hamner Reference Mitchell and Hamner1944) marked the beginning of the herbicide phase of the chemical era of agriculture. The phenoxyacetic herbicides transformed agriculture by selectively controlling many weeds in small and relatively inexpensive quantities and are considered to be among the greatest scientific discoveries of the 20th century (Fryer Reference Fryer and Kirby1980). One of the most important phenoxyacetic herbicides, 2,4-D, has provided economic and selective PRE and POST control of broadleaf weeds in grass crops, range and pasturelands, and noncropland for the past six decades and remains a widely used herbicide throughout the world (Shaner Reference Shaner2014).
The wide use of 2,4-D will likely continue to expand with the use of 2,4-D-resistant corn (Zea mays L.), cotton, and soybean [Glycine max (L.) Merr.] (i.e., Enlist™ Technology; Dow AgroSciences, Indianapolis, IN). Enlist™ cotton enables preplant, PRE, and POST applications of 2,4-D choline. Tolerance to 2,4-D choline was conferred to cotton by the insertion of a gene (aad-12) that codes for an aryloxyalkanoate dioxygenase enzyme (Wright et al. Reference Wright, Shan, Walsh, Lira, Cui, Song, Zhuang, Arnold, Lin, Yau, Russell, Cicchillo, Peterson, Simpson, Zhou, Ponsamuel and Zhang2010). Plants transformed to include this gene can metabolize certain auxin herbicides, including 2,4-D, to a nonlethal form (Richburg et al. Reference Richburg, Wright, Braxton and Robinson2012). The choline salt of 2,4-D is less prone to volatilization than other 2,4-D forms (EPA 2015).
Enlist™ technology contains triple-stack herbicide tolerance to 2,4-D choline, glyphosate, and glufosinate and has the potential to effectively improve management of Palmer amaranth (Amaranthus palmeri S. Watson), Russian thistle (Salsola tragus L.), and other difficult-to-control weeds in cotton in the Texas High Plains. However, like all tools, there are challenges associated with this new technology. One challenge is the risk of spray-tank contamination to 2,4-D–sensitive crops including non–2,4-D–resistant cotton. Risk of spray-tank contamination of 2,4-D in cotton is already a major concern in Texas because grain crops, leguminous crops such as alfalfa and peanut, and pastureland are grown where cotton is produced. Multiple studies have reported the extreme sensitivity of cotton that is not resistant to 2,4-D (Byrd et al. Reference Byrd, Collins, Culpepper, Dodds, Edmisten, Wright, Morgan, Baumann, Dotray, Manuchehri, Jones, Grey, Webster, Davis, Whitaker, Roberts, Snider and Porter2016; Everitt and Keeling Reference Everitt and Keeling2009; Johnson et al. Reference Johnson, Fisher, Jordan, Edminsten, Stewart and York2012; Marple et al. Reference Marple, Al-Khatib, Shoup, Peterson and Claassen2007, Reference Marple, Al-Khatib, Shoup and Peterson2008). In many of these studies, authors also have observed that visual injury is a poor indicator of yield loss (Byrd et al. Reference Byrd, Collins, Culpepper, Dodds, Edmisten, Wright, Morgan, Baumann, Dotray, Manuchehri, Jones, Grey, Webster, Davis, Whitaker, Roberts, Snider and Porter2016; Everitt and Keeling Reference Everitt and Keeling2009; Johnson et al. Reference Johnson, Fisher, Jordan, Edminsten, Stewart and York2012). To better understand this relationship or lack of relationship, field trials were conducted to evaluate non–2,4-D–resistant cotton response to low rates of glyphosate plus 2,4-D choline (Enlist Duo™; Dow AgroSciences) at two application timings: nine leaf and first bloom. Fiber quality, quantitative and economic, also was evaluated, because this topic has not yet been investigated, to our knowledge.
Materials and Methods
Field experiments were conducted in 2013, 2014, and 2015 in Lubbock, TX, at the Texas Tech New Deal Research Farm (33.441376°N, −101.435804°W; elevation, 994 m). The cultivar ‘Phytogen 499 WRF’ (Dow AgroSciences, Indianapolis, IN) was planted at 10 seed m−1 in rows spaced 101-cm apart on May 10, 2013, June 5, 2014, and May 27, 2015, using a John Deere 1700 MaxEmerge XP Planter (John Deere, Moline, IL). The soil type was a Pullman clay loam (fine, mixed, superactive, thermic Torrertic Paleustolls) with less than 1% organic matter and pH of 7. We applied 154 kg of 28-0-0-5 (N-P-K-S) fertilizer in two in-season applications. All studies were arranged in a randomized complete block design with four replications. Each replication was 26 m by 98 m and each plot was 4 m by 12 m. In-season rainfall was 292 mm in 2013, 460 mm in 2014, and 354 mm in 2015. Water was applied as needed through subsurface drip irrigation. In-season irrigation was 307, 35, and 188 mm in 2013, 2014, and 2015, respectively. Two tillage passes were made throughout the trial with a field cultivator.
Cotton plants were treated with five rates of glyphosate plus 2,4-D choline (0.0183, 0.183, 1.83, 18.3, and 183 g ae ha−1) at two application timings (nine leaf and first bloom). These rates correspond to glyphosate plus 2,4-D choline contamination rates of 0.0008%, 0.008%, 0.08%, 0.8%, and 8%, respectively. The greatest contamination rate (8%, or 183 g ae ha−1) translates to an applicator leaving approximately 19 L of glyphosate plus 2,4-D choline spray solution in a 1,136-L tank calibrated to deliver glyphosate plus 2,4-D choline at 2.22 kg ha−1 at a carrier volume of 140 L ha−1. The tank with 19 L of the glyphosate plus 2,4-D choline solution was then filled with glyphosate (Roundup PowerMAX®; Monsanto Co., St. Louis, MO) and water to bring the total solution back to 1,136 L. The glyphosate rate was 1.12 kg ae ha−1 and the carrier volume remained at 140 L ha−1. The nontreated control received a glyphosate-only application at the same rate where no glyphosate plus 2,4-D choline contamination was present.
All applications were made at 4.8 km h−1 with a CO2-pressurized backpack sprayer equipped with AIXR11002 spray tips (TeeJet® Technologies, Glendale Heights, IL) calibrated to deliver 140 L ha−1 at 205 kPa. No adjuvants were included with any treatment. Insect control and fertilization practices were standard for cotton production in the Texas High Plains (Bronson Reference Bronson2004; Kerns et al. Reference Kerns, Sanson, Siders and Baugh2009). Visual injury was recorded throughout the season using a scale of 0% (no injury) to 100% (complete crop death). Leaf curling, petiole and stem epinasty, stunting, and chlorosis were considered when making visual injury estimates.
At crop maturity, based on the nontreated control, cotton was defoliated following local extension recommendations (Kelley et al. Reference Kelley, Keeling, Keys and Morgan2014). After defoliation and before harvest, 10 consecutive plants from each plot were removed by cutting the main stem directly above the soil surface. The plant was divided into 0.3-m sections of the main stem and the number of open and closed bolls quantified. Plots were harvested at the end of the season with a two-row plot harvester and seed cotton yield was determined. After ginning, a 40-g lint sample was subjected to fiber quality tests, which included micronaire, fiber length, length uniformity, and fiber strength, at the Texas Tech University Fiber and Biopolymer Research Institute, Lubbock, TX.
To determine the financial impact of herbicide injury on cotton, fiber-quality parameters were entered into a loan value calculator to determine the value or price of cotton kg−1 on the basis of the aforementioned parameters. The loan-value calculator used in this study was provided by Cotton Inc. for the 2015 crop and based on the US Department of Agriculture Commodity Credit Corp. upland cotton loan rates. Fiber-quality parameters are assigned either premium, base, or discount level on the of their value, and the actual amount of premium (i.e., an increase in value above the base) or discount is determined by the magnitude of the increase or decrease from the base. For more detailed information on fiber quality and cotton loan values, readers are referred to Bourland et al. (Reference Bourland, Hogan, Jones and Barnes2010) and USDA (1995).
Because of the lack of an appropriate lint cleaner, base values were assigned for color and leaf grades. These are reflective of the base values regarding fiber quality values as determined by the 2015 loan schedule of premiums and discounts for upland cotton, which were 41 for color grade and 4 for leaf grade (NCC 2019). For the 3 yr of this study, fiber that met base values across all quality parameters was valued at $1.15 kg−1 (NCC 2019). Loan values were multiplied by the lint yield ha−1 values to produce gross return values ha−1.
A univariate analysis was performed on all responses to test for stable variance (SAS, version 9.3; SAS Institute Inc., Cary, NC). No data sets were transformed, because transformation did not increase stabilization, with the exception of boll retention from 0.3 to 0.6 m in 2014. A value of 1 was added to these values before applying the natural-log transformation. Adding a value of 1 to the values of this data set was necessary to include values of zero in the natural-log transformation analysis. All data sets were analyzed using PROC MIXED in SAS, with the pdmix 800 macro described by Saxton (Reference Saxton1998) and treatments were separated by Fisher protected LSD at an α level of 0.05.
Results and Discussion
Visual Injury
For visual injury, 2014 and 2015 trials were averaged over year because of no significant year effect (P > 0.05), whereas the 2013 trial data were analyzed independently. The two-way interaction between application timing and glyphosate plus 2,4-D choline contamination rate was not significant; therefore, main effects are discussed.
In 2013, when averaged over contamination rate, visual injury 28 d after treatment (DAT) increased from 15% for cotton treated at first bloom to 27% for cotton treated at nine leaf (Table 1). Averaged over application timing, visual injury, after contamination rates of 0.0008% (0.0183 g ae ha−1) and 0.008% (0.183 g ae ha−1), were similar at 3% or greater (Table 2). However, the injury rates of cotton were 20%, 41%, and 62% when treated at contamination rates of 0.08% (1.83 g ae ha−1), 0.8% (18.3 g ae ha−1), and 8% (183 g ae ha−1), respectively.
Visual injury, averaged over contamination rate, 28 d after treatment, boll retention, and lint yield as influenced by application timing in 2013, 2014, and 2015.

a Means within a column followed by the same or no letter are not significantly different according to Fisher protected LSD test at an α level of 0.05.
Visual injury, averaged over application timing, 28 d after treatment, boll retention, and lint yield as influenced by glyphosate plus 2,4-D choline tank-contamination rate in 2013, 2014, and 2015.

a Glyphosate plus 2,4-D choline contamination rates of 0.0008%, 0.008%, 0.08%, 0.8%, and 8% correspond to treatment rates of 0.0183, 0.183, 1.83, 18.3, and 183 g ae ha−1, respectively.
b Means within a column followed by the same or no letter are not significantly different according to Fisher protected LSD test at an α level of 0.05.
c Abbreviation: NA, not applicable.
Averaged over years 2014 and 2015 and contamination rates, visual injury 28 DAT increased from 4% for cotton treated at first bloom to 18% for cotton treated at the nine-leaf timing (Table 1). Averaged over application timing, contamination rates of 0.0008% (0.0183 g ae ha−1) and 0.008% (0.183 g ae ha−1) resulted in a similar level of injury and did not exceed 1% (Table 2). However, contamination rates of 0.08% (1.83 g ae ha−1), 0.8% (18.3 g ae ha−1), and 8% (183 g ae ha−1) caused 4%, 19%, and 44% visual injury, respectively.
Similarly, Byrd et al. (Reference Byrd, Collins, Culpepper, Dodds, Edmisten, Wright, Morgan, Baumann, Dotray, Manuchehri, Jones, Grey, Webster, Davis, Whitaker, Roberts, Snider and Porter2016) observed the greatest level of visual, vegetative injury when 2,4-D was applied to nine-leaf cotton across 12 locations throughout the Cotton Belt, including a location at the same site where this research was conducted. Byrd et al. (Reference Byrd, Collins, Culpepper, Dodds, Edmisten, Wright, Morgan, Baumann, Dotray, Manuchehri, Jones, Grey, Webster, Davis, Whitaker, Roberts, Snider and Porter2016) observed injury 29% to 56% and 49% to 77% when 2,4-D amine rates of 2 and 40 g ae ha−1 were applied at four- and nine-leaf cotton stages, respectively. As cotton matured beyond the 2 wk after first-bloom stage, visual injury from the 2 and 40 g ha−1 rates was less than 10% and 25%, respectively. Marple et al. (Reference Marple, Al-Khatib, Shoup and Peterson2008) also observed greater injury when 2,4-D amine was applied before bloom, specifically at the three- to four-leaf stage compared with eight-, 14-, and 18-node stages. In their work, 61% and 76% injury 28 DAT was observed for three- to four-leaf cotton after simulated drift rates of 1.4 and 2.8 g ae ha−1, respectively.
In addition, Everitt and Keeling (Reference Everitt and Keeling2009) observed that 2,4-D amine simulated drift rates as low as 2.8 g ae ha−1 applied at the cotyledon- to two-leaf stage injured cotton 50% 14 DAT, with injury increasing to greater than 90% at a 280 g ae ha−1 rate. In another study, Johnson et al. (Reference Johnson, Fisher, Jordan, Edminsten, Stewart and York2012) observed 36% to 90% visual injury 2 wk after treatment when 20- to 30-cm cotton was treated with 2,4-D amine simulated drift rates of 1, 5, 20, 78, and 269 g ae ha−1.
Boll Retention
For boll retention from 0 to 0.3 m, 2013 and 2014 trials were averaged because of no significant year effect (P > 0.05). The 2015 trial was analyzed independently. For boll retention from 0.3 to 0.6 m, 2013, 2014, and 2015 trials were analyzed independently. The two-way interaction between application timing and glyphosate plus 2,4-D choline contamination rate was not significant; therefore, main effects are discussed.
Application timing and contamination rate affected boll retention from 0 to 0.3 m when averaged over 2013 and 2014 (Tables 1 and 2). Boll retention, averaged over contamination rate, was greater for first-bloom cotton than for nine-leaf cotton. When averaged over application timing, boll retention after contamination rates of 0.0008% (0.0183 g ae ha−1), 0.008% (0.183 g ae ha−1), and 0.08% (1.83 g ae ha−1) were similar to that of the nontreated control. For contamination rates of 0.8% (18.3 g ae ha−1) and 8% (183 g ae ha−1), boll retention compared with that of the nontreated control decreased by 0.9 and 1.4 bolls, respectively. In 2015, boll retention averaged over contamination rate was similar for applications made at the nine-leaf and first-bloom timings (Table 1). When averaged over application timing, contamination rates of 0.8% and 8% decreased boll retention by 1.7 and 2.9 bolls, respectively (Table 2).
In 2013, 2014, and 2015, application timing did not affect boll retention from 0.3 to 0.6 m (Table 1); however, contamination rate did have an effect (Table 2). When averaged over application timing, boll retention after contamination rates of 0.0008% (0.0183 g ae ha−1), 0.008% (0.183 g ae ha−1), and 0.08% (1.83 g ae ha−1) was similar to that of the nontreated control. At contamination rates of 0.8% (18.3 g ae ha−1) and 8% (183 g ae ha−1), boll retention decreased by 1.4 and 2.2 bolls, respectively. Boll retention for all contamination rates was similar to that of the nontreated control, with the exception of the 8% contamination rate, at which no bolls were retained from 0.3 to 0.6 m. Boll retention for contamination rates of 0.0008%, 0.008%, and 0.08% were similar to that of the nontreated control. However, at contamination rates of 0.8% and 8%, boll retention decreased by 2.8 and 4.1 bolls, respectively. Byrd et al. (Reference Byrd, Collins, Culpepper, Dodds, Edmisten, Wright, Morgan, Baumann, Dotray, Manuchehri, Jones, Grey, Webster, Davis, Whitaker, Roberts, Snider and Porter2016) observed the greatest impact on boll development and retention after 2,4-D exposure (40 g ae ha−1) at nine leaf, first bloom, and 2 wk after first bloom. Marple et al. (Reference Marple, Al-Khatib, Shoup, Peterson and Claassen2007) did not report boll retention but did observe reduced development in bolls after 2,4-D exposure.
Lint Yield
Cotton lint yield in 2013, 2014, and 2015 trials was analyzed independently because of a significant year effect across all year combinations (P ≤ 0.05). The two-way interaction between application timing and glyphosate plus 2,4-D choline contamination rate for each year was not significant; therefore, main effects are discussed. Environmental effects explain year-to-year yield variability not caused by treatment effects. In 2014, a later planting date and cooler season temperatures reduced total heat unit accumulation by 579 and 303 degree days with a base temperature of 60 F compared with 2013 and 2015, respectively.
When averaged over contamination rates, lint yield for nine-leaf cotton was less than for first-bloom cotton in 2013, 2014, and 2015 (Table 1). Averaged over application timing in 2013, lint yield after glyphosate plus 2,4-D choline contamination rates of 0.0008% (0.0183 g ae ha−1) and 0.008% (0.183 g ae ha−1) was not different than that of the nontreated control, whereas contamination rates of 0.08% (1.83 g ae ha−1), 0.8% (18.3 g ae ha−1), and 8% (183 g ae ha−1) decreased yield by 3%, 45%, and 80%, respectively (Table 2). In 2014, lint yield after contamination rates of 0.0008% and 0.008% was similar to that of the nontreated control (Table 2). Contamination rates of 0.08%, 0.8%, and 8% decreased lint yield by 20%, 58%, and 96%, respectively. In 2015, when averaged over application timing, lint yields for 0.0008%, 0.008%, and 0.08% were not detrimentally affected compared with the nontreated control, whereas contamination rates of 0.8% and 8% decreased lint yield by 48% and 88%, respectively (Table 2).
Marple et al. (Reference Marple, Al-Khatib, Shoup and Peterson2008) found that 2,4-D amine had no adverse effect on lint yield except when applied at 2.8 g ae ha−1 at the three- to four-leaf application timing. Similarly, Everitt and Keeling (Reference Everitt and Keeling2009) observed that 2.8 g ae ha−1 2,4-D amine and lower had little effect on yield reduction (<10%) across all application timings (two leaf, four to five leaf, pinhead square, and early bloom); however, yield reductions of 61% to 97% were observed after an application rate of 280 g ae ha−1. Conversely, Byrd et al. (Reference Byrd, Collins, Culpepper, Dodds, Edmisten, Wright, Morgan, Baumann, Dotray, Manuchehri, Jones, Grey, Webster, Davis, Whitaker, Roberts, Snider and Porter2016) observed yield loss greater than 20% at five of 12 locations across the Cotton Belt when as little as 2 g ae ha−1 2,4-D amine was applied to cotton between the four-leaf stage and 2 wk after first bloom. At 40 g ae ha−1, averaged over the same 12 locations, yield was 45%, 58%, 66%, 45%, 16%, and 7% less than that of the nontreated control when applied at the four-leaf, nine-leaf, and first-bloom stages, and at 2, 4, and 6 wk after first bloom, respectively.
Fiber Quality
For micronaire and fiber length uniformity, the 2013, 2014 and 2015 trial data were analyzed independently because of a significant year effect across all year combinations (P ≤ 0.05). For fiber staple length and fiber strength, the 2014 and 2015 trial data were averaged over year because of no significant year effect (P > 0.05), whereas the 2013 trial data were analyzed independently. The two-way interaction between application timing and glyphosate plus 2,4-D choline contamination rate for each year was not significant; therefore, main effects are discussed.
Micronaire, length, uniformity, and strength were quantified with the high-volume instrument line. Micronaire is a measure of the air permeability of compressed cotton fibers. It is often used as an indication of fiber fineness and maturity (Cotton Inc. 2016). In 2013, micronaire after glyphosate plus 2,4-D choline contamination rates of 0.0008% (0.0183 g ae ha−1), 0.008% (0.183 g ae ha−1), 0.08% (1.83 g ae ha−1), and 0.8% (18.3 g ae ha−1) were similar to those of the nontreated control, whereas a contamination rate of 8% (183 g ae ha−1) decreased micronaire by 0.83 (Table 3). Application timing and contamination rate did not affect micronaire in 2014 (Table 3). In 2015, micronaire after contamination rates of 0.0008%, 0.008%, and 0.08% were similar to that of the nontreated control, whereas contamination rates of 0.08% and 8% decreased micronaire by 0.34 and 1.15, respectively, when compared with the nontreated control (Table 3).
Fiber quality measurements, averaged over application timing, as influenced by glyphosate plus 2,4-D choline tank-contamination rate in 2013, 2014, and 2015.

a Glyphosate plus 2,4-D choline contamination rates of 0.0008%, 0.008%, 0.08%, 0.8%, and 8% correspond to treatment rates of 0.0183, 0.183, 1.83, 18.3, and 183 g ae ha−1, respectively.
b Means within a column followed by the same or no letter are not significantly different according to Fisher protected LSD test at an α level of 0.05.
Fiber length is the average of the longest 50% of the fibers (i.e., upper half mean length) (Cotton Inc. 2016). In 2013, lengths after 0.0008% (0.0183 g ae ha−1), 0.008% (0.183 g ae ha−1), 0.08% (1.83 g ae ha−1), and 0.8% (18.3 g ae ha−1) contamination rates were similar to that of the nontreated control; however, a contamination rate of 8% (183 g ae ha−1) decreased length by 0.16 cm (Table 3). Averaged over 2014 and 2015, fiber length was not affected by application timing (data not shown) or contamination rate (Table 3).
Fiber length uniformity index is the ratio (reported as a percentage) of the average length to the upper half mean length. Length uniformity index is an indicator of how fibers will perform in the spinning of yarn (Cotton Inc. 2016). In 2013, application timing and contamination rate affected fiber length uniformity. Across all contamination rates, the length uniformity for nine-leaf cotton was 1.14% greater than for first-bloom cotton (data not shown). Averaged over application timing, fiber length uniformity was similar for that of the nontreated control and all contamination rates with the exception of the 8% contamination rate (183 g ae ha−1), which was 2.19% less (Table 3). Fiber length uniformity in 2014 was not affected by application timing (data not shown) or contamination rate (Table 3). In 2015, application timing and contamination rate affected fiber length uniformity. Averaged over all contamination rates, length uniformity for first-bloom cotton was 0.3% greater than for nine-leaf cotton (data not shown). Averaged over application timing, length uniformity for contamination rates of 0.0008% (0.0183 g ae ha−1), 0.008% (0.183 g ae ha−1), 0.08% (1.83 g ae ha−1), and 0.8% (18.3 g ae ha−1) was similar to that of the nontreated control (Table 3). At the 8% contamination rate, fiber length uniformity decreased by 2.27% when compared with the nontreated control.
Fiber strength reports the force, in grams, required to break a bundle of fiber of one tex unit. A tex unit is the weight in grams of 1,000 m of fiber (Cotton Inc. 2016). Averaged over 2013, 2014, and 2015, glyphosate plus 2,4-D choline contamination rate affected fiber strength (Table 3). Fiber strength was similar for contamination rates of 0.0008% (0.0183 g ae ha−1), 0.008% (0.183 g ae ha−1), 0.08% (1.83 g ae ha−1), and 0.8% (18.3 g ae ha−1); however, a contamination rate of 8% (183 g ae ha−1) decreased fiber strength by 1.86 g. Marple et al. (Reference Marple, Al-Khatib, Shoup and Peterson2008) found that simulated drift of 2,4-D on cotton did not affect average micronaire, fiber length, fiber strength, fiber color, or trash; however, 2,4-D treatments did reduce fiber elongation. Fiber elongation was not analyzed in this study.
Fiber Value and Return
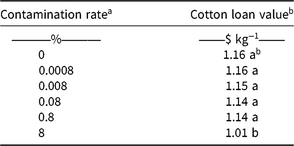
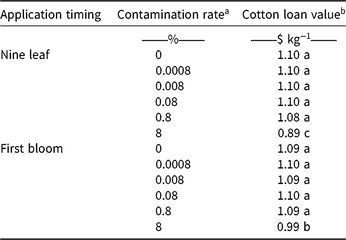
When pooled over years, there was a significant year effect for both cotton loan value (P < 0.0001) and return ha−1 (P < 0.0001); therefore, years were analyzed separately. In 2013, the greatest contamination rate reduced loan value by 13 to 15 cents ha−1 (Table 4). There was no effect of application timing or contamination rate on loan value in 2014 (data not shown). This was largely due to poor fiber quality, with the value kg−1 across all treatments ($0.99), averaging $0.16 kg−1 lower than that of the value of base quality fiber. In 2015, there was a significant interaction between application timing and contamination rate for cotton loan value (Table 5). For both application timings at the lowest four contamination rates, there were no differences compared with the control. The 8% rate reduced the value of each kg of lint by 10 and 20 cents when exposure occurred at the first-bloom and nine-leaf stages, respectively.
Cotton loan value, averaged over application timing, as influenced by glyphosate plus 2,4-D choline tank-contamination rate in 2013.

a Glyphosate plus 2,4-D choline contamination rates of 0.0008%, 0.008%, 0.08%, 0.8%, and 8% correspond to treatment rates of 0.0183, 0.183, 1.83, 18.3, and 183 g ae ha−1, respectively.
b Means within a column followed by the same or no letter are not significantly different according to Fisher protected LSD test at an α level of 0.05.
Cotton loan value for the interaction of application timing and contamination rate as influenced by glyphosate plus 2,4-D choline tank-contamination rate in 2015.

a Glyphosate plus 2,4-D choline contamination rates of 0.0008%, 0.008%, 0.08%, 0.8%, and 8% correspond to treatment rates of 0.0183, 0.183, 1.83, 18.3, and 183 g ae ha−1, respectively.
b Means within a column followed by the same or no letter are not significantly different according to Fisher protected LSD test at an α level of 0.05.
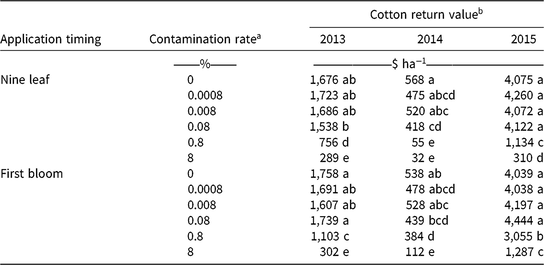
For return in 2013, 2014, and 2015, there was a significant interaction between application timing and contamination rate (Table 6). In 2013, the greatest two contamination rates resulted in reductions in return value for both application timings compared with the nontreated control and lowest three contamination rates. Reductions at the greatest contamination rate were similar for both application timings; however, at the 0.8% contamination rate, the reduction in value for nine-leaf cotton was greater than for first-bloom cotton by $347 ha−1. In 2014, at the nine-leaf application timing, there was no difference in return at the lowest two contamination rates compared with the nontreated control, and the same trend was observed for the first-bloom application timing. However, 0.8% and 8% contamination rates reduced return value for nine-leaf cotton by $513 and $536 ha−1, respectively. For first-bloom cotton, a reduction in return was less severe with a decrease of $426 ha−1 after exposure to the greatest contamination rate. In 2015, the lowest three contamination rates were similar to that of the nontreated control, regardless of application timing. The 0.8% rate reduced return ha−1 values regardless of application timing, although at the nine-leaf stage, the loss resulting from this rate was $1,921 greater than at first bloom. A similar relationship was present for the greatest contamination rate: The 8% rate resulted in the greatest value ha−1 reduction, but the nine-leaf stage experienced a $978 greater loss than the first-bloom stage. In fact, there was no difference between the 0.08% rate at the nine-leaf stage and the 8% rate at first bloom in regard to return value ha−1.
Cotton return value for the interaction of application timing and contamination rate as influenced by glyphosate plus 2,4-D choline tank-contamination rate in 2013, 2014, and 2015.

a Glyphosate plus 2,4-D choline contamination rates of 0.0008%, 0.008%, 0.08%, 0.8%, and 8% correspond to treatment rates of 0.0183, 0.183, 1.83, 18.3, and 183 g ae ha−1, respectively.
b Means within a column followed by the same or no letter are not significantly different according to Fisher protected LSD test at an α level of 0.05.
It is important to note that the nontreated control and the two lowest rates of 2,4-D in 2013 were the only three treatments in the entire study that resulted in loan values over the base value of $1.15 kg−1. This illustrates the narrow tolerance that cotton has in short-season environments for any factors that could inhibit fruit development and fiber maturity processes. Although the impact on cotton yield and, to a lesser extent, fiber quality has been well documented in previous research (Byrd et al. Reference Byrd, Collins, Culpepper, Dodds, Edmisten, Wright, Morgan, Baumann, Dotray, Manuchehri, Jones, Grey, Webster, Davis, Whitaker, Roberts, Snider and Porter2016; Everitt and Keeling Reference Everitt and Keeling2009; Johnson et al. Reference Johnson, Fisher, Jordan, Edminsten, Stewart and York2012; Marple et al. Reference Marple, Al-Khatib, Shoup, Peterson and Claassen2007, Reference Marple, Al-Khatib, Shoup and Peterson2008), the resulting impact on the value of the lint and the overall impact on a producer’s potential financial return has not been explored, to our knowledge. The results of this study provide valuable information on what may be encountered in environments promoting the development of base quality fiber (in 2013), fiber with slightly worse quality than base (in 2015), and poor quality fiber (in 2014). The large reduction in fiber-quality values observed in 2014 was primarily due to micronaire values falling into the discount range. Low micronaire strongly correlates with environmental conditions—specifically, when cool weather, cloudy conditions, or excess rainfall delay or inhibit fiber maturity, resulting in thin fibers. Short-season environments, such as this study’s west Texas location, are prone to these conditions and the production of low-micronaire cotton in this environment is not uncommon.
Although yield values in 2013 were not nearly at the level of those in 2015, this was the most favorable year in the study for fiber quality. The highest contamination rate decreased the value of fiber on kg−1 basis, but the combination of yield and quality reductions was responsible for the low return values. In years such as 2014, when environmental conditions decrease yield potential and the ability to develop high-quality fiber, exposure to 2,4-D will not result in a value loss on a kg−1 basis. However, cotton yield loss due to 2,4-D exposure results in a tremendous loss in value on a per land area basis in seasons in which environment already creates a low ceiling for fiber production. The 2015 season exemplified a season in which producing a large amount of fiber was not an issue but producing high-quality fiber was a challenge, because all treatments fell at least $0.06 below base values. Similar to 2014, the impact of 2,4-D exposure was best illustrated by reduced fiber quality and return values resulting from the two highest contamination rates.
In general, visual injury, averaged across tank-contamination rates, was greater for nine-leaf cotton than for first-bloom cotton in all 3 yr. Yield loss from tank contamination of nine-leaf cotton, averaged across tank contamination rates, was greater than for first-bloom cotton in two of 3 yr. Others have reported that yield loss is most severe when 2,4-D drift occurred during early growth stages, particularly those prior to bloom (Byrd et al. Reference Byrd, Collins, Culpepper, Dodds, Edmisten, Wright, Morgan, Baumann, Dotray, Manuchehri, Jones, Grey, Webster, Davis, Whitaker, Roberts, Snider and Porter2016; Egan et al. Reference Egan, Barlow and Mortensen2014; Everitt and Keeling Reference Everitt and Keeling2009; Marple et al. Reference Marple, Al-Khatib, Shoup and Peterson2008). In 2013, 2014, and 2015, visual injury ratings underestimated percent yield loss at contamination rates of 0.8% (18.3 g ae ha−1) and 8% (183 g ae ha−1), whereas injury from the 0.08% (1.83 g ae ha−1) contamination rate both overestimated and underestimated yield loss, depending on the year. Everitt and Keeling et al. (Reference Everitt and Keeling2009) found that visual injury after 2,4-D amine applied late in the season tended to overestimate yield loss, whereas Johnson et al. (Reference Johnson, Fisher, Jordan, Edminsten, Stewart and York2012) observed that visual injury early in the season was a poor indicator of cotton yield loss. When predicting yield loss, boll load as noted by plant mapping may be a better indicator than visual injury (Byrd 2016; Johnson et al. Reference Johnson, Fisher, Jordan, Edminsten, Stewart and York2012). This research continues to support reports that non–2,4-D–resistant cotton is extremely sensitive to 2,4-D and that predicting yield loss based on visual injury is unreliable. For fiber quality, the results of this study confirm that, like the impact on visual injury and yield loss, the impact of 2,4-D on fiber values and potential financial return is governed by rate and growth stage at the time of exposure.
Finally, another factor yet to be explored that could play a role in the yield response is the role of the maturity class of the cotton variety. A mid-late maturity variety was used in this study because of its popularity in the region and across the Cotton Belt at the time of the study. It is conceivable to hypothesize that an early-maturing variety with a different pattern of fruit development may lead to a greater amount of fruit being exposed to 2,4-D at the growth stages evaluated in the present study.
Acknowledgements
Work on this project was enhanced by the technical support and expertise of the following people: Shay Morris, Rand Merchant, and Mike Lovelace. The authors are grateful for funding provided by the Texas State Support Committee, Cotton Inc. No conflicts of interest have been declared.