Introduction
Landscape connectivity is vital to protecting biodiversity and to achieving the targets established by the United Nations Sustainable Development Goals, and it is also specifically mentioned in Aichi Target 11 of the Convention on Biological Diversity (Woodley et al. Reference Woodley, Bertzky, Crawhall, Dudley, Londoño, MacKinnon and Redford2012, Reed et al. Reference Reed, Deakin and Sunderland2015). Connectivity is critical to protected areas systems due to it enhancing ecological processes and functions across a landscape (Taylor et al., Reference Taylor, Fahrig, Henein and Merriam1993, Convention on Biological Diversity 2011). Accomplishing connectivity goals requires managing areas outside the boundaries of protected areas in order to go beyond land-sparing techniques, and when achieved, it supports conservation of protected area networks (DeFries et al. Reference DeFries, Hansen, Turner, Reid and Liu2007). Biological corridors, helping to support land-sharing conservation measures, are an effective means of achieving landscape connectivity by creating connections between protected areas. When strategically employed over large areas, corridors can benefit biodiversity conservation (Schippers et al. Reference Schippers, van der Heide, Koelewijn, Schouten, Smulders, Cobben and Sterk2015). Managing landscape features and economic activities within corridors requires coordination between policies and local landowners in order to enhance connectivity while providing appropriate economic and other incentives. Enhancing connectivity in biological corridors is a challenging feat, as these areas are often multiuse, private and public lands that form a network connecting protected areas.
Connectivity can be defined in several contexts, including landscape, habitat, ecological and evolutionary processes (Supplementary Text 1, available online) (Lindenmayer & Fischer Reference Lindenmayer and Fischer2006, Worboys et al. Reference Worboys, Francis and Lockwood2010). During policy decision-making processes, all levels of connectivity are important. A variety of corridor designs may be used to enable each level of connectivity, including linear features, lattice networks or steppingstones, with some designs addressing potential climate change impacts (Williams et al. Reference Williams, Hannah, Andelman, Midgley, AraúJo, Hughes and Manne2005, Saura et al. Reference Saura, Bodin and Fortin2014, Townsend & Masters Reference Townsend and Masters2015).
Costa Rica corridors
Costa Rica’s National Biological Corridors Program (NBCP) was created in 2006 to enhance connectivity between protected areas and was deemed an official conservation priority in 2008 (Supplementary Text 2) (MINAE 2006, 2008). A primary goal of Costa Rica’s NBCP is to improve connectivity via the creation of landscape corridors (Gilbert-Norton et al. Reference Gilbert-Norton, Wilson, Stevens and Beard2010). Since the 2006 establishment of the NBCP, Costa Rica has increased its commitment to landscape connectivity by targeting payments for environmental services (PES) payments within biological corridors (MINAE 2008). In the priority criteria assessment for PES site selection, properties within biological corridors were provided with an additional number of points, giving them a better chance of selection (MINAE 2014). The National System of Conservation Areas (SINAC) definition specifies landscape, habitat and ecological connectivity (SINAC 2009), identifying ecological connectivity as a strategic objective, with the goal of strengthening protected areas and their connections (Supplementary Text 3) (SINAC 2009).
In order to promote corridor connectivity, the NBCP uses a PES scheme as a tool to enact change within the corridor network (SINAC 2009). Since 1997, this scheme has offered various types of contracts to landowners, providing payments for areas under agroforestry, forest protection or reforestation. Payments are targeted towards the maintenance and creation of forested landscapes (Daniels et al. Reference Daniels, Bagstad, Esposito, Moulaert and Rodriguez2010, Wood et al. Reference Wood, Sheridan, Feagin, Castro and Lacher2017). PES contracts are 5-year contracts that provide annual payments per hectare for a designated parcel, with options for renewal. Prior to 2000, PES programme applications were accepted on a ‘first come, first served’ basis. Over the programme’s lifetime, the number of applicants has exceeded the number of available contracts, despite payments often being less profitable than alternative land uses such as livestock grazing or ornamental plant production (Wood et al. Reference Wood, Sheridan, Feagin, Castro and Lacher2017).
The effectiveness of PES along with its additionality has been studied at length over the years, and studies argue for both sides (Engel et al. Reference Engel, Wünscher, Wunder, Palmer and Engel2009, Muradian et al. Reference Muradian, Arsel, Pellegrini, Adaman, Aguilar, Agarwal and Corbera2013, Chan et al. Reference Chan, Anderson, Chapman, Jespersen and Olmsted2017). More recently, various criteria for assessing PES programmes have been created in an attempt to understand how to reduce negative impacts, improve spatial coordination and minimize leakage, among other themes (Engel Reference Engel2016). While the efficacy of Costa Rica’s PES programme is much debated, often citing only small environmental gains, the use of other metrics to assess ecological efficacy, such as connectivity of landscapes irrespective of PES programme functionality is often not considered (Börner et al. Reference Börner, Baylis, Corbera, Ezzine-de-Blas, Honey-Rosés, Persson and Wunder2017). PES used to promote connectivity and corridors is underrepresented in the literature, and more information is needed in order to understand this, with PES programme success often being represented by the number of participants, parcels and hectares enrolled over a given period of time; however, these metrics do not necessarily provide meaningful insights into the degree to which landscape connectivity is achieved.
Within corridors, connectivity and its utility to wildlife is determined by habitat patch configuration and the landscape matrix in which PES properties are embedded (Baum et al. Reference Baum, Haynes, Dillemuth and Cronin2004). Our paper focuses on landscape connectivity in order to understand vegetation changes in biological corridor systems. We used SINAC’s designation of increased natural cover to mean an increase in forested areas, using this as a metric to measure changes in the landscape connectivity component of the NBCP.
Conservation investments are expensive, and there is an increased emphasis on clarifying objectives and evaluating programme effectiveness (Ferraro & Pattanayak Reference Ferraro and Pattanayak2006, Wunder Reference Wunder2015). Options available to test intervention effectiveness include counterfactuals, reference frames, comparison to fixed baselines and biodiversity trajectories (Bull et al. Reference Bull, Gordon, Law, Suttle and Milner-Gulland2014). Landscape-level interventions, however, are rarely amenable to prior experimental testing as they lack true controls or non-biased comparisons (Margoluis et al. Reference Margoluis, Stem, Salafsky and Brown2009). As NBCP was implemented nationally, there were no in-country controls to enable experimental testing at national scales. We specifically test whether PES location before NBCP and PES location selection after NBCP equates to differences in landscape connectivity within biological corridors. The baseline is level of connectivity present in the corridor prior to implementation of NBCP, based upon biodiversity trajectory models (Bull et al. Reference Bull, Gordon, Law, Suttle and Milner-Gulland2014). In this case, we consider counterfactual baselines to be static (Wunder Reference Wunder2005) since non-directed placement of PES locations without regard to enhancement of connectivity should result in no increased connectivity in priority corridors. However, given ongoing restoration activities in Costa Rica, there is the chance for ‘false positives’ if areas within corridors are reforested without PES support (Supplementary Fig. S1). Because PES and NBCP are embedded in a complex landscape, it is impossible to know exactly what caused the witnessed changes, but we can test whether the broader NBCP goals are being achieved within biological corridors.
Our study evaluates progress towards the first two goals of the NBCP: maintenance and restoration of connectivity, demonstrated by an increase in natural land cover (MINAE 2006). We aim to understand the usefulness of corridor and connectivity programmes and tools, and specifically PES as a connectivity tool. Through spatial modelling, we measured trends in forest cover aligned with two government programmes: (1) NBCP; and (2) PES. We assessed the effectiveness of the PES-NBCP in increasing connectivity after programme implementation (2008) and 6 years into the programme (2012) using electrical current model theory (McRae et al. Reference McRae, Dickson, Keitt and Shah2008, Reference McRae, Shah and Mohapatra2013). Additionally, we used a least-cost path analysis in order to identify important, highly connected pathways, as well as narrow and fragmented areas at risk of isolation.
This methodological approach allows for a meaningful measurement of connectivity, which is not well represented in area or land cover descriptions. Connectivity is cited as a major objective and indicator within the NSBP of Costa Rica for 2016–2025 and is measured through land cover and a resistance index (MINAE et al. 2018, SINAC 2018). This approach identifies connectivity loss or gain, but does not spatially identify areas of improved or reduced connectivity.
Methods
Study area
We tested landscape connectivity changes during the NBCP and PES programmes in the Paso de las Nubes Biological Corridor (CBPN) (Fig. 1). This corridor covers an area of c. 40 000 ha located at 10.343392 latitude, –84.540478 longitude, northwest of San José in the Tilaran and Central mountain ranges of Alajuela Province, Costa Rica. CBPN was chosen as a study site due to its important connection role for the central mountain and because previous research found forest loss occurring at higher rates inside CBPN than areas directly outside the corridor, indicating a need for further understanding of change within corridors (Wood et al. Reference Wood, Sheridan, Feagin, Castro and Lacher2017). CBPN is an essential connection point for protected areas, providing the only conservation lands linking the Pacific and Caribbean slopes in the northern half of the country. Natural vegetation in the corridor includes closed canopy forests, premontane rainforest, premontane wet forest, lower montane moist and rain forest and tropical wet forest (Hartshorn Reference Hartshorn1983). Primary land uses include private forests, dairy farms, ornamental plant agriculture, tree plantations, urban areas and agroforestry. The CBPN’s eastern border is Poas National Park and Juan Castro Blanco National Park, which function as the headwaters for five major rivers. The CBPN western border includes Alberto Manuel Brenes Biological Reserve, the Children’s Eternal Rainforest and Arenal National Park, holding important tracts of high-biodiversity cloud forest containing both Pacific and Caribbean slope vegetation across the continental divide (Fig. 1). Our analysis also covered areas just outside the corridor to the north and south in order to understand whether targeted PES within the corridor had an effect as compared to areas outside of the corridor (Supplementary Fig. S1).
The Paso de las Nubes Biological Corridor study site is located in Costa Rica and bordered by the Children’s Eternal Rainforest, Arenal Volcano National Park, Alberto Manuel Brenes Biological Reserve and Juan Castro Blanco National Park.

Resistance surfaces
We analysed connectivity by creating cost surfaces, which model movement resistance across the landscape, and we combined three environmental variables in order to construct these: land use, slope and road network. The land cover surface was created through object-orientated classification of Terra Advanced Spaceborne Thermal Emission and Reflection Radiometer (ASTER) imagery, produced by NASA with 30-m resolution (Wood et al. Reference Wood, Sheridan, Feagin, Castro and Lacher2017). We created cost surfaces for 2008 and 2012, with 2008 representing the second year of NBCP implementation and 2012 representing 6 years after implementation (Supplementary Texts 4 & 5 & Table S1).
We assigned land uses a value pertaining to potential for landscape connectivity. Land uses with high permeability included areas of native vegetation, and less permeable land uses included non-native vegetation, such as pasture. Urban areas and roads were deemed the most impermeable of surfaces. We also tested the sensitivity of variations on the surface weightings, and while small differences were found based on rating criteria, they did not vary greatly overall (Supplementary Texts 6 & 7 & Fig. S2) (Koen et al. Reference Koen, Bowman and Walpole2012).
Circuitscape
The connectivity model was created using Circuitscape, an open-source ArcGIS extension (McRae et al. Reference McRae, Shah and Mohapatra2013). This tool uses circuit theory, with landscape cost surface representing a conductance surface, and high and low resistance being dependent on the cost surface value. The tool utilizes a network of nodes with different resistance values (McRae et al. Reference McRae, Shah and Mohapatra2013). Results from Circuitscape modelling scenarios were classified using equal interval classes in ArcGIS representing percentage electrical current density (Watts et al. Reference Watts, Klein, Stewart, Ball and Possingham2008, McRae et al. Reference McRae, Popper, Jones, Schindel, Buttrick, Hall, Unnasch and Platt2016). We created two electrical current maps using satellite imagery and land use classification maps in order to represent the following: Scenario A on connectivity in 2008; and Scenario B on connectivity in 2012, showing changes to landscape connectivity post-implementation of NBCP. In each scenario, we reported electrical current density, with higher density indicating areas more suitable for landscape connectivity and lower current densities indicating less suitable areas. We reported the cumulative current for each scenario, defined as the sum of current values within all nodes across all iterations (McRae et al. Reference McRae, Shah and Mohapatra2013). We weighted cumulative currents as percentages in order to allow comparability across scenarios. Pinch points are shown as linear features with high electrical current density, designating areas where connectivity was funnelled into a narrow region.
Connectivity: PES area and current density
In order to determine connectivity change before and after PES prioritization within the NBCP (with new properties included in the programme each year), we conducted a connectivity analysis using electrical current densities from Scenario B (Supplementary Fig. S2). PES area under the various PES categories of forest protection, reforestation and agroforestry, and changes between the two scenarios, can be found in Wood et al. (Reference Wood, Sheridan, Feagin, Castro and Lacher2017) (Table 1). In order to understand connectivity within PES properties, we calculated areas under PES designation and the percentage electrical current density values. We grouped PES properties into three categories: (1) prior to PES-NBCP being established in 2003–2006; (2) after NBCP was established in 2007–2010; and (3) after NBCP was established in 2011–2014. We selected PES property areas from the Scenario B Circuitscape electrical current density map and recorded electrical current densities in those selected areas, grouping them into 10% intervals. If the selected areas had higher connectivity after NBCP enactment, we would expect to see more high-current density areas within Categories 2 and 3 as compared to Category 1. Areas with higher electrical density currents, and hence higher landscape connectivity, were represented in red and orange (51–100%); intermediate areas were represented in yellow and green (31–50%); and low areas were represented by blue and dark blue (0–30%). A least-cost path was also created in order to identify important locations within the corridor (Supplementary Text 8).
Percentage of land cover within a 1 km buffer of the least-cost path (LCP) compared with regional values and the Paso de las Nubes Biological Corridor (CBPN) values.

Results
Circuitscape connectivity model
Across all scenarios we found no north to south connections. This is partially due to the absence of large forest patches and protected areas north or south of the biological corridor, replaced instead by agriculture and urban expansion. All connections for the models are therefore reported from east to west, as the circuit model is rooted in forest patches within the protected areas.
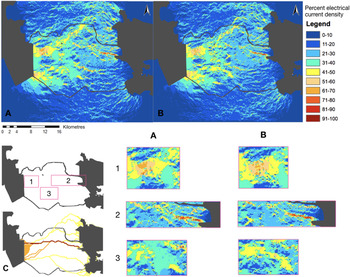
In 2008 (Scenario A), the north-western portion of the corridor supported higher connectivity capacity compared to the eastern side of the corridor (Fig. 2, map A, box 1). This is a result of greater forest areas and a less extensive road network in the western sector of the CBPN. Many pinch points were found along this route, with some regions being only one pixel wide (130 m), including one strong eastern electrical current path precariously connecting to areas to the west across the entirety of the corridor in the north/central half of the CBPN (Fig. 2, map A, box 2). Other areas of connectivity include northern routes outside the CBPN near a large urban centre.
Electrical connectivity using Circuitscape models across the Paso de las Nubes Biological Corridor. The colours represent the percentages of current density across all of the scenarios, with warmer colours representing areas of concentration of current and potential bottlenecks and pinch points within the corridor. Map A represents 2008 connectivity. Map B represents 2012 connectivity. The boxes (1–3) zoom in on particular regions discussed in the text. Map C represents all of the least-cost paths – east to west in yellow and west to east in orange – between eastern Juan Castro Blanco, and western Monteverde and Alberto Brenes protested areas represented in grey, with the bi-directional least-cost path represented in red.

In 2012 (Scenario B), 6 years after NBCP inception, there was higher connectivity on the western side of the CBPN. Additionally, potential connectivity paths to the north, outside the CBPN, were still present. The north-western region of the corridor (Fig. 2, box 1) shows stability in connectivity during the study period due to the high level of forest cover in that area; however, there was a decrease in 61–70% electrical current density in 2012, indicating a slight loss of suitability in the region. The strong electrical current pinch point in Scenario A (Fig. 2, delineated in red and orange in box 2) showed a reduction in width, with new breaks (Fig. 2, box 2). This decline in electrical current occurred after initial construction of the San Carlos highway between 2008 and 2012, which passes directly through that area, creating forest breaks. Additionally, we found two 500-m breaks with currents lower than 40% (Fig. 2, map B, box 2). The south-central area of the corridor showed an increase in current density in 2012, indicating connectivity was concentrated into that region (Fig. 2, map B, box 3).
Scenario A held the maximum cumulative current for all scenarios, with a cumulative current of 100%, whereas the maximum cumulative current for 2012 decreased to 94%. In Scenario A, 98.2% of pixels held an electrical current below 50% and 2.8% held an electrical current above 50% (pale orange to red pixels). In Scenario B, 99.5% of pixels held an electrical current below 50%, and only 0.5% held an electrical current above 50%, showing a decrease in available connectivity routes. Current differences showed both positive and negative changes between the two scenarios by subtracting the 2012 density current map from that of 2008 (Supplementary Fig. S4).
Connectivity: PES area and current density
After the NBCP PES prioritization in 2006, there was an increase in overall PES property area, with the largest total area in Category 3 (PES 2011–2014) (Fig. 3). Immediately after the implementation of NBCP, there was an increase in PES properties holding low current density areas (0–10%) at 4.65 km2 in 2007–2010, compared with 0.27 km2 in 2003 (Fig. 3). There were increases in PES areas with 40–50% current densities (6.96 km2 in 2003–2006; 14.47 km2 in 2007–2010; 17.71 km2 in 2011–2014), and 50–60% current densities (4.31 km2 in 2003–2006; 9.85 km2 in 2007–2010; 9.84 km2 in 2011–2014). Areas with high connectivity (70–100%) showed decreases over time, from 6.07 km2 (2003–2006), to 4.82 km2 (2007–2010) to 1.50 km2 (2007–2014).
Percentage electrical current densities, by area, represented in square kilometres, held within payment for ecosystem services (PES) properties. PES properties are grouped into three categories: (1) PES established before the National Biological Corridor Program (NBCP) from years 2003 to 2006; (2) PES established after the NBCP from years 2007 to 2010; and (3) PES established after the NBCP from years 2011 to 2014. The current densities are reported in 10% intervals and the current values were calculated from Circuitscape Scenario B (2012).

Connectivity: least-cost path and overall corridor connectivity
The least-cost path showed many linkages across western portions of the corridor, while eastern regions held one linear connection (Fig. 2, map C; Supplementary Text 8). While there were no large loss in overall connectivity, there was also no creation of additional wider corridors to prevent future losses of connectivity, the primary goal of NBCP. Portions of connectivity paths were only 130 m wide, and in 2012, two new 500-m forest breaks were created for the San Carlos highway.
Of particular concern was the absence of any strong north–south connectivity within the corridor, equating to little or no within-habitat connectivity, particularly in mountainous areas. As life zones within the biological corridor run from northwest to southeast, there will be limited dispersal pathways for habitat specialists tied to specific elevational bands (Townsend & Masters Reference Townsend and Masters2015).
Discussion
Our research shows that the PES occurs in some spatially important areas for landscape connectivity and forested corridors; however, the spatial scale at which the programme targets payments could be further focused in order to ensure the protection of vulnerable core connection regions, including pinch points where movement is restricted to narrow areas (Pelletier et al. Reference Pelletier, Clark, Anderson, Rayfield, Wulder and Cardille2014). Along those same lines, another scenario could be a deteriorating corridor baseline associated with highway construction and a number of other factors, with PES contributing to positive gains, but with overall gains lacking given the lowering of the baseline. However, the highway is expanding the road network that was previously in place, so the central part of the corridor already has reduced connectivity due to roads, as well as the expanded development along transportation corridors. The highway is extending those impacts, but at the time of the study, the incremental decline in the baseline would not have been large. Overall, because the number of applicants exceeds funds for PES, priority should be given to applicants in these focal areas within the biological corridor. Dairy production and ornamental plant farms are two of the most important economic industries in this region. In order to encourage participation of priority applicants across a diversity of economic backgrounds, payments may need to increase so as to provide sufficient financial incentives that compete with alternative land uses (Zbinden & Lee Reference Zbinden and Lee2005, Gené Reference Gené2007).
The methods used in this paper highlight the utility of connectivity modelling in assessing landscape connectivity with a focus on spatial targeting, which can be incorporated as a tool to complement national efforts to measure the effective management of biological corridors (Canet-Desanti et al. Reference Canet-Desanti, Finegan, Bouroncle, Giterrez and Herrera2008, Chen et al. Reference Chen, Lupi, Vina, He and Liu2010, SINAC 2018). The applications of these approaches are far-reaching as, connectivity and landscape-level policies are becoming increasingly important. Evaluating the success of policies achieving landscape objectives could help us to develop effective, ecosystem-based approaches to address the future impacts of climate change and forest loss (Bellard et al. Reference Bellard, Bertelsmeier, Leadley, Thuiller and Courchamp2012, McGuire et al. Reference McGuire, Lawler, McRae, Nuñez and Theobald2016).
Along with within-habitat connectivity, specificity of land cover and PES type should be incorporated into the decision-making process for selecting the most appropriate interventions in areas at risk of connectivity loss. Although the area under PES has increased dramatically over the duration of this study, important connectivity areas with 60% or greater electrical current density declined and overall connectivity decreased (Fig. 3). Most of the PES area increases have occurred in properties with 50% current density or less. This suggests that the placement has occurred in areas not meeting the objective of increasing landscape connectivity, indicating that payments should be targeted or prices augmented to encourage more strategic investments. These issues illustrate the need for a more targeted and focused approach (Ezzine-de-Blas et al. Reference Ezzine-de-Blas, Wunder, Ruiz-Pérez and del Pilar Moreno-Sanchez2016). Without mitigation measures, changes could cause the CBPN to become a non-functioning corridor landscape.
Contributing to the lack of additional connectivity within the CBPN, there could be a social-scale mismatch between the conservation programme, land use policies and ecological components. Scale mismatches among policy objectives and landscape outcomes can lead to unattainable ecological goals (Cumming et al. Reference Cumming, Cumming and Redman2006). Conservation programmes often function at the landscape scale and encompass a range of ecological gradients and processes, whereas policy mechanisms enact changes at the individual property level. Within the CBPN, this mismatch arises when PES are targeted at the local property scale; however, the objective of the corridor programme, particularly connectivity, functions at the landscape scale. At the property level, landholders and managers are responsible for making bottom-up changes, while regional policies are directed top-down and executed by multiple actors, including governmental and non-governmental organizations (Muñoz-Rojas et al. Reference Muñoz-Rojas, Nijnik, González-Puente and Cortines-García2015). While landowners are often successful at making bottom-up property changes, the scale of change is not spatially appropriate to lend itself to landscape processes. Due to this mismatch, bottom-up property approaches alone will not contribute to large enhancements at the landscape level. The challenge of ecological and policy mismatch in corridor implementation has been illuminated in several case studies (Aryal et al. Reference Aryal, Brunton, Shrestha, Koirala, Lord, Thapa and Adhikari2012, Jain et al. Reference Jain, Chong, Chua and Clements2014, Muñoz-Rojas et al. Reference Muñoz-Rojas, Nijnik, González-Puente and Cortines-García2015). There is a need for more scale-appropriate, corridor-focused goals and actions of conservation policies (Woodley et al. Reference Woodley, Bertzky, Crawhall, Dudley, Londoño, MacKinnon and Redford2012), and one option is to use PES in a strategic manner to enact major changes. Reforestation properties provide opportunities for forest creation, which can close gaps in order to mitigate fragmentation and barriers. Forest protection can provide additional vigilance and control in high forest risk areas, including private forests neighbouring highways and remote, unpatrolled forests near protected areas.
Along with PES and NBCP mechanisms, there are other existing mechanisms within Costa Rica’s environmental policies that could provide opportunities to align landscape-level processes with policy enactment to improve the NBCP. Drawing on proposed corridor ideas presented by Townsend and Masters (Reference Townsend and Masters2015), the lattice corridor design in the CBPN may provide positive gains in conservation programme connectivity goals. The CBPN could prioritize areas identified by Forestry Law Number 75757, which prohibits deforestation along riparian corridors. Incorporating riparian corridors explicitly within the NBCP may provide opportunities for the restoration of historically degraded habitats through reforestation. The western side of the CBPN holds large tracts of forest that maintain elevational connectivity; however, there are no horizontal altitudinal bands (defined as horizontal connections within one elevational level) of forests on either side of the corridor. Enhancements to elevational connectivity on the eastern side are more difficult to implement due to extensive dairy production. These bands may be incorporated into the eastern landscape by creating wider windbreaks on farms, which could benefit connectivity and landholders by providing wind shelter and forage for cattle, as well as timber (Ferber Reference Ferber1958, Harvey Reference Harvey2000, Murgueitio et al. Reference Murgueitio, Calle, Uribe, Calle and Solorio2011). With slight modifications, application of current conservation policies could better enact connectivity within corridors, especially within targeted reforestation projects or with the use of an agglomeration bonus linked to PES property selection so as to coordinate payments in order to spatially link private conservation lands, promoting cooperation among landholders (Parkhurst et al. Reference Parkhurst, Shogren, Bastian, Kivi, Donner and Smith2002, Parkhurst & Shogren Reference Parkhurst and Shogren2007, Fagan et al. Reference Fagan, DeFries, Sesnie, Arroyo-Mora and Chazdon2016).
While modification of current policies and programmes may enhance connectivity, new strategies and policies should be contemplated. One method to enhance connectivity is to establish PES for natural regeneration; natural regeneration is ubiquitous throughout Costa Rica and much of the tropics (Chazdon & Guariguata Reference Chazdon and Guariguata2016). These payments could increase the quality and size of existing forest patches (Saura et al. Reference Saura, Bodin and Fortin2014). Another cost-effective option is reducing the impacts of hard barriers (McRae et al. Reference McRae, Hall, Beier and Theobald2012). Bypassing barriers through the use of underpasses or overpasses can enhance landscape connectivity (Gloyne & Clevenger Reference Gloyne and Clevenger2001, Kleist et al. Reference Kleist, Lancia and Doerr2007). Without barrier mitigation, conservation spends funds that pool efforts on either side of a barrier.
Our study presents evidence that PES properties generally benefit landscape connectivity; however, overall connectivity has decreased within the study corridor over the initial years of the programme. Pressure to complete the highway, compounded by recent government commitments to fast-track construction, makes mitigation for connectivity very timely (Arias Reference Arias2015). The highway was an ever-present and changing factor in the corridor, although the route was decided prior to this study and thus was never eligible for PES selection during that timeframe. The highway likely impacted connectivity throughout all of the study time periods as construction progressed, although given the narrow width of the highway, actual construction itself will not be as impactful as the likely larger future impacts associated with development around the highway. The importance of the highway for dairy production could lead to future pressure to increase livestock grazing (Wood et al. Reference Wood, Sheridan, Feagin, Castro and Lacher2017).
National policy goals are aligned with connectivity; however, policy adaptations need to ensure that actions are implemented at appropriate regional and local levels in order to enable ecological and landscape connectivity. Given the establishment of PES properties as tools used for connectivity in the NBCP, we recommend PES be used to enhance landscape connectivity aligned with scales of ecological processes. As policy-makers and land managers acknowledge the importance of corridors to produce viable ecological landscapes and to promote climate adaptation, it is necessary to adopt an objective-driven approach in order to target conservation interventions in areas at risk of connectivity loss. Conservation interventions may provide beneficial enhancements, including increased forest cover; however, conservation objectives such as landscape connectivity require spatially explicit strategies in order to target conservation interventions for effective conservation planning.
Supplementary material
To view supplementary material for this article, please visit https://doi.org/10.1017/S0376892920000016
Acknowledgements
Thanks are given to Comisión de Desarrollo Forestal de San Carlos (CODEFORSA), Costa Rica National Park Agency and Fondo Nacional de Financiamiento Forestal (FONAFIFO) for local logistical support. Special thanks are given to G Solano, P Castro, L Wolf, B Langley, K Neam, the Woodwards, R Brenes Acuña, Soltis Center staff, E Gonzalez and participating landowners/managers and, finally, to the four anonymous reviewers for their helpful comments.
Financial support
We thank our funding sources: EarthWatch Research Institute, Ecology and Evolutionary Biology and NSF-IGERT Applied Biodiversity Science Programs at Texas A&M University (NSF Grant DGE 0654377). Thank are given to the Soltis Center and to EarthWatch citizen scientists in Tracking Costa Rica’s Mammals.
Conflict of interest
None.
Ethical standards
None.