Introduction
The intestinal immune response to infection with nematodes has been studied intensively in the past few decades, and has become a paradigm for analysis of the regulatory pathways controlling Th2-dependent immune responses (Finkelman et al., Reference Finkelman, Shea-Donohue, Goldhill, Sullivan, Morris, Madden, Gause and Urban1997; Grencis, Reference Grencis1997; Else & Finkelman, Reference Else and Finkelman1999; Cliffe & Grencis, Reference Cliffe and Grencis2004). Much of our understanding of the processes involved is derived from model systems where parasites are rapidly rejected by the host (e.g. Trichinella spiralis, Nippostrongylus brasiliensis, Trichuris muris and Strongyloides ratti). In contrast there are few models of chronic infections, although Heligmosomoides bakeri ( = Heligmosomoides polygyrus; Cable et al., 2006) has been invaluable in this context, as have infections with T. muris in mouse strains that develop chronic infections (Else & Grencis, Reference Else and Grencis1991; Wahid et al., Reference Wahid, Behnke, Grencis, Else and Ben-Smith1994; Hayes et al., Reference Hayes, Bancroft and Grencis2004; Datta et al., Reference Datta, deSchoolmeester, Hedeler, Paton, Brass and Else2005; Wilson et al., Reference Wilson, Taylor, Balic, Finney, Lamb and Maizels2005).
In acute infections the Th2-driven immune response typically induces a cellular inflammation in the intestinal mucosa, which is reflected in a significant infiltration and local proliferation of mast and goblet cells within 1–2 weeks of infection. The influx of both cell types is dependent on type 2 secreted cytokines, notably IL-4, IL-9 and IL-13 (McKenzie et al., Reference McKenzie, Bancroft, Grencis and McKenzie1998; Theodoropoulos et al., 2001; Artis et al., Reference Artis, Wang, Keilbaugh, He, Brenes, Swain, Knight, Donaldson, Lazar, Miller, Schad, Scott and Wu2004; Pennock & Grencis, Reference Pennock and Grencis2006). Eosinophils also aggregate in the mucosa at the sites of infection, their mobilization from the bone marrow appearing initially as a pronounced blood eosinophilia, which has come to be regarded as a hallmark of nematode infections (Klion & Nutman, Reference Klion and Nutman2003), but their numbers in the mucosa take longer to build up and often increase only after the worms have been expelled (Lammas et al., Reference Lammas, Wakelin, Mitchell, Tuohy, Else and Grencis1992). Paneth cells, located in the bases of the crypts of Lieberkuhn, have an important role in antimicrobial mucosal defence. In mice infected with T. spiralis and other intestinal nematodes their numbers increase within a few days of infection, and then decline once the worms have been eliminated (Kamal et al., Reference Kamal, Wakelin, Ouellette, Smith, Podolsky and Mahida2001, Reference Kamal, Dehlawi, Rosa Brunet and Wakelin2002; Elphick & Mahida, Reference Elphick and Mahida2005). Collectively, these cellular changes are accompanied by gross changes of the mucosal architecture, reflected in a reduction of the size of villi and hyperplasia in the crypts (Garside et al., Reference Garside, Grencis and Mowatt1992; Lawrence et al., Reference Lawrence, Paterson, Wei, Liew, Garside and Kennedy2000)
Hookworm infections, which give rise to chronic infections in humans and animals (Behnke, Reference Behnke1987) are known also to stimulate intestinal inflammatory responses, probably the earliest evidence for this going back to Whipple (Reference Whipple1909). They also have a marked effect on intestinal morphology, which has been attributed both to the biting activities of adult worms and to the accompanying host response (Alkazmi et al., Reference Alkazmi, Dehlawi and Behnke2006). Much of the evidence for inflammatory cellular infiltration into the human intestinal mucosa during hookworm infection comes from case studies and endoscopically derived samples obtained from hospitalized subjects, often conducted with a view to assessing effects of infection on absorption of nutrients rather than specifically to assess the nature of the inflammation itself (Layrisse et al., Reference Layrisse, Blumenfeld, Carbonell, Desenne and Roche1964; Aziz & Siddiqui, 1968). These studies indicate that goblet cell hyperplasia is frequently, but not invariably, found in hookworm infections, as are focal accumulations of eosinophils (Chaudhuri & Saha, Reference Chaudhuri and Saha1964). Studies on infected dogs, mostly based on individual animals killed after experimental infection, likewise confirm that cellular infiltration occurs, which it is characterized by the presence of neutrophils, goblet cells and eosinophils and is often focused around sites where worms have recently fed (Kalkofen, Reference Kalkofen1974; Carroll et al., Reference Carroll, Robertson, Papadimitriou and Grove1984, Reference Carroll, Robertson, Papadimitriou and Grove1985). It has been suggested that in species such as Uncinaria stenocephala, which do not bite deep into the mucosa, the mild changes observed may be induced by bacterial secondary infections of the feeding sites (Gibbs, Reference Gibbs1958). More recently, following the invention of the wireless endoscopy capsule, attention has focused on gross changes in the human intestine, and these studies have also shown that intestinal inflammatory responses, described as an eosinophilic enteritis, occur even with mild infections with Necator americanus (Croese & Speare, Reference Croese and Speare2006; Croese et al., Reference Croese, Wood, Melrose and Speare2006). In rodent models, intestinal inflammation has been studied in mice, which are an abnormal host that does not support adult worms (Carroll et al., Reference Carroll, Grove and Heenan1986; Vardhani, Reference Vardhani2003) and preliminary data for infections in hamsters were reported by Garside & Behnke (Reference Garside and Behnke1989), Behnke (Reference Behnke, Gilles and Ball1991) and Behnke et al. (Reference Behnke, Guest and Rose1997).
Nevertheless, despite these studies, little is known about the kinetics of the intestinal response to hookworms and, apart from eosinophils and goblet cells, about changes in other cell types that are characteristic of the intestinal mucosa. This dearth of quantitative information on the chronological sequence of changes cellular changes in the intestinal mucosa of inflammatory cell types, prompted us to investigate cellular changes in the intestinal mucosa of hamsters infected with Ancylostoma ceylanicum. In this paper, focusing on mast cell, goblet cells and Paneth cells, we first established the baseline levels of inflammatory cells in uninfected hamsters, quantified changes with time after infections of varying intensity and finally we assessed the time course of recovery and restoration to normal levels once the worms had been removed by chemotherapy. These data provide a robust baseline for further studies on the factors regulating intestinal inflammation during hookworm infections and for the assessment of the consequences for intestinal integrity of prophylactic treatments currently under development.
Materials and methods
Ancylostoma ceylanicum
The strain of A. ceylanicum used has been maintained at the University of Nottingham since 1984 and was originally obtained from Dr Rajasekariah of Hindustan CIBA-Geigy Ltd., Bombay, India. It is believed to be of dog origin. The methods employed for maintenance of the parasite, for worm recovery and faecal egg counts have all been described previously in full (Garside & Behnke, Reference Garside and Behnke1989; Behnke et al., Reference Behnke, Guest and Rose1997).
Hamsters
Golden hamsters (DSN strain) were originally obtained from Harlan Olac in 1983 and since then have been maintained in the animal house of the School of Biology as a closed colony. Animals were kept under conventional animal house conditions. Pelleted food and tap water were supplied ad libitum. Cages were cleaned twice weekly to prevent reinfection. Animals were first weighed 1 or 2 weeks before infection and thereafter twice weekly until the completion of each experiment.
Since the colony was maintained under conventional animal house conditions, the animals were exposed to various micro-organisms present in the environment. In order to prepare hamsters for infection and reduce other competing intestinal micro-organisms, all animals allocated to experiments were pre-treated for 1 week with Emtryl (May and Baker, dimetridazole at a concentration of 1 g l− 1 in drinking water), then for another week with Terramycin (Pfizer, oxytetracycline hydrochloride, 3 g l− 1 in drinking water), and were returned to normal drinking water for 1 week prior to infection.
Worms were removed from infected animals (Experiment 5) by treatment with ivermectin (‘Ivomec super’ MSD AGVET, Division of Merk Sharp and Dohme Limited, The Netherlands) at 200 μg kg− 1 body weight.
Quantification of cell numbers in the intestinal mucosa
At autopsy, three pieces of tissue were taken from the intestine (each about 1 cm2) approximately 10 cm below the pyloric sphincter. These were fixed using standard procedures in Carnoy's, 10% formalin or mercuric chloride and tannic acid (MT) fixatives, respectively, washed thoroughly with 70% ethanol solution and then processed using a pre-programmed electronic SHANDON Citadel Histokinette. Tissues were embedded in pure paraffin wax, left and sectioned at 6 μm (Reichert-Jung, Microtome 2050 Supercut, Cambridge Instruments GmbH).
For goblet cells, formalin-fixed sections were stained with Alcian blue (pH 2.5) and Schiff reagent. For Paneth cell counts, formalin-fixed sections were stained in Carazzi's haematoxylin phloxin stain and tartrazine. Sections fixed in Carnoy's for mast cell counts were stained with Alcian blue and Safranin O. Eosinophil counts were carried out on MT-fixed material stained in 1% Astra blue and Chromotrope 2R (Kamal et al., Reference Kamal, Wakelin, Ouellette, Smith, Podolsky and Mahida2001; Dehlawi & Wakelin, Reference Dehlawi and Wakelin2002; Alkazmi, Reference Alkazmi2004).
In Experiment 1 cells were counted in every 20 villous/ crypt units (VCU) of tissue and the results were expressed in terms of number of cells/VCU. For all the remaining experiments, counts were based on a method using a Weible 2 graticule. The area covered by the graticule was first determined at each magnification with a calibrated micrometer slide. At × 200 magnification the area was 1.172 mm2. The number of cells was expressed as cells mm− 2 of mucosal tissue, as recommended by Kermanizadeh et al. (Reference Kermanizadeh, Crompton and Hagan1997). Stained Paneth cells were counted in 20 crypts from each animal and the mean value per crypt was calculated.
Experimental design
The effect of infection with Ancylostoma ceylanicum on the numbers of goblet, mast and Paneth cells in the mucosa
Two experiments were carried out to monitor the time course of changes in cell numbers in the intestinal mucosa. In Experiment 1, 26 hamsters and in Experiment 2, 30 hamsters were infected with 100 L3, and 14 and 15 hamsters, respectively, were left uninfected as the control groups. Infected hamsters were killed in groups of 3–5 at weekly intervals from day 7 to day 42 post infection (p.i.). Control groups of 4–5 were killed on the first day of the experiment (day 0, when the infection was given to the experimental group), day 14 and day 42.
The effect of varying the worm burden with Ancylostoma ceylanicum on the numbers of goblet, mast and Paneth cells in the mucosa
In two experiments the larval dose given was varied to see whether the intensity of cellular changes was dependent on the number of worms present. In Experiment 3, 50 hamsters were used, 10 of which were left uninfected, and 40 were infected with 50 L3 (10 hamsters), 100 L3 (10), 150 L3 (5), 200 L3 (5) or 250 L3s (5). On day 12 after infection 5 hamsters from each group were killed to assess worm burdens and intestinal architecture. The remaining animals (5 controls, 5 each infected with 50 and 100 L3s) were killed 18 days later on day 30 p.i. The infections in animals destined for autopsy on day 30, were restricted to 100 and below to limit possible mortality. Experiment 4 comprised 30 hamsters, 5 uninfected naïve control animals and 5 each infected with 30, 60, 100, 150 and 200 L3. All the animals were killed for worm counts and assessment of intestinal architecture on day 20 p.i.
The effect of removing adult Ancylostoma ceylanicum on day 28 after infection on the numbers of goblet, mast and Paneth cells in the intestinal mucosa
Experiment 5 comprised 60 female hamsters. Fifteen (group 1) were not infected or treated and provided naïve control data on days 28, 49 and 63 of the experiment. Twenty five animals (group 2) were infected with 50 L3 and were autopsied on days 28, 35, 42, 49 and 63 p.i. The final group (group 3) comprised 20 animals infected as in group 2, but given a single oral dose of ivermectin on day 28 p.i. and autopsied on days 35, 42, 49 and 63 p.i.
Statistical analysis
The frequency distributions of data were tested for goodness of fit to negative binomial, positive binomial and Poisson models by χ2 as described by Elliott (Reference Elliott1977), using bespoke software. Analysis was then by two-way analysis of variance (ANOVA) with normal error structures (SPSS version 12.0.1; SPSS Inc., Chicago, Illinois, USA). Each model was assessed for goodness of fit by R 2, and the residuals were checked for approximately normal distribution. We provide values for the main effects of treatment and the interactions between treatment and time, since these were most relevant to the hypotheses being tested. Correlations between worm burdens and numbers of cells were assessed by Spearman's rank correlation test. In all statistical tests we considered P = 0.05 as the cut-off for significance.
Results
Range of values observed in uninfected hamsters
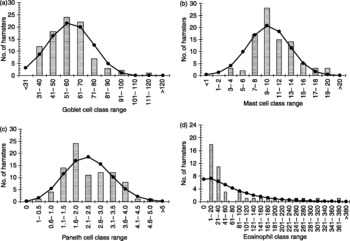
There is very little information available in the literature on the range of normal values for goblet cell, mast cell, Paneth cell and eosinophil counts in the intestine of hamsters (but see Shi et al., Reference Shi, Ishikawa, Itoh, Khan, Tsuchiya, Horii and Nawa1995). Therefore, we first pooled data from a range of experiments. Forty-five of these values were from hamsters that contributed to the experiments reported later in this paper, and 45 were from other experiments. For eosinophils all the data were from other experiments (n = 44).
The mean number of goblet cells mm− 2 of intestinal tissue was 56.4 ± 1.6 (n = 89). The variance was greater than the mean (225.8) and the best-fit distribution was negative binomial ( , P = 0.6), although it was also not significantly different from the normal distribution (
 , P = 0.5). As can be seen from fig. 1a most counts were in the 40–70 goblet cells mm− 2 range but there were also some values exceeding 100 per mm2.
Frequency distributions for goblet cell (a), mast cell (b), Paneth cell (c) and eosinophil counts (d) from uninfected, naïve hamsters. The dataset is based on 89–90 (a, b and c) or 44 (d) hamsters pooled from a number of experiments, to show the range of values that were obtained with naïve hamsters from our colony. These values therefore form the baselines for these parameters against which changes in infected animals were assessed. All values are in numbers of cells per mm2 of mucosal tissue. Columns show the number of hamsters in each class range and the line graph the best-fit expected distribution for each dataset. For (a), (c) and (d) the best-fit (expected) distribution is the negative binomial, whereas for (b) the illustrated expected distribution is normal. For statistical analysis see text.

Mast cell counts per mm2 were considerably lower, as expected, with an average of 10.3 ± 0.4 (n = 90), with again some values out of the normal distribution (variance was 11.6). The distribution was accounted for satisfactorily by the normal distribution ( , P = 0.27) and also by the negative binomial distribution (
 , P = 0.5).
The mean number of Paneth cells/crypt was 2.5 ± 0.24 per mm2 (n = 89), but we excluded one animal with an extreme value of 21.75. The variance was 5.1, indicating overdispersion, and the distribution was best accounted for by the negative binomial model ( , P = 0.19). It did not conform to a normal distribution (
 , P = 0.006).
Eosinophils were the most variable of all cells, with most hamsters showing fewer than 50 per mm2, but again there were some extreme outriders in excess of 250 cells mm− 2 even among these naïve animals. The mean count, including all outriders, was 65.0 ± 13.2 (variance = 7668.9, n = 44), and the overdispersion was so extreme that it could not be tested reliably because of too few degrees of freedom, although by eye, the best fit was the negative binomial and this is illustrated in fig. 1d.
Temporal changes in cell numbers during infection with Ancylostoma ceylanicum (Experiments 1 and 2)
Worm burdens
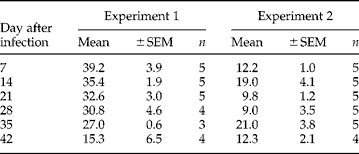
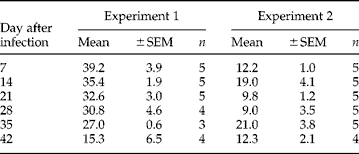
The worm burdens recovered at autopsy from the infected animals are summarized in table 1. These data have already been published, see Alkazmi et al. (Reference Alkazmi, Dehlawi and Behnke2006) for the statistical analysis. The table shows that in Experiment 1, in which the initial worm burdens were higher, worms were lost steadily throughout infection, but more rapidly towards the end of the period of observation, whereas in Experiment 2, where the initial worm burdens were lower, there was no significant loss of worms.
Worm burdens at autopsy in Experiments 1 and 2.
Effect of infection on the goblet cell numbers
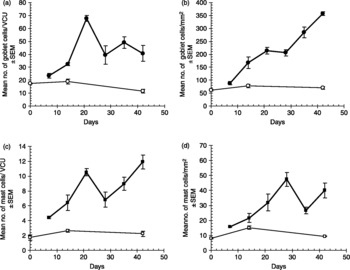
In both experiments there was a marked rise in goblet cell numbers with time after infection, irrespective of the method of quantification (in fig. 2a values are in cells/VCU, whereas in fig. 2b they are in cells mm− 2). The levels in naïve hamsters were of the same order but slightly higher (means in the range 12–17 goblet cells/VCU in Experiment 1) than those reported by Shi et al. (Reference Shi, Ishikawa, Itoh, Khan, Tsuchiya, Horii and Nawa1995) (approximately 8/VCU) who also quantified cells in terms of cells/VCU. The mean values in naïve control hamsters in Experiment 2 (fig. 2b), where the values were expressed as goblet cells mm− 2 of mucosal tissue, were well within the normally expected range (fig. 1a). In both experiments, there was a highly significant difference between infected and treated groups (two-way ANOVA with infection and time as factors, main effect of infection, for Experiment 1, F 1,27 = 34.9, P < 0.001, adjusted model R 2 = 87.5%; for Experiment 2, F 1,36 = 180.6, P < 0.001, adjusted model R 2 = 93.0%). There was also a significant divergence between the groups with time (two-way interaction between time and infection, for Experiment 1, F 2,27 = 5.7, P = 0.009; for Experiment 2, F 2,36 = 61.5, P < 0.001). Although in Experiment 1 there were signs of a peak on day 21, followed by a subsequent decline in goblet cell numbers, in Experiment 2 the values for goblet cells kept increasing until the end of the experiment.
Changes in goblet and mast cell numbers after infection with Ancylostoma ceylanicum in Experiments 1 (a and c) and 2 (b and d). Control groups are represented as open circles (a, b, goblet cells) and open squares (c, d, mast cells). Infected animals are given as filled circles (a, b, goblet cells) and filled squares (c, d, mast cells). Note that in Experiment 1 cells were quantified as cells per villous/crypt unit (VCU), whereas in Experiment 2 the counts were cells/mm2 of intestinal mucosa. For statistical analysis see text.

Effect of infection on mast cell numbers
As with goblet cells, mast cell counts rose rapidly, whether quantified by cells/VCU or by cells mm− 2 (figs 2c and d). Mean values in Experiment 1 in naïve animals were in the range 1–2 mast cells/VCU, which compares well with Shi et al. (Reference Shi, Ishikawa, Itoh, Khan, Tsuchiya, Horii and Nawa1995), who found 3–4 mast cells/VCU, and Behnke et al. (1994a), who reported 2.5 mast cells/VCU. The difference between treatment groups (uninfected naïve controls and infected animals) was highly significant in both cases (two-way ANOVA with infection and time as factors, main effect of infection, for Experiment 1, F 1,27 = 89.8, P < 0.001, adjusted model R 2 = 86.0%; for Experiment 2, F 1,34 = 36.8, P < 0.001, adjusted model R 2 = 77.5%). Similarly, the divergence between groups with time was highly significant in both cases (two-way interaction between time and infection, for Experiment 1, F 2,27 = 13.6, P < 0.001; for Experiment 2, F 2,34 = 9.9, P < 0.001). In both experiments there was an overall increase in cell counts with time, and interestingly in both a temporary drop in cell counts, but on different days (day 28 in Experiment 1 and day 35 in Experiment 2).
Effect of infection on Paneth cell counts
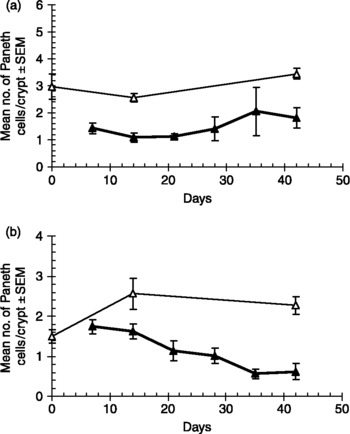
Unexpectedly, in both experiments Paneth cell numbers fell as a consequence of infection. In Experiment 1 there was only a significant effect of infection, and no interaction between infection and time (two-way ANOVA with infection and time as factors, main effect of infection; F 1,29 = 32.3, P < 0.001, adjusted model R 2 = 53.8%). This is illustrated in fig. 3a, where the numbers of Paneth cells in infected animals can be seen to have stabilized at about 50% of the numbers in naïve control groups. In Experiment 2, Paneth cell numbers can be seen to decline continually until the last 2 weeks of the experiment (fig. 3b). The difference between infection groups was significant (main effect of infection, F 1,36 = 18.4, P < 0.001, adjusted R 2 = 60.7%), and there was also a significant interaction (two-way interaction between infection and time F 1,36 = 9.12, P = 0.001), indicating divergence between the infection groups.
Changes in Paneth cell numbers after infection with Ancylostoma ceylanicum in Experiments 1 (a) and 2 (b). Naïve control groups are shown by open triangles and infected animals are the filled triangles. In both experiments Paneth cells were counted as cells/crypt. For statistical analysis see text.

The effect of varying the worm burden on the numbers of goblet, mast and Paneth cells in the intestinal mucosa
The relationship between the number of cells mm− 2 and worm burdens was analysed on days 12 (Experiment 3), 20 (Experiment 4) and 30 (Experiment 3) after infection. Worm burdens covered a larger range on day 12 (when worms were still relatively small and had only just begun to take blood), but were limited to 35 and 36 worms on days 20 and 30 respectively, to avoid excessive pathology in hamsters.
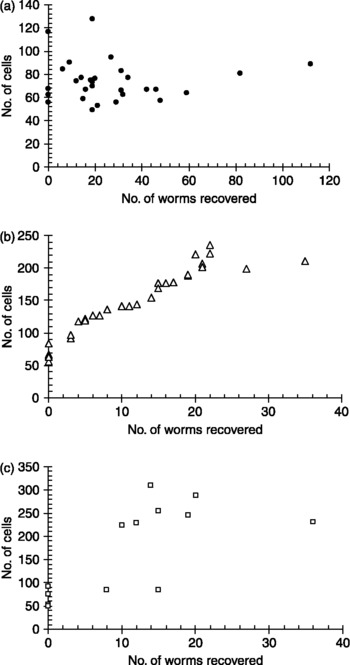
Twelve days after infection goblet cell numbers were mostly in the range of the naïve control (fig. 1a), although one hamster in the uninfected group had an unexpectedly high count, as did one of those carrying 19 worms (fig. 4a). Overall, there was no significant relationship between worm burden and goblet cell numbers (R s = − 0.055). However, by day 20 the relationship between worm burden and goblet cell numbers was positive, almost linear in nature and highly significant (R s = 0.984, n = 30, P < 0.001) (fig. 4b). Animals infected with more than three worms had goblet cell counts ranging from 118 to 236 goblet cells mm− 2 of intestinal mucosa. By day 30 some hamsters had counts exceeding 300 goblet cells mm− 2, although two infected animals showed counts within the normal range (fig. 4c). Nevertheless, there was still a highly significant positive relationship between the number of worms recovered and goblet cell counts (R s = 0.799, n = 14, P = 0.001).
The relationship between the number of worms recovered and the number of goblet cells mm− 2 of intestinal mucosa in hamsters infected with varying doses of larvae: (a) day 12 p.i.; (b) day 20 p.i.; and (c) day 30 p.i.

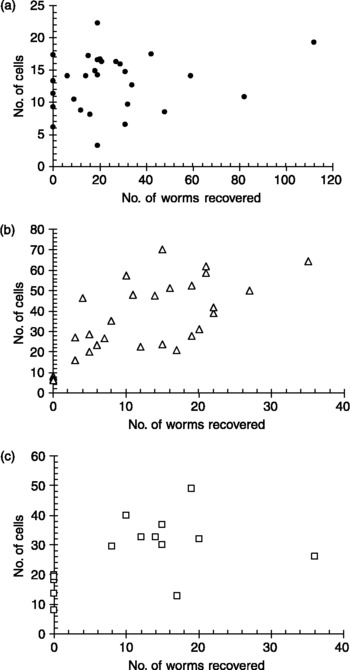
As with goblet cells, mast cell numbers did not correlate with worm burdens on day 12 p.i. (fig. 5a) (R s = 0.185, n = 29, P = 0.3) but showed a strong positive correlation on day 20 (fig. 5b) (R s = 0.725, n = 30, P < 0.001). On day 30 p.i. the correlation was still positive but weaker and only just outside significance (fig. 5c) (R s = 0.48, n = 15, P = 0.067). Particularly on day 30 p.i., but also to some extent on day 12 p.i., some values in control naïve hamsters were towards the top end of the normal range (fig. 1b), perhaps suggesting a mild contaminating intestinal infection.
The relationship between the number of worms recovered and the number of mast cells m− 2 of intestinal mucosa in hamsters infected with varying doses of larvae: (a) day 12 p.i.; (b) day 20 p.i.; and (c) day 30 p.i.

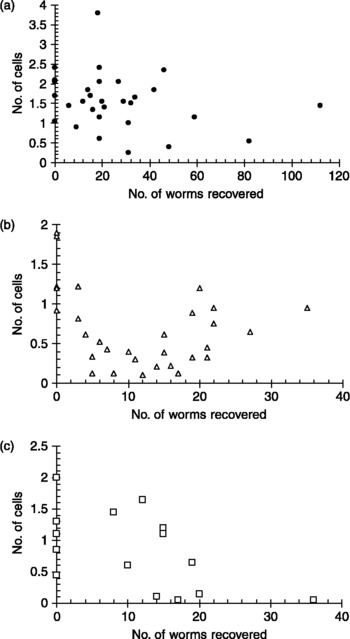
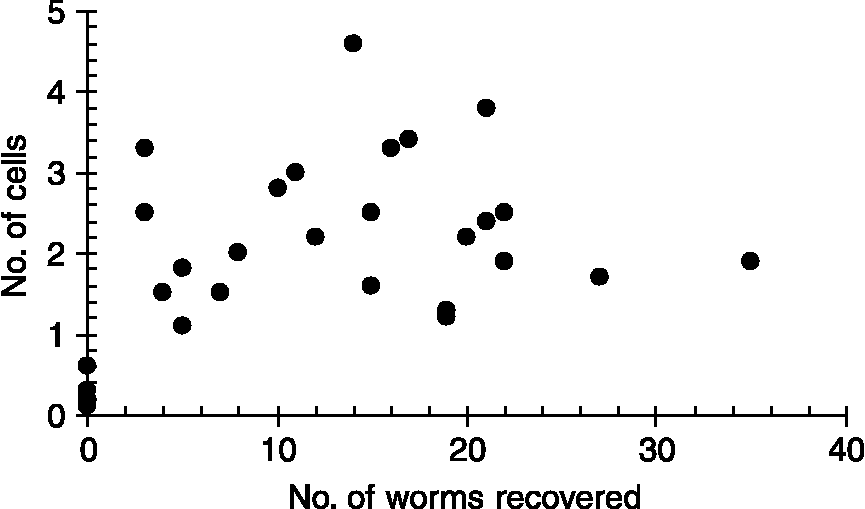
As in Experiments 1 and 2, infection with A. ceylanicum generally caused a reduction in Paneth cell numbers (see below, all correlation coefficients were negative). On day 12 p.i. the relationship was just outside the cut-off for significance (fig. 6a) (R s = − 0.32, n = 30, P = 0.088), and certainly from fig. 6a the tendency for lower counts is evident in animals carrying the heavier worm burdens. In contrast to the results for goblet and mast cell counts, there was no significant correlation between worm burdens and Paneth cell counts on day 20 p.i. (R s = − 0.26, n = 30, P = 0.17), and in fig. 6b it can be seen that while the animals carrying the lighter infections did indeed show a reduction in Paneth cell numbers, some of those carrying heavier infections had counts towards the lower end of the normal range (fig. 1c). However, by day 30 p.i. the correlation had improved and was significant (R s = − 0.55, n = 15, P = 0.035).
The relationship between the number of worms recovered and the number of Paneth cells mm− 2 of intestinal mucosa in hamsters infected with varying doses of larvae: (a) day 12 p.i.; (b) day 20 p.i. and (c) day 30 p.i.

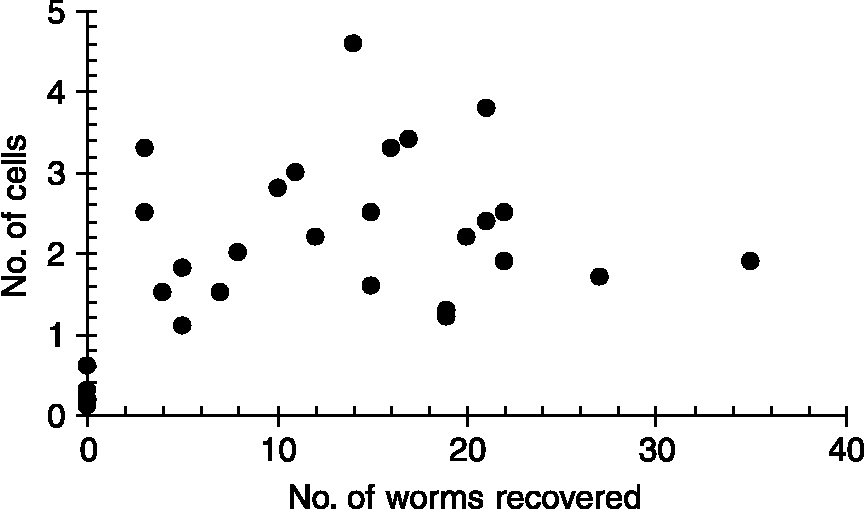
Eosinophil numbers were quantified reliably only in Experiment 4, in which hamsters were autopsied 20 days p.i. Figure 7 shows that eosinophil counts were elevated in infected animals, and whereas there was an overall significant positive correlation in this dataset (R s = 0.443, n = 29, P = 0.016), when the analysis was conducted only on infected animals, the relationship disappeared completely (R s = 0.022, n = 24, P = 0.9). Eosinophil counts were therefore generally higher in infected animals compared with uninfected, but the relationship was not dose-dependent.
The relationship between the number of worms recovered and the number of eosinophils/mm2 of intestinal mucosa in hamsters infected with varying doses of larvae and killed 20 days after infection (Experiment 4).
The effect of removing Ancylostoma ceylanicum on the numbers of goblet, mast and Paneth cells in the intestinal mucosa
All the hamsters in group 2 became infected (mean worm recoveries on days 28, 35, 42, 49 and 63 after infection were 10.0 ± 2.1, 19.4 ± 4.5, 14.8 ± 4.1, 9.2 ± 1.5 and 8.4 ± 1.0, respectively) and there was no significant difference in worm burden with time after infection. Faecal egg counts on days 22 and 23 after infection in group 3 also indicated that every animal carried worms (for full details, see Alkazmi et al., Reference Alkazmi, Dehlawi and Behnke2006) and subsequent treatment with ivermectin was completely effective, since 3 and 4 days after treatment all faecal egg counts in this group were completely negative and no worms were recovered at autopsy from any of these animals.
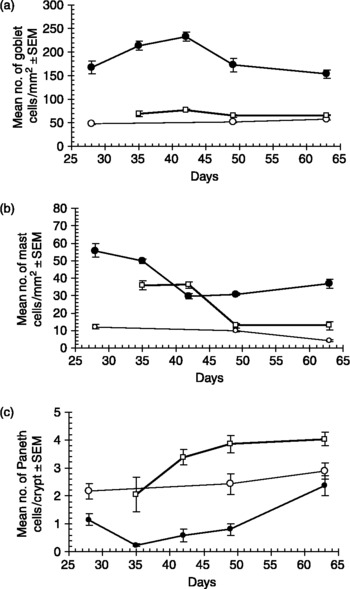
The results from this experiment are summarized in fig. 8. As in earlier experiments, infection with A. ceylanicum stimulated a potent goblet cell response (fig. 8a) (two-way ANOVA with treatment and time after infection as factors, main effect of treatment, F 2,47 = 336.4, P < 0.001, adjusted model R 2 = 93.5%) but, as can be seen, goblet cell numbers dropped to control levels within 7 days of treatment (two-way interaction between treatment and time, F 5,47 = 4.96, P = 0.001). By day 35, goblet cell numbers in ivermectin-treated animals were almost at normal levels, whereas those in infected not-treated animals remained high throughout.
Change in numbers of goblet cells (a), mast cells (b) and Paneth cells (c) in uninfected naïve hamsters (open circles), hamsters infected with Ancylostoma ceylanicum on day 0 (closed circles) and hamsters infected with A. ceylanicum on day 0 but then treated with ivermectin on day 28 after infection (open squares).

Similarly, mast cell numbers were low in naïve animals (fig. 8b), within the usual range (means < 13 cells mm− 2), and were high in infected animals on the day of treatment (day 28 p.i.) (main effect of treatment, F 2,48 = 192.7, P < 0.001, adjusted model R 2 = 93.1%). They remained high for almost 2 weeks after treatment, but then fell to control naïve levels by day 49, 21 days after treatment (two-way interaction, treatment × time, F 5,48 = 23.5, P < 0.001).
As in previous experiments, Paneth cell numbers dropped significantly in infected animals and were clearly well below those of naïve animals on days 28 and 35 after infection (two-way ANOVA with treatment and time, main effect of treatment F 2,47 = 56.4, P < 0.001, adjusted model R 2 = 73.7%). After this they began to rise slowly, but consistently, to almost reach the levels in naïve animals by the end of the experiment (day 63 p.i.). Removal of worms on day 28 p.i. restored normal numbers of Paneth cells in infected, ivermectin-treated animals within 7 days of treatment, but then caused a rebound effect with numbers rising higher than those in the naïve control group. Although consistently higher than values in naïve hamsters between 42 and 63 days p.i. (14–35 days after treatment), the means were still within the upper range of values typically encountered in uninfected hamsters from our colony (fig. 1c). The two-way interaction between treatment and time was not significant in this experiment (F 2,47 = 1.6).
Discussion
The experiments described in this paper show clearly that the hookworm A. ceylanicum rapidly induced a potent cellular inflammatory response in the hamster intestine, which was reflected in hyperplasia of mast cells, goblet cells and eosinophils. The rise in mast cell counts is consistent with earlier reports (Garside & Behnke, Reference Garside and Behnke1989; Behnke, Reference Behnke, Gilles and Ball1991; Behnke et al., Reference Behnke, Guest and Rose1997), as is that for goblet cells (Garside et al., 1990), but to the best of our knowledge, Paneth cells have not been assessed previously in this system. Counter-intuitively, given data from intestinal nematode–mouse models (Kamal et al., Reference Kamal, Wakelin, Ouellette, Smith, Podolsky and Mahida2001), the intestinal response was characterized by a fall in Paneth cell numbers. All these changes in cell populations in the mucosa were dependent on the presence of adult worms, and normal levels were restored soon after worms were removed by treatment, although some cell types returned to baseline more quickly than others (e.g. goblet cell numbers dropped rapidly but it took mast cells over 2 weeks to return to normal). There was a clear ceiling effect in terms of mast and goblet cell numbers in relation to increasing worm burdens, but certainly in the early stages of infection, on day 20, soon after the worms become fecund (Garside & Behnke, Reference Garside and Behnke1989), a dose-dependency was evident (for similar data on T. spiralis, see also Dehlawi & Wakelin, Reference Dehlawi and Wakelin1995, Reference Dehlawi and Wakelin2002). Heavier infections caused more intense goblet and mast cell hyperplasia, and reduced Paneth cell numbers more severely than lighter infections.
The increases in goblet and mast cells with time after infection were particularly dramatic. Both cell types are known to contain and secrete extremely potent bioactive molecules, and while there has been considerable interest in the role of mast cells in the past, more recently attention has focused on the role of goblet cells. This has been stimulated by the realization that mucus comprises a range of molecules with different properties (Ishikawa et al., Reference Ishikawa, Horii and Nawa1993), and that the qualities of mucus change during intestinal nematode infections (Yamauchi et al., Reference Yamauchi, Kawai, Yamada, Uchikawa, Tegoshi and Arizono2006). Candidate molecules that have been singled out and have attracted attention recently include those among the mucus molecules themselves (Muc2 gene products; Webb et al., Reference Webb, Hoque and Dimas2007) and molecules contained within the mucus (RELMβ/FIZZ2 (Artis et al., Reference Artis, Wang, Keilbaugh, He, Brenes, Swain, Knight, Donaldson, Lazar, Miller, Schad, Scott and Wu2004) and the lectin encoded by the Intellectin-2 gene (Pemberton et al., Reference Pemberton, Knight, Gamble, Colledge, Lee, Pierce and Miller2004; Nair et al., 2006)). Whether these same or similar potential effector molecules exist in the mucus of hamsters is not known, but there is no reason for supposing otherwise, since at least some are found in rats, mice and humans (Steppan et al., Reference Steppan, Brown, Wright, Bhat, Banerjee, Dai, Enders, Silberg, Wen, Wu and Lazar2001). This, in turn, implies that their effectiveness in resisting hookworm infections is weaker than that against murine nematodes, a conclusion that may not be surprising since the remarkable resilience of hookworms to a hostile surrounding environment is well known. They can survive intense acute inflammatory responses generated by other pathogens (Behnke et al., 1994b), to cause the typically long-lasting infections in the hosts that they parasitize.
The chronic persistence of hookworms was associated with chronic intestinal inflammation, reflected in highly elevated concentrations of goblet and mast cells that lasted for at least 9 weeks (Experiment 5, the longest experiment reported here), and worms remained resident in the intestine throughout. This was quite different from the changes seen in the intestinal mucosa during the typically brief infections caused by murine nematodes. In the latter, goblet and mast cell numbers fall rapidly, generally some 2–4 weeks after infection, when the worms have been cleared by immune responses. Yet, despite these chronic changes, which must, to some extent, impair digestion and the uptake of nutrients from the gut, the hamsters survived throughout and did not lose weight excessively (data not shown).
Unexpectedly, Paneth cell numbers fell after infection. This was in complete contrast to our expectations and the known kinetics of Paneth cell numbers following infection with, for example, T. spiralis (Kamal et al., Reference Kamal, Wakelin, Ouellette, Smith, Podolsky and Mahida2001) and T. muris (Schopf et al., Reference Schopf, Hoffman, Cheever, Urban and Wynn2002). Although, in any case, Paneth cells were low in naïve hamsters in comparison to other cell types (average of 2.5 cells/crypt), they were similar to the numbers usually encountered in mice (2–5/crypt). Despite this low baseline, numbers clearly dropped soon after infection, and this fall was observed consistently in all the experiments reported here (and in others, manuscripts in preparation). That this was a real fall in cells per crypt was also supported by observations following the removal of worms. In this situation, Paneth cell numbers returned to normal within a week, but there then followed a rebound effect, with numbers rising well above control levels. Hamsters are known to have Paneth cells with granules that are similar to those in other rodents and mammals, at least at the electron microscope level (Satoh et al., Reference Satoh, Yamano, Matsuda and Onon1990). The biology of these cell has been reviewed recently (Elphick & Mahida, Reference Elphick and Mahida2005) and their numbers in crypts are believed to be controlled by a unique non-thymus-dependent mucosal T-cell population (Kamal et al., Reference Kamal, Wakelin, Ouellette, Smith, Podolsky and Mahida2001). Hookworms are known to secrete a range of bioactive molecules, some of which are believed to play a role in their survival strategy in the face of the host immune system (Loukas & Prociv, Reference Loukas and Prociv2001; Pritchard & Brown, Reference Pritchard and Brown2001; Ghosh et al., Reference Ghosh, Wu, Antione, Bottazzi, Valenzuela, Hotez and Mendez2006). One interpretation of our results is that among the secretions of A. ceylanicum are molecules that preferentially target this particular mucosal T-cell population, block its cytokines or interfere with cytokine receptors, in contrast to the thymus-derived, CD4+ helper cells that drive the type 2 responses (since mastocytosis and goblet cell hyperplasia were not downregulated). Equally, it could be that hookworm secretions acted directly on Paneth cells or their precursors. It may be pertinent that Kamal et al. (Reference Kamal, Dehlawi, Rosa Brunet and Wakelin2002) found that in mice infected with H. bakeri, the initial rise in Paneth cell numbers peaked on day 8 and fell thereafter, just as the adult worms, which are known to be immunodepressive, accumulated in the intestinal lumen. A key difference, however, between that experimental model and the present one is that, in H. bakeri, infection mast cell hyperplasia is virtually abolished in primary infections (Dehlawi et al., Reference Dehlawi, Wakelin and Behnke1987), in contrast with the pronounced mastocytosis that we observed. A final possibility is that, having exhausted their secretions, soon after the arrival of larvae in the mucosa, these cells did not regenerate phloxine–tartrazine-positive inclusions as rapidly, giving the illusion of lower cell numbers. At this stage we cannot distinguish between these hypotheses, but they are the subjects of further investigations.
Finally, the experiments reported here have, for the first time, provided clear quantitative data on the time course of changes in cell populations in the intestinal mucosa of animals infected with hookworms. They have confirmed and extended earlier observations on goblet cells, provided novel data on mast cells and revealed an intriguing relationship with Paneth cells. Since hookworm infections in hamsters are now becoming increasingly popular as models for evaluating the efficacy of candidate antigens for a human hookworm vaccine (Ali et al., Reference Ali, Brown, Stanssens, Timothy, Soule and Pritchard2001; Chu et al., Reference Chu, Bungiro, Ibanez, Harrison, Campdonico, Jones, Mieszczanek, Kuzmic and Cappello2004; Mendez et al., Reference Mendez, Zhan, Goud, Ghosh, Dobardzic, Wu, Liu, Deumic, Dobardzic, Liu, Bethony and Hotez2005; Hotez et al., Reference Hotez, Bethony, Botazzi, Brooker, Diemert and Loukas2006), the data in this paper will help to inform experimental design in trials evaluating safety and side effects at the intestinal level.
Acknowledgements
We thank the Ministry of Higher Education of the Kingdom of Saudi Arabia for the provision of a postgraduate studentship for L.M.M.A. and for travel funds for M.S.D. We thank Professors D. Wakelin and Y. Mahida for their advice on earlier drafts of this manuscript.