Introduction
Genetically modified cotton (Gossypium hirsutum L.) has proved to be one of the main socio-ecological alternatives for textile agribusiness in the central-western region of Brazil, since it generates employment and creates income for rural and industrial producers, as well as cutting the quantity of chemicals used to control the pests that attack the conventional cotton crop. After more than a decade of commercial cultivation, transgenic Bt cotton (cotton genetically modified with Cry toxic protein genes produced by gram-positive bacteria, Bacillus thuringiensis Berliner (Bacillales: Bacillaceae) is now considered a major advance in lepidopteran pest management in all the main cotton-producing countries (James, Reference James2004; Guoping et al., Reference Guoping, Hongqiang, Yulin, Kris and Kongming2010).
The growth and development of this crop in Brazil could be affected by constant attacks by non-target pests. Aphis gossypii Glover (Hemiptera: Aphididae) is one of the main non-target pests that attacks transgenic cotton, causing direct damage by sucking of phloem and harming the plant indirectly through the transmission of virus infections (Sujii et al., Reference Sujii, Togni, Nakasu, Pires, Paula and Fontes2008). Studies carried out to date have not produced any evidence that Bt crops, expressing the Cry1A protein used for controlling lepidopteran pests, have any direct effect on aphids (Schuler et al., Reference Schuler, Denholm, Jouanin and Clark2001, Reference Schuler, Clark, Clark, Poppy, Stewart and Denholm2005). This is because the Bt protein is not ingested by aphids, since they feed directly on the sap in the phloem. However, some studies have documented significant quantities of Cry proteins in aphid samples (Zhang et al., Reference Zhang, Wan, Lovei, Liu and Guo2006; Burgio et al., Reference Burgio, Lanzoni, Accinelli, Dinelli, Bonetti, Marotti and Ramilli2007). According to Liu et al. (Reference Liu, Zhai, Zhang and Zong2005), the aphid population may develop more rapidly on Bt cotton plants than non-Bt plants. Rodrigues et al. (Reference Rodrigues, Fernandes and Santos2010) reported that Bt cotton changes the normal dispersion pattern of A. gossypii in the crop. Therefore, there is no exact knowledge of how genetically modified cotton plants affect populations of A. gossypii that interact within the agro-ecosystem. Knowledge of a possible alteration in the distribution of A. gossypii when infesting Bt cotton crops could change the way that this species is sampled on this host.
Knowledge of the vertical and temporal distributions of insect pests on the host plant is important for developing effective Integrated Pest Management (IPM) programmes (Trichilo et al., Reference Trichilo, Wilson and Mack1993), saving time and cutting costs of pest monitoring, without adversely affecting the reliability of the results (Wilson et al., Reference Wilson, Gutierrez and Hogg1982). Aphids are generally observed with greater frequency on the upper and middle parts of plants, possibly because leaf tissue is softer and easier for the aphids to penetrate and extract carbohydrates and amino acids (Weathersbee & Hardee, Reference Weathersbee and Hardee1994; Fernandes et al., Reference Fernandes, Farias, Soares and Vasconcelos2001). According to Gonzaga et al. (Reference Gonzaga, Ramalho and Santos1991), the vertical distribution of A. gossypii on cotton varies with plant age. However, the development of aphids on the host plant depends on two main factors, plant characteristics and climatic conditions (Ghovlanov, Reference Ghovlanov1976). There are three properties that can be measured to assess how the host plant influences the success of a plant-eating insect: (i) stimuli that lead the insect to locate and choose the plant; (ii) plant conditions that lead the pest to begin and continue feeding; and (iii) the nutritional characteristics of the plant that guarantees the development of the insect and its progeny (Ghovlanov, Reference Ghovlanov1976). Sucrose is the primary form of carbon translocated in the leaves of the majority of higher plants, including cotton, and is the only sugar found in the sap inside the cotton phloem (Hendrix & Huber, Reference Hendrix and Huber1986). A. gossypii converts most of the sucrose that it ingests into oligosaccharides (Hendrix, Reference Hendrix1999). Furthermore, the carbohydrate concentration and content in cotton vary as the plant ages (Wells, Reference Wells2002).
Many studies have underlined the importance of arthropod distribution on cotton (Kuehl & Fye, Reference Kuehl and Fye1972; Wilson et al., Reference Wilson, Booth and Morton1983, Reference Wilson, Leigh, Gonzalez and Foristiere1984; Idris & Roff, Reference Idris and Roff2002; Fernandes et al., Reference Fernandes, Busoli and Barbosa2003; Rodrigues et al., Reference Rodrigues, Fernandes and Santos2010). However, there is no information on the vertical and horizontal distribution of A. gossypii as a function of the age of cotton genetically modified with Bt proteins. Given the need for effective control of this pest on Bt cotton, it is important to determine whether the Bt protein affects the behaviour of A. gossypii in relation to its distribution within the plant over time. Information on the vertical and horizontal distribution of A. gossypii within genetically modified cotton plants of different ages could help optimize decision making in integrated cotton aphid management programs. Therefore, the aim of this study was to determine vertical and horizontal distribution of A. gossypii in transgenic Bt-cotton (DP 404 BG (Bollgard)) and non-transgenic Bt cotton (DP 4049) during two cotton seasons by examining plants throughout the seasons. DP 404 BG is a Cry1Ac transgenic Bt cotton cultivar (Bollgard, Monsanto. St Louis, MO, USA) whilst DP 4049 is its isoline.
Materials and methods
Study location
The study was performed at the Estação Experimental da Embrapa Algodão (Embrapa Cotton Experimental Station), Campina Grande, Paraíba State, Brazil. The experiment design consisted of randomized blocks with two treatments for the Cry1Ac transgenic Bt cotton cultivar (Gossypium hirsutum L.) DP 404 BG (Bollgard, Monasanto, St Louis, MO, USA) and its isoline DP 4049, with five replications, each represented by a plot measuring 0.25 ha. The field plots were planted in the first week of March 2008 and between the second and the third week of April 2009. The cotton plot consisted of rows spaced 1.00 m apart with 0.20 m between the plants in the row.
The plots were not sprayed with any insecticide to allow natural aphid infestation. There were not recorded incidences of lepidopteran pests in the cotton plots.
Aphid sampling
The distribution and dynamics of aphid populations on the cotton plants were determined at intervals of seven days, from plant emergence until the first bolls appeared. The numbers of wingless (apterous) and winged (alate) aphids and their locations were recorded for 25 randomly-selected plants in each plot, using the nodes on the plants’ main stems as reference points (from node zero to the final node), as well as the leaves and fruit structures. Each plant was divided into three regions: bottom (lower third of plant), middle (middle third of plant) and top (upper third of plant). The counts were done by visual inspection of each plant in the field. We use different random sample of each sampling date.
Statistical analysis
The numbers of apterous and/or alate aphids counted per plant were tested for normality (Kolmogorov D: normal test) and homogeneity of variance (Bartlett's test) and, where necessary, converted into square roots of (x+0.5). Note that the tables contain the original mean figures.
The mean number of alate and apterous aphids counted on the first leaves appearing on main stem nodes were subjected to three-way ANOVA (cotton cultivar, cotton age and plant region) and the Student-Newman-Keul test (P<0.05).
The percentages of alate and apterous aphids were referenced according to vertical node positions on the plant (lowest node=1 and highest node=20) or against the position of the leaf and/or fruit structure on the limbs using PROC REG (SAS Institute, 2006). To test the hypothesis that the vertical distribution of aphids on the plant varies according to cultivar, we compared the linear regression coefficients of the models adjusted to the data. Next, the regression coefficients of the adjusted models of the percentages of alate or apterous aphids per vertically or horizontally distributed structure (leaves and reproductive structures) were compared for the Bt cultivar (DP 404 BG (Bollgard)) and its isoline (DP 4049) using PROC MIXED (SAS Institute, 2006). PROC MIXED also tests the uniformity of the linear coefficients.
Results
There were no significant interaction between years and cotton cultivar treatments for apterous (F1, 12=1.47, P=0.6188) or alate aphids (F1,12=1.89, P=0.5288).
Considering year-to-year data, analyses on season-long averages of apterous (F1,12=1.13, P=0.7234) or alate (F1,12=0.77, P=0.8316) aphids showed that aphid densities per plant did not differ among years for the two years studied. Thus, the analyses were performed with the pooled data.
The number of apterous aphids found per plant for the Bt transgenic cultivar (2427 apterous aphids per plant) was lower than for its isoline (3335 apterous aphids per plant) (F(1,12)=21.24, P<0.0320). Similar results were obtained for alate aphids: the number of alate aphids found per plant on the Bt transgenic cultivar (12.28 alate aphids per plant) was significantly lower than for the isoline (140.56 alate aphids per plant) (F(1,12)=55.19, P<0.0018).
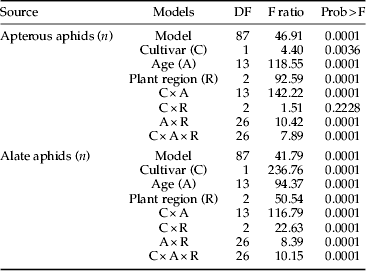
With regard to the vertical distribution of apterous aphids (Fcultivar×age×region (26,332)=7.89, P>0.0001) and alate aphids (Fcultivar×age×region (26,332) (26,332)=10.15, P>0.0001), there were interactions between cotton cultivar, plant age and plant region (table 1).
Summarized models of three-way analysis of variance (ANOVA P<0.05) of the effects of cotton cultivars, plant age and plant region3) on the number of apterous or alate aphids A. gossypii found per cotton plant.
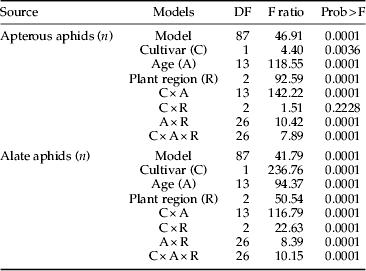
1Cultivars: non-transgenic Bt cotton and transgenic Bt-cotton. 2Ages: 1, 7, 14, 21, 28, 35, 42, 49, 56, 63, 70, 77, 84 and 91 days. 3Plant regions: bottom, middle and top.
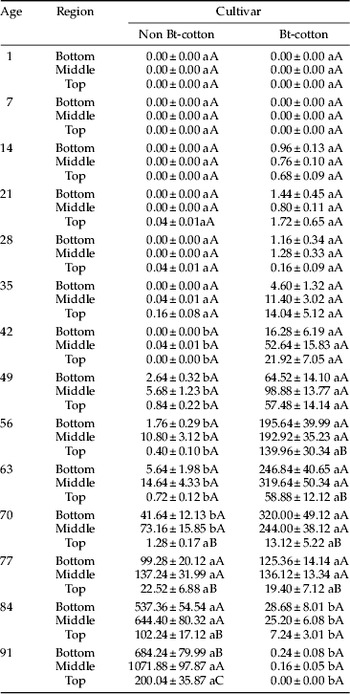
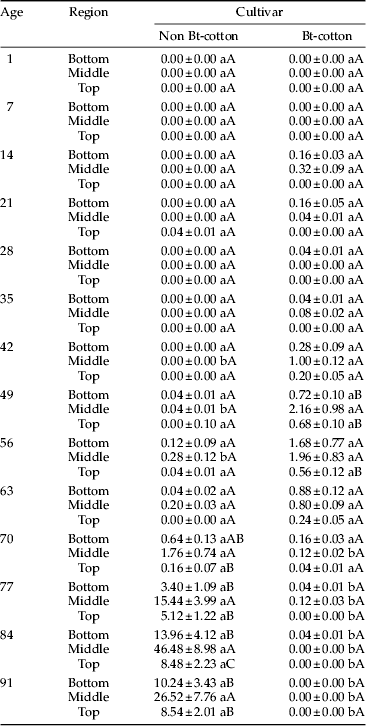
This means that the vertical distribution of A. gossypii on the cotton plant varies according to the cultivar, age and region of the plant. From emergence up to 35 days, distributions of apterous (table 2) and alate aphids (table 3) were not affected by the cultivar, age and region of the plant. Irrespective of the plant region, from 42 to 70 days, the number of apterous aphids per plant was higher on the Bt cultivar than on its isoline. However, irrespective of the plant region, from 77 to 91 days the number of alate aphids per plant was higher on the isoline than on the Bt cultivar (table 3).
Number of apterous aphids (mean±SD) found on structures1 of non-transgenic Bt cotton and transgenic Bt-cotton as a function of age and plant region (FCultivar by region by age (4,332)=7.89; P<0.0001).

1 Leaves and fruits (squares, flowers and bolls). 2Means with the same lower case letter within rows and within the same age, and means with a common upper case letter within columns and within the same age do not differ significantly by the Student-Newman-Keuls test (P=0.05).
Number of alate aphids (mean±SD) found on structures1 of non-transgenic Bt cotton and transgenic Bt-cotton in function of age and plant region (FCultivar by region by age (4,332)=10.15; P<0.0001).
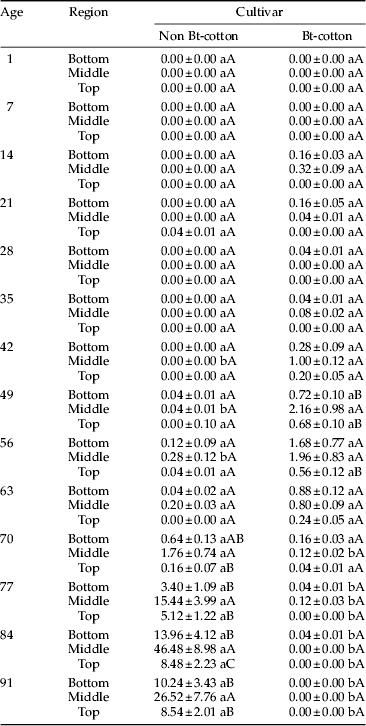
1 Leaves and fruits (squares, flowers and bolls). 2Means with the same lower case letter within rows e within the same age, and means with a common upper case letter within columns within the same age do not differ significantly by the Student-Newman-Keuls test (P=0.05).
On non-transgenic plants, from emergence to 63 days, apterous (table 2) and alate (table 3) aphids were distributed uniformly over the regions of each plant. From 70 days onwards, there were more apterous aphids in the bottom and middle regions of the non-transgenic plants than in the top region (table 2). For the Bt cultivar, the distribution of apterous aphids was uniform over the plant, from emergence to 49 days and from 84 days to 91 days. From 63 days to 77 days on Bt cultivars, the bottom and middle regions of the plants exhibited more apterous aphids than the top region (table 2). Alate aphids were distributed uniformly over the Bt cultivar for the entire lifetime of the plant, except during the period from 49 to 56 days when the number of alate aphids per plant was higher in the middle region than in the top region (table 3). However, on the non-transgenic plant, the distribution of alate aphids over the plant was uniform from emergence to 63 days. From 91 days onwards, the middle region exhibited more alate aphids than the top region (table 3).
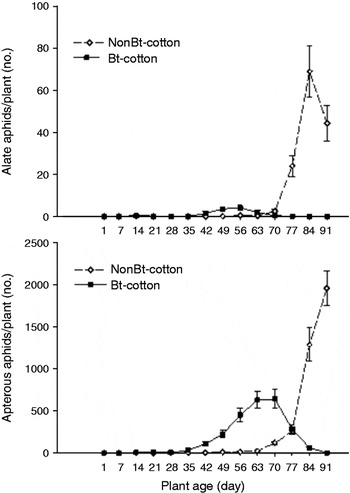
On the Bt cultivar, apterous aphid populations peaked at 63 and 70 days (fig. 1), whereas on the isoline, peaks were reached at 91 days. The alate aphids on the Bt cultivar did not exhibit any population peaks, maintaining a relatively low and constant population density throughout the crop cycle (fig. 1). Alate aphids on the isoline exhibited a low, constant population density from plant emergence to 70 days, with a peak at 84 days (fig. 1). On the Bt cultivar, we observed that, during apterous aphid population peaks (fig. 1), there was a proportionally greater number of these aphids on the nodes in the bottom and middle regions of the plants (table 2 and fig. 2). However, on the non-transgenic cultivar, the greatest numbers of alate and apterous aphids were found on the nodes in the middle region of the plants (fig. 2).
Dynamics of apterous and alate aphids within a season (2008–2009; data pooled) in non-transgenic Bt cotton and transgenic Bt-cotton. Each data point represents the mean of 25 cotton plants. Note different scale of y-axis.

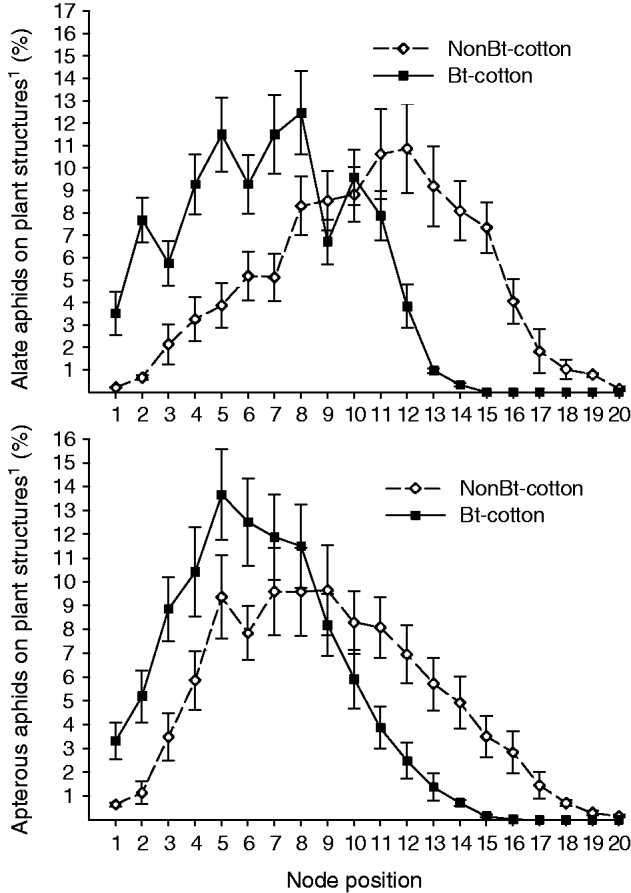
Vertical distribution (%) of cotton aphids on nodes within non-transgenic Bt cotton (Apterous aphids: y=3.44+2.96x−0.16x2, Fmodel(2,17)=99.06, P<0.0001), F(1,17)=165.20, R2=0.92, P<0.0001 and alate aphids: y=2.11+3.80x–0.18x2, Fmodel(2,17)=163.99, P<0.0001), F(1,17)=327.95, R2=0.95, P<0.0001) and transgenic Bt-cotton (Apterous aphids: y=22.84−1.41x+0.01x2, Fmodel(2,17)=18.44, P<0.0001), F(1,17)=36.45, R2=0.68, P<0.0001 and alate aphids: y=14.65+0.91x−0.09x2, Fmodel(2,17)=33.02, P<0.0001), F(1,17)=10.81, R2=0.79, P<0.0043) based on plant node position from bottom (node 1) to plant apex (node 20). 1All plant structures (leaves, squares, flowers and bolls). Each data point was the mean of 25 cotton plants.
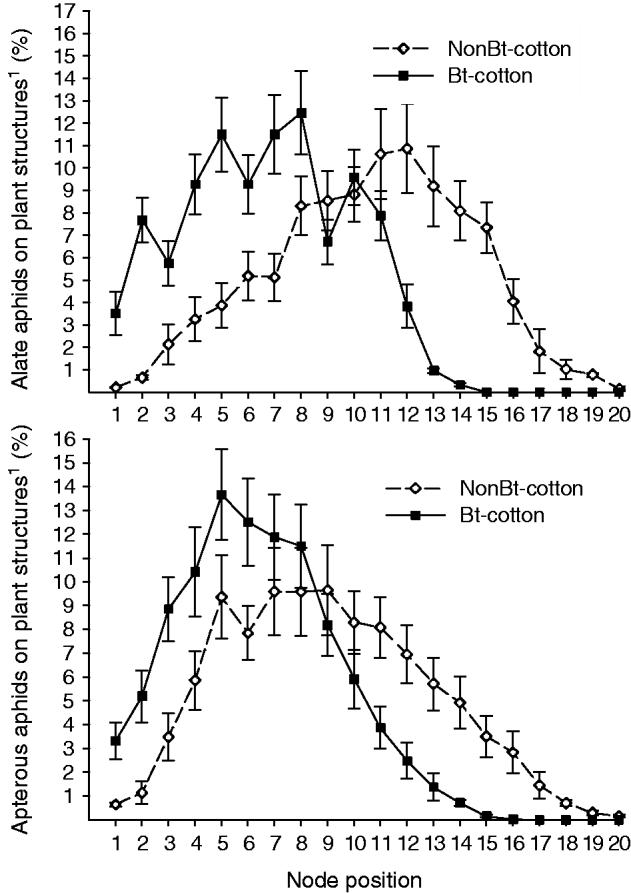
We verified that on nodes 2 to 11 and 3 to 15 of the Bt cultivar and isoline (fig. 2), the percentages of apterous aphids found were 91.9% and 92.1%, respectively. However, 91.3% of alate aphids were found on nodes 2 to 11 of the Bt cultivar and 90.0% on nodes 5 to 16 of the non-transgenic cultivar (fig. 2).
Based on the fact that alate and apterous aphids were found to be concentrated in the bottom and middle regions of Bt cotton and isoline plant, we applied quadratic models to test the distribution of aphids on the plant (fig. 2), since such models are best suited to representing the vertical distribution behaviour of the apterous aphids (Bt cultivar: y=22.43−1.41x+0.01x2, Fmodel(2,17)=18.44, P<0.0001), F(1,17)=36.45, R2=0.68 P<0.0001 and isoline: y=3.44+2.96x−0.16x2, Fmodel(2,17)=99.06, P<0.0001), F(1,17)=165.20, R2=0.92, P<0.0001) and alate aphids (Bt cultivar: y=14.65+0.91x−0.09x2, Fmodel(2,17)=33.02, P<0.0001), F(1,17)=10.81, R2=0.79, P<0.0043 and isoline: y=−2.11+3.80x−0.18x2, Fmodel(2,17)=163.99, P<0.0001), F(1,17)=327.95, R2=0.95, P<0.0001) on the Bt cultivar and isoline plants. Comparing the linear coefficients of the models for the Bt cultivar and the isoline (Sas Proc Mixed applied to the linear coefficient uniformity), we observed that the vertical distribution pattern for apterous aphids (t (1,572)=51.17, P<0.0001) and alate aphids (t (1,219)=32.77, P<0.0001) on the plants were different for the Bt and non-transgenic cultivars.
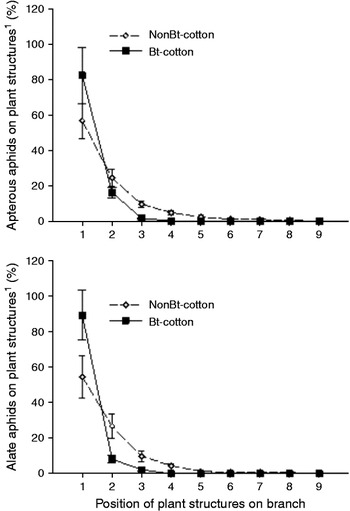
We observed proportionally more apterous aphids (Bt cultivar: 92.84% and non-transgenic cultivar: 80.85%) (fig. 3) and alate aphids (Bt cultivar: 97.65% and non-transgenic cultivar: 81.57%) (fig. 3) on the structures produced by positions 1 and 2 of vegetative and fruiting limbs than in the other positions on the cotton cultivars. Since the incidence of apterous aphids (Bt cultivar: y=77.32−26.21x+2.04x2, Fmodel(2,6)=21.29, P<0.0019, F(1,6)=16.58, P<0.0066, R2=0.82 and isoline: y=58.70−15.29x+1.03x2, Fmodel(2,6)=72.30, P<0.0001, F(1,6)=26.24, P<0.0022), R2=0.96) (fig. 3) and alate aphids (Bt cultivar: y=80.40–27.88x–2.20x2, Fmodel(2,6)=13.19, P<0.0064, F(1,6)=11.08, P<0.0158, R 2=0.82 and isoline: y=58.40–15.44x−1.04x2, Fmodel(2,6)=77.51, P<0.0001, F(1,6)=27.85, P<0.0019, R 2=0.96) (fig. 3) was concentrated in positions 1 and 2 of plant limbs, the quadratic model (fig. 3) was best suited in terms of representing the decrease in the percentage of aphids found on the structures produced by the positioning of limbs located in the internal region of the plants outwards to the external region.
Horizontal distribution (%) of cotton aphids within non-transgenic Bt cotton (Apterous aphids: y=58.70−15.29x+1.03x2, Fmodel(2,6)=72.30, P<0.0001, F(1,6)=26.24, P<0.0022), R2=0.96) and alate aphids: y=58.40–15.44x−1.04x2, Fmodel(2,6)=77.51, P<0.0001, F(1,6)=27.85, P<0.0019, R 2=0.96) and transgenic Bt-cotton (Apterous aphids: y=77.32−26.21x+2.04x2, Fmodel(2,6)=21.29, P<0.0019, F(1,6)=16.58, P<0.0066, R2=0.82 and alate aphids: y=80.40−27.88x–2.20x2, Fmodel(2,6)=13.19, P<0.0064, F(1,6)=11.08, P<0.0158, R 2=0.82) cotton plants based on position of plant structures1 on branch from inside leaf (leaf 1 including bud) toward outside cotton plants. 1All plant structures (leaves, squares, flowers and bolls).

Comparing the linear coefficients of the models for the Bt cultivar and the isoline (Sas Proc Mixed applied to the uniformity of the linear coefficients), we observed that the horizontal distribution pattern for apterous aphids (t (1,412)=49.99, P<0.0001) and alate aphids (t (1,199)=29.31, P<0.0001) on limbs differed for the Bt cultivar and isoline.
Discussion
The results of this study clearly show that A. gossypii responds differently to Bt and non-Bt cotton, since the number of apterous and alate aphids found per plant on the Bt transgenic cultivar (DP 404 BG (Bollgard)) was lower than that found on the isoline (DP 4049). According to Liu et al. (Reference Liu, Zhai, Zhang and Zong2005), the aphid population may develop more rapidly on Bt cotton plants than non-Bt plants. Rodrigues et al. (Reference Rodrigues, Fernandes and Santos2010) observed a greater number of aphid colonies on Bt cotton than on non-Bt cotton, due to interspecies competition between the various populations forming the community of arthropods on the crop. Nevertheless, it is known that there is no direct relationship between a greater number of colonies and a greater number of aphids. The differences in numbers of alate and apterous aphids found on Bt cotton cultivar and its isoline are probably due to genetic modification, since it is likely that transgenic cotton plants secrete less amino acids and soluble sugars than non-transgenic plants (Yan et al., Reference Yan, Shi, Lia and Zhang2007); also, the Bt toxin reduces the absorption of amino acids and glucose (Fast & Angus, Reference Fast and Angus1965; Gringorten, Reference Gringorten and Ishaava2001). According to Faria et al. (Reference Faria, Wäckers, Pritchard, Barrett and Turlings2007), lines of transgenic corn (Zea mays Linné) generally exhibit lower concentrations of leucine and isoleucine in the sap than non-transgenic lines. Therefore, food quality is probably the main factor in determining the distribution, abundance and food usage of many plant-eating insects (Hódar et al., Reference Hódar, Zamora and Castro2002); and, in addition, the components of the host plant directly affect the development, fecundity and consumption of these insects (Awmack & Leather, Reference Awmack and Leather2002). As host plant quality is widely known to affect insect distribution, abundance, development and fecundity, it seems reasonable to us to suspect that factors affecting host plant quality are responsible for the observed decrease of A. gossypii on Bt cotton.
Although the Bt toxin is passed on from the oily plant sap to insects of the family Aphididae (Zhang et al., Reference Zhang, Wan, Lovei, Liu and Guo2006; Burgio et al., Reference Burgio, Lanzoni, Accinelli, Dinelli, Bonetti, Marotti and Ramilli2007), it is otherwise only known that there are subtle changes in arthropod communities between Bt and non-Bt plants, possibly driven by the drop in target lepidoptera numbers (Whitehouse et al., Reference Whitehouse, Wilson and Fitt2005). Thus, although A. gossypii feeds directly on the phloem, we still need to conduct further investigations in order to discern differences if any in the nutritional quality of the phloem in transgenic and non-transgenic cotton plants, and its relationship to aphid population growth parameters. The uptake of Bt proteins by non-target plant-eating insects with a lower susceptibility to Bt transgenic crops indicates that Bt proteins could be transferred from one trophic level to another, interfering directly in already established food chains (Torres & Ruberson, Reference Torres and Ruberson2006). In Brazil, A. gossypii is a key pest for IPM strategies, due to the fact that it plays a very important role in the food chains of the cotton agro-ecosystem. This insect pest acts as host or prey for a variety of parasitoids and predators, and certainly they contribute to reducing pest population growth in the cotton agro-ecosystem (Ramalho, Reference Ramalho1994).
Species of the Aphis spp. complex, including A. gossypii, Aphis fabae Scopoli and Aphis spiraecola Pagenstecher, are often present in agricultural crops (Blackman & Eastop, Reference Blackman and Eastop2000). However, the distribution pattern within the plants can vary in the different botanical species (Carvalho et al., Reference Carvalho, Bueno and Martinez2002). Variations in the pattern of vertical distribution of aphids within cotton plants are due to the chemical or physical attraction exerted, such as the nutritional contribution or incident wavelength of each cultivar, the plant's age and anatomical plant region (Celini & Vaillant, Reference Celini and Vaillant2004; Santos et al., Reference Santos, Neves and Santos2004; Afshari et al., Reference Afshari, Soleiman-Negadian and Shishebor2009; Kianpour et al., Reference Kianpour, Fathipour, Kamali and Naseri2010; Rodrigues et al., Reference Rodrigues, Fernandes and Santos2010). In fact, the results of our study showed that the vertical distribution of apterous A. gossypii (Fcultivar×age×region(26,332)=7.89, P>0.0001) and alate A. gossypii (Fcultivar×age×region(26,332)=10.15, P<0.0001) on the cotton plant varies according to cultivar, plant age and plant region (table 1) and that the pattern of vertical distribution for apterous (t (1,572)=51.17, P<0.0001) and alate aphids (t (1,219)=32.77, P<0.0001) on the plants is different for Bt and non-transgenic cultivars. These results thus demonstrate that vertical distribution within the cotton plant changes according to the cultivar, plant region and age of the plant.
On non-transgenic plants, the distribution of alate aphids was uniform from emergence to 63 days. After this period and up to 91 days, the middle region of the plant exhibited more alate aphids than the top region. This probably relates to the phenological phase of the crop, since the incidence of aphids increased during this phase (1–60 days), when photosynthetic assimilates are used for leaf production and development (Furtado et al., Reference Furtado, Silva and Bleicher2007). According to Shibuya et al. (Reference Shibuya, Goldstein, Damme and Peumans1988), the behavour of glycoproteins with high mannose-type glycan chains depends on the structure of each glycan chain found in each cultivar, which can interfere with plant aphid distribution. Another related factor is the maximum and minimum translocation of photo-assimilates along the phloem from synthesis or remobilization to locations for storage or use (Hussain et al., Reference Hussain, Makhdoom, Husnain, Saleem and Riazuddin2008). According to Yan et al. (Reference Yan, Bengtsson, Anderson, Ansebo, Xu and Witzgall2004), the insertion of Bt genes in plants is known to induce changes in secondary compounds that are extremely important for herbivore/cotton plant interactions.
Kindlmann & Dixon (Reference Kindlmann and Dixon1996) suggested that the dynamics of aphids on their hosts are not evidenced by a clearly-defined pattern and are considered fairly variable throughout the year, mainly in comparison to the mechanism that these insects have for creating similar or different dynamics. Population peaks for apterous aphids found on the Bt cotton cultivar (63 and 70 days) indicate that this cultivar could produce two clearly-defined peaks, whereas the non-transgenic isoline tends to show only one such peak (fig. 1). Zhang et al. (Reference Zhang, Wan, Murphy, Guo and Liu2008), studying the dynamic of A. gossypii in transgenic (GK-12 and NuCOTN 33B) and non-transgenic (Simian 3) cotton cultivars, also observed two clearly-defined population peaks, the Simian 3 population exhibiting a higher population peak than the GK-12 one, but lower than that of the NuCOTN 33B population. On the other hand, the results obtained for the non-transgenic cultivar were similar to those obtained by Pinto et al. (Reference Pinto, Bueno and Santa-Cecília2000) when studying the dynamics of Myzus persicae (Sulzer) in a non-transgenic potato crop (Solanum toberosum L.). Patterns in the production of population peaks can occur when the plants are all approximately the same physical age (Celini & Vaillant, Reference Celini and Vaillant2004). However, the population peak production pattern for alate aphids (fig. 1) in our study indicates that there is no population peak on the Bt cultivar, with population density kept relatively low and constant during the crop cycle, whereas on the isoline, the alate aphid population peaked at 84 days (fig. 1). Although there was no A. gossypii population peak on the Bt cultivar, as such, this cultivar did host adults of A. gossypii and allow colonies to form.
According to Gonzaga et al. (Reference Gonzaga, Ramalho and Santos1991), a higher proportion of A. gossypii is distributed in the top region than in the middle and bottom regions of non-transgenic plants when the plant is 93 days old. Yet Cividanes & Santos (Reference Cividanes and Santos2003) observed that there were more Brevicoryne brassicae (L.) on the middle leaves than on the top and bottom ones. The results obtained here show that the Bt cultivar hosts greater numbers of A. gossypii in bottom and middle region nodes. For the isoline, the highest number of alate and apterous aphids was found on the middle region nodes, with figures of 91.9% of apterous aphids on nodes 2 to 11 of the Bt cultivar, and 92.1% of apterous aphids on nodes 3 to 15 of the isoline. For alate aphids, 91.3% were found on nodes 2 to 11 of the Bt cultivar and 90.0% on nodes 5 to 16 of the isoline (fig. 2). These results may be due to variation between cultivars in respect of the relative proportion of the various amino acids to the quantity of aphids. According to Auclair (Reference Auclair and Jermy1976), the performance of Aphis pisum (Harris) is affected not only by the total concentration of amino acids but also by the relative concentrations of the different amino acids which can lead to a possible nutritional imbalance and/or drop in food stimulus. The concentration of amino acids differs between transgenic and non-transgenic corn cultivars, so that transgenic plants contain greater proportions of alanine, arginine and proline (Faria et al., Reference Faria, Wäckers, Pritchard, Barrett and Turlings2007).
We observed higher numbers of apterous aphids (Bt cultivar: 92.84% and isoline: 80.85%) (fig. 3) and alate aphids (Bt cultivar: 97.65% and isoline: 81.57%) (fig. 3) on the structures produced by positions 1 and 2 of vegetative and fruiting branches than on the other branch positions. Proportions of carbohydrates vary in the different parts of the plants (Wells, Reference Wells2002). Lawo et al. (Reference Lawo, Wackers and Romeis2009) verified the presence of 11 sugars in the honeydew of A. gossypii aphids studied on transgenic and non-transgenic cotton cultivars. Sucrose and fructose are dominant in the cotton plant phloem, as well as erlose (glucosylsucrose, a trisaccharide) synthesized by the aphid, which together make up 73% (Bt Mech 184) to 94% (Mech 162) of total sugars (Lawo et al., Reference Lawo, Wackers and Romeis2009). Fructose is found in higher quantity in the honeydew from non-Bt cotton plants, and glucose is amplified in the honeydew of Bt cotton plants (Lawo et al., Reference Lawo, Wackers and Romeis2009). Erlose differs visibly from one cotton cultivar to another. Thus, we believe that the composition of sugars present in positions 1 and 2 of these cultivars of cotton varies and influences the distribution of A. gossypii accordingly. This present uncertainty concerning this situation is why other studies are important so as to verify or disprove the hypothesis.
Some species belonging to the order Hemiptera are present in greater numbers on the limbs of plants, whilst other species of this order prefer the branches and leaves, and some are distributed over the entire plant (Kozar, Reference Kozar and Jermy1976). In our study, the horizontal distribution pattern for apterous (t (1,412)=49.99, P<0.0001) and alate aphids (t (1,199)=29.31, P<0.0001) on the branches of plants differed for the Bt cultivar and its isoline when the linear coefficients of the models are compared for these cultivars. There are some factors on the surface and in mesophyll cells or phloem sap of Bt cotton affecting non-Bt cotton aphids (cotton aphids reared on non-Bt cotton line); but, as shown in earlier studies, it took several generations for non-Bt cotton aphids to completely adapt to Bt cotton as Bt-aphids (cotton aphids reared on Bt cotton) fed on two cotton lines with no apparent differences between them (Xue et al., Reference Xue, Wang, Huang, Wang, Liu, Yan and Xu2009).
Since Bt cottons were approved for commercial planting, observations on piercing-sucking insect populations in the transgenic plant fields have been reported and the results are controversial. The outbreaks of piercing-sucking insects, such as whiteflies, bugs and aphids, have been reported in Bt cotton fields (Cui & Xia, Reference Cui and Xia2000; Reed et al., Reference Reed, Andrew, Jennifer, Graham and Jian2001; Deng et al., Reference Deng, Xu, Zhang, Zhou and Xu2003). However, in other investigations, the populations of these insects in the Bt cotton and non-Bt cotton fields were found to be quite similar (Wan et al., Reference Wan, Huang, Wu and Wu2003; Wu & Guo, Reference Wu and Guo2003). According to our results, we conclude that in comparison to non-Bt cotton (DP 4049), Bt cotton (DP 404 BG (Bollgard)) had significant effects on the vertical, horizontal, spatial and temporal distribution patterns of A. gossypii, showing changes in its distribution behaviour inside the plant as the cotton crop develops. This may be due to the fact that introducing Bt genes into cotton plants can induce changes in the secondary compounds responsible for herbivore/cotton plant interactions. Therefore, the results of our preliminary study are highly relevant for understanding the vertical and horizontal distribution of A. gossypii on Bt cotton cultivar (DP 404 BG (Bollgard)) and on its isoline (DP 4049) and may well be useful in decision-making, implementing controls and determining the timing of population peaks in this important pest insect.
Acknowledgements
We thank the Brazilian research agencies: Financiadora de Estudos e Projetos–FINEP and Conselho Nacional de Desenvolvimento Científico e Tecnológico–CNPq for financing this work.