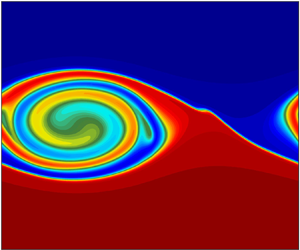
1. Introduction
On the large scale, both the atmosphere and ocean have stable density stratifications, and processes by which fluid properties are mixed in the vertical direction are crucial to both the circulation and to the distribution of chemical and biological species. Shear between interacting masses of fluid is an integral component of the transfer of energy from the largest scales of flow down to the smallest dissipation and mixing scales through the formation of instabilities and turbulence. Away from boundaries vertical mixing is likely to occur through intermittent events triggered by dynamical shear instabilities, such as Kelvin–Helmholtz (KH) instabilities (e.g. Smyth & Moum Reference Smyth and Moum2012). The evolution of the flow in simple configurations of KH instabilities has been studied in detail, both in the laboratory (Thorpe Reference Thorpe1973; Caulfield, Yoshida & Peltier Reference Caulfield, Yoshida and Peltier1996; Patterson et al. Reference Patterson, Caulfield, McElwaine and Dalziel2006) and through numerical simulation (Klaassen & Peltier Reference Klaassen and Peltier1985, Reference Klaassen and Peltier1989; Caulfield & Peltier Reference Caulfield and Peltier1994; Scinocca Reference Scinocca1995; Alexakis Reference Alexakis2009; Carpenter, Balmforth & Lawrence Reference Carpenter, Balmforth and Lawrence2010; Mashayek & Peltier Reference Mashayek and Peltier2012a,Reference Mashayek and Peltierb, Reference Mashayek and Peltier2013). Shear instabilities have also been observed and recorded in nature. For example, in the atmosphere, clear air turbulence represents a specific hazard for aircraft, and is thought to be largely driven by shear instabilities (Browning & Watkins Reference Browning and Watkins1970; Fritts & Rastogi Reference Fritts and Rastogi1985), while ‘roll-up patterns’ in clouds are known to be caused by KH instabilities (Fritts & Rastogi (Reference Fritts and Rastogi1985) and the references therein). Measurements indicative of KH instabilities have been recorded near regions of shear along oceanic thermoclines (Woods Reference Woods1968; Marmorino Reference Marmorino1987), during the downwelling tidal phase near seamounts (van Haren & Gostiaux Reference van Haren and Gostiaux2010) and the surface mixed layer has been observed to deepen due to shear instabilities along its base (Lincoln, Rippeth & Simpson Reference Lincoln, Rippeth and Simpson2016). KH instabilities have also been observed along interfaces in estuaries (Geyer & Smith Reference Geyer and Smith1987; Geyer et al. Reference Geyer, Lavery, Scully and Trowbridge2010), which can be chemically and nutritionally rich due to material in the river outflows.
Density is a dynamically active tracer in the sense it plays an active role in driving the flow. However, processes such as KH instabilities are important in the vertical mixing of passive tracers, which have no direct effect on the flow, as is the case with certain low concentration or neutrally buoyant species (Warhaft Reference Warhaft2000; Canuto, Cheng & Howard Reference Canuto, Cheng and Howard2011), but which are important for other reasons. These include, in the ocean, nutrients and microscopic biological species (e.g. Vaquer-Sunyer & Duarte Reference Vaquer-Sunyer and Duarte2008; Brierley & Kingsford Reference Brierley and Kingsford2009) and, in the atmosphere, chemical species that are radiatively active or affect human health (e.g. Seinfeld & Pandis Reference Seinfeld and Pandis1998; Yang et al. Reference Yang, Easter, Campuzano-Jost, Jimenez, Fast, Ghan, Wang, Berg, Barth and Liu2015). In the ocean, studies of the effect of KH instabilities have been motivated by the likely importance of mixing processes on the overall density stratification and hence the large-scale circulation (e.g. Wunsch & Ferrari Reference Wunsch and Ferrari2004), and by analogy they are also potentially important to the large-scale distributions of biological species. In the atmosphere, the importance of turbulent mixing on the vertical transport of density and chemical species across isentropic surfaces is uncertain because such transport may also occur through radiative heating and cooling (e.g. Sparling et al. Reference Sparling, Kettleborough, Haynes, McIntyre, Rosenfield, Schoeberl and Newman1997). Nonetheless, the intermittent turbulence is likely to control the rate of mixing between air masses of different origin and hence the horizontal and vertical scales of variation of chemical species, particularly in regions such as near the tropopause and in the midlatitude ‘surf zone’ of the winter stratosphere where there is strong chemical inhomogeneity. Given the likely importance of intermittent turbulence mixing events on the large-scale distribution of atmospheric and oceanic tracers, understanding the details of these events and their effect on tracers is thus of major importance. This motivates the investigation, via numerical simulation, of the mixing of passive tracers in KH instability reported in this paper.
In most atmospheric and oceanic models, the details of intermittent diapycnal mixing events are not simulated directly. Such mixing is typically regarded as a subgrid-scale process that must be parameterised, often through a turbulent or eddy diffusivity (see, for example, Seinfeld & Pandis (Reference Seinfeld and Pandis1998, chap. 18) for a summary of functional forms of eddy diffusivities in atmospheric models, or Griffies (Reference Griffies2004, chap. 7) for a discussion of parameterised phenomena in ocean models). The magnitude of the required eddy diffusivity has been estimated in various ways, for example, with ocean tracer release experiments to estimate diffusivity based on spreading across isopycnals (e.g. Ledwell, Watson & Law Reference Ledwell, Watson and Law1993), and extracting estimates from atmospheric radar data (e.g. Fukao et al. Reference Fukao, Yamanaka, Ao, Hocking, Sato, Yamamoto, Nakamura, Tsuda and Kato1994). Parameterisations have been drastically improved and are able to reproduce the dynamics of the mixed layer from high frequency to seasonal time scales. However, in most developments and existing parameterisations, turbulent diffusivities of passive and active tracers are assumed for simplicity to be equal (or proportional). Whether or not this assumption is justified is not yet clear. One aspect of this uncertainty is the effect of different molecular diffusivities between passive and active species or indeed between different passive species. This certainly needs to be taken into account when considering turbulent mixing in the ocean, where diffusivities of heat and salt, both of which may contribute to density, differ by a factor of approximately 100. The effect of differing molecular diffusivities on vertical transport in KH mixing events has been considered by Smyth, Nash & Moum (Reference Smyth, Nash and Moum2005), who, for practical reasons, set the diffusivity of heat to be approximately  $7$ times that of salt. In addition, even if the molecular diffusivities of the passive tracer and the density are the same, the assumption of equal turbulent diffusivities may be an oversimplification if they have different large-scale sources and sinks. The geometry of the two may then be different at small scales and the resulting differences in molecular diffusive transport may potentially lead to differences in turbulent diapycnal transport at macroscales. There has been some investigation of this topic using numerical simulation (Nagata & Komori Reference Nagata and Komori2001) and some discussion of the potential importance in the atmospheric boundary layer (Li, Bou-Zeid & De Bruin Reference Li, Bou-Zeid and De Bruin2012). Further work is needed to evaluate under which circumstances turbulent diffusivities are equal or similar for all tracers, and to assess the implications for representation of diapycnal fluxes of different tracers in oceanic and atmospheric models.
The research reported in this paper examines the vertical mixing of passive tracers by KH instabilities, focusing in particular on whether the extent to which what is known regarding the mixing of density can also be applied to passive tracers, and what other factors need to be taken into account. Numerical simulations of KH instabilities in a standard flow configuration, including a set of passive tracers, are presented (§§ 2 and 3), and analysed using various techniques (§§ 4 and 5). One technique is to use a density–tracer scatter plots to examine the relative distribution of density and tracer and to relate this to the mixing. The shape of the scatter plot places constraints on the redistribution of the tracer and, in particular, it is shown that, for the flow configuration considered, the relationship between the density and the tracer is often in part piecewise linear or close to piecewise linear in the end state. Another technique used in previous studies is to exploit a tracer-based coordinate system in which the effect of mixing can be represented completely by an effective diffusivity. The question addressed here is whether the effective diffusivity for density also usefully represents the mixing of other tracers, which is tested by varying the initial distribution of tracer (§ 7).
2. Numerical model and flow configuration
2.1. Governing equations and numerical model
The governing equations are non-dimensionalised using typical scales for the study of KH instabilities, with tildes denoting the dimensional forms of distance  $\boldsymbol {x}=(x,y,z)$, time,
 $t$, velocity,
 $\boldsymbol {u}=(u,v,w)$, density,
 $\rho$, tracer concentration,
 $\phi$, and pressure,
 $p$,
 \begin{gather*} x = \tilde{x}/h,\quad y = \tilde{y}/h,\quad z = \left(\tilde{z}-z_0\right)/h,\quad t = \tilde{t}U_0/h, \quad \boldsymbol{u} = \tilde{\boldsymbol{u}}/U_0, \\ \rho = \left(\tilde{\rho}-\rho_0\right)/{\rm \Delta}\rho, \quad \phi =\tilde{\phi}/{\rm \Delta}\phi, \quad p = \tilde{p} / \rho_0 U_0^2. \end{gather*}
The dimensional parameters used here are the value defining the width of the pycnocline and the shear layer,  $h$, the midpoint of the stratification and shear layer,
 $z_0$, half of the change in velocity across the two layers,
 $U_0$, the density at the midpoint of the density distribution,
 $\rho _0$, half of the change in density across the two layers,
 ${\rm \Delta} \rho$, and the maximum initial tracer concentration,
 ${\rm \Delta} \phi$. Using these dimensionless variables, the continuity equation and equations of conservation of momentum, density and passive tracer can be written in their incompressible and Boussinesq forms as
 \begin{gather} \boldsymbol{\nabla} \boldsymbol{\cdot} \boldsymbol{u} = 0, \end{gather}
 \begin{gather}{\partial \boldsymbol{u}}/{\partial t} + \boldsymbol{\boldsymbol{u}}\boldsymbol{\cdot}\boldsymbol{\nabla}\boldsymbol{u} ={-}\boldsymbol{\nabla} p - {Ri}_0 \rho \boldsymbol{\hat{k}} + {Re}_0^{{-}1} \nabla^2 \boldsymbol{u}, \end{gather}
 \begin{gather}{\partial \rho}/{\partial t} + \boldsymbol{\boldsymbol{u}}\boldsymbol{\cdot}\boldsymbol{\nabla}\rho = ({Re}_0 {Pr})^{{-}1} \nabla^2 \rho, \end{gather}
 \begin{gather}{\partial \phi}/{\partial t} + \boldsymbol{\boldsymbol{u}}\boldsymbol{\cdot}\boldsymbol{\nabla}\phi = ({Re}_0 {Sc})^{{-}1} \nabla^2 \phi, \end{gather}
with  $\boldsymbol {\hat {k}}$ denoting the unit vector of the vertical axis. The dimensionless parameters included in these equations are the initial Reynolds number,
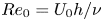 ${Re}_0 = U_0 h /\nu$, the Prandtl number,
 ${Pr} = \nu /\kappa _\rho$, and the Schmidt number,
 ${Sc} = \nu /\kappa _\phi$, where
 $\nu$ is the kinematic viscosity, and
 $\kappa _{\rho }$ and
 $\kappa _{\phi }$ are the prescribed molecular diffusivity constants for density and the passive tracer, respectively.
 ${Ri}_0$ is the minimum initial Richardson number, which follows the standard definition for the gradient Richardson number,
 \begin{equation} {Ri} ={-}\frac{g}{\rho_0}\frac{\dfrac{\partial \tilde{\rho}}{\partial \tilde{z}}}{\left(\dfrac{\partial \tilde{u}}{\partial \tilde{z}}\right)^2}, \end{equation}
and can be expressed as
 \begin{equation} {Ri}_0 \approx \frac{g {\rm \Delta} \rho h}{\rho_0U_0^2}, \end{equation}
based on the initial conditions presented in the following section. The configuration parameters are chosen so that the necessary criterion for stratified shear instability,  ${Ri}_0 < 1/4$, is satisfied. For the sake of completeness, relevant dimensional parameters prescribed in the simulations presented in this paper are given in table 2 in appendix A.
The numerical simulations presented in this paper were performed using the non-hydrostatic, non-Boussinesq version of the Coastal and Regional Ocean Community model (CROCO). This model was adapted from the Regional Ocean Modeling System (ROMS, Shchepetkin & McWilliams Reference Shchepetkin and McWilliams2005) to include non-hydrostatic and compressible effects (Auclair et al. Reference Auclair, Bordois, Dossmann, Duhaut, Paci, Ulses and Nguyen2018). While numerical simulations of KH instabilities are often considered in a periodic domain with free-slip rigid lid conditions for the upper and lower boundaries (e.g. Mashayek & Peltier Reference Mashayek and Peltier2012b, Reference Mashayek and Peltier2013), the implementation presented here utilises a free-surface upper boundary, and a flat, solid, bottom boundary, with periodic lateral boundary conditions in the  $x$- and
 $y$-directions (streamwise and spanwise directions, respectively). The existence of a free surface and compressibility adds two dynamical processes (surface and acoustic waves) compared to more traditional studies of KH instabilities in incompressible, unbounded or rigid lid flows. It has been verified that, with the chosen configurations where the instability develops far from the vertical boundaries, the impact of these additional processes on the results is negligible when compared to the traditional configuration (see appendix A for further details regarding the implementation of CROCO and the discussion in the concluding section). However, in certain circumstances, surface and acoustic waves may play a role in modifying the turbulent cascade (see, for example, Shete & Guha Reference Shete and Guha2018).
2.2. Initial conditions
The initial conditions (ICs) for the simulations presented in this paper follow those from previous numerical studies of Kelvin–Helmholtz instabilities (e.g. Salehipour, Peltier & Mashayek Reference Salehipour, Peltier and Mashayek2015). In their dimensionless forms, the extents of the domain in the streamwise, spanwise and vertical directions are given by  $L_x$,
 $L_y$ and
 $L_z$, respectively. Both two-dimensional (2-D) and three-dimensional (3-D) configurations are examined, with periodic boundary conditions in the horizontal directions, a flat, free-slip, rigid bottom and a free surface in the vertical direction. The initial density distribution is defined as two constant-density layers separated by a strongly stratified pycnocline, with a weak stable background stratification superimposed,
 \begin{equation} \rho\left( \boldsymbol{x},0 \right) ={-}\beta z - \tanh(z). \end{equation}
The linear background term  $\beta z$ is a minor modification to the standard configuration for the purpose of defining the scatter plots in density–tracer space discussed in § 4.1 over the entire vertical domain in physical space (i.e. each density value initially corresponds to a unique value of height). Note that the definition of the initial Richardson number (2.3) ignores the weak linear background term of the initial density profile, since it was confirmed to have a negligible influence on the development of the instability when compared to the initial stratification without the weak linear background (
 $\beta \approx 3.5\times 10^{-3} \ll 1$ in this study).
The initial velocity field is given by
 \begin{equation} \left.\begin{array}{c@{}}u\left( \boldsymbol{x}, t=0 \right) = U\left(z\right) + u^\prime(\boldsymbol{x}), \\ v\left( \boldsymbol{x}, t=0 \right) = v^\prime(\boldsymbol{x}), \\ w\left( \boldsymbol{x}, t=0 \right) = w^\prime(\boldsymbol{x}).\end{array}\right\} \end{equation}
Here,  $U(z)$ is the initial background flow providing the shear and is defined by a hyperbolic tangent profile, with the upper layer moving leftward, and the lower layer moving rightward,
 \begin{equation} U(z) ={-}\tanh\left(z\right). \end{equation}
and  $u^\prime$,
 $v^\prime$ and
 $w^\prime$ are small amplitude perturbations, required to kickstart the instability, defined as
 \begin{gather} u^\prime(x,y,z) =
\epsilon f^\prime(z)\sin\left(\frac{2{\rm \pi} n_x}{L_x}x\right)
\left(1+\epsilon_{3\hbox{-}\mathrm{D}}\sin\left(\frac{2{\rm \pi}
n_y}{L_y}y\right)\right), \nonumber\\ v^\prime(x,y,z) = 0,
\nonumber\\ w^\prime(x,y,z) ={-}\epsilon f(z)\frac{2{\rm \pi}
n_x}{L_x}\cos\left(\frac{2{\rm \pi}
n_x}{L_x}x\right)\left(1+\epsilon_{3\hbox{-}\mathrm{D}}\sin\left(\frac{2{\rm \pi}
n_y}{L_y}y\right)\right).
\end{gather}
This choice of functional form for the perturbation ensures that the initial velocity field is non-divergent, which is important in the context of this numerical implementation. The function
 \begin{equation} f(z) = 1 - \tanh^2\left(\frac{z}{\alpha}\right), \end{equation}
ensures that the initial perturbation is localised within the region of the shear, with  $\alpha = 4.29$;
 $\epsilon =0.01$ is a dimensionless parameter that sets the magnitude of the perturbation in the streamwise direction, while
 $n_x$ and
 $n_y$ set the wavelengths of the initial perturbation in the
 $x$- and
 $y$-directions, respectively;
 $\epsilon _{\mathrm {3D}}$ sets the magnitude of the spanwise perturbations, and for 3-D configurations,
 $\epsilon _{\mathrm {3D}}=0.2$. For 2-D configurations, both
 $n_y=0$ and
 $\epsilon _{\mathrm {3D}}=0$.
In addition to the dynamical fields, passive tracer fields are defined by an initial profile of the form
 \begin{equation} \phi\left( \boldsymbol{x},0 \right) = a{\textrm{sech}}^2\left(az - b\right), \end{equation}
where  $a$ is a dimensionless parameter that determines the width of the tracer distribution, while ensuring the total amount of tracer remains constant between simulations, and
 $b$ indicates the offset of the tracer from the pycnocline. The tracer is thus initially distributed in a layer, with its maximum initial value located at
 $z=b/a$. Both the vertical position and the width of the tracer layer will be varied in simulations presented later in this paper, but for the different dynamical configurations discussed first in § 2.3, the tracer layer is collocated with the midpoints of the stratification and the shear (
 $b=0$), and the maximum initial tracer value is
 $1$ (
 $a=1$). Sketches of the initial vertical profiles of the shear, density and passive tracer fields are depicted in figure 1, with associated dimensional parameters.
(Left to right) Initial vertical profiles of the velocity, density, and passive tracer fields for the described simulations with relevant dimensional parameters.

2.3. Description of dynamical configurations
The primary experiment presented in this section compares simulations of three different dynamical configurations, all with identical initial background fields and prescribed parameters. The relevant dimensionless parameters used in all simulations are  ${Ri}_0 = 0.1158$,
 ${Re} = 2000$,
 ${Pr} = 1$ and
 ${Sc} = 1$. The non-dimensional wavelength of the fastest-growing mode as predicted by the Taylor–Goldstein equations for these given initial background velocity and density profiles is
 $\lambda _{{KH}}\approx 14.3$. As such, the length of the domain is the streamwise direction was chosen as
 $L_x=\lambda _{{KH}}$, so that a single KH billow develops, or
 $L_x=2~\lambda _{{KH}}$, so that two KH billows develop, possibly leading to pairing in 2-D configurations. The parameters
 $N_x$,
 $N_y$ and
 $N_z$ are the number of grid points in the streamwise, spanwise and vertical directions, respectively. Combined with the length of the domain in each direction, this leads to a consistent dimensionless grid spacing in the
 $x$-,
 $y$- and
 $z$-directions of
 ${\rm \Delta} x = {\rm \Delta} y = {\rm \Delta} z = 0.0559$.
 ${\rm \Delta} t$ is the dimensionless barotropic time step. Table 1 presents the parameters that vary between each dynamical configuration. Additional parameters relevant to the non-Boussinesq components of the model are listed in appendix A. The three dynamical configurations are defined as follows:
(i) Configuration I is 2-D, with
 $L_x=\lambda _{{KH}}$ and $n_x=1,\ n_y=0$ (so that $v=0$ at all times). The initial perturbation corresponds to the most unstable wavelength and only one billow develops in this simulation.
(ii) Configuration II is also 2-D, except that
$L_x=2~\lambda _{{KH}}=L_z$ and $n_x=2$. The length of the domain and wavelength of the perturbation allow for the formation of two billows, which eventually give way to pairing and additional mixing.(iii) Configuration III is 3-D, with spanwise parameters
$L_y=0.375~\lambda _{{KH}}$, $n_y=4$, while the streamwise and vertical parameters are the same as configuration I ($L_x=\lambda _{{KH}}$, $n_x=1$). This allows for mixing by spanwise secondary instabilities that lead to the breakdown of the primary KH billow.








Relevant computational parameters of the three dynamical configurations presented in this paper.

Due to the inclusion of the third dimension and resulting spanwise instabilities, configuration III provides a more realistic simulation than the other two cases. Configurations I and II, while less physically realistic, provide additional pathways to turbulence and mixing, despite showing nearly identical initial behaviour. Comparing the three configurations therefore permits the evaluation of the impact of the route to turbulence on tracer mixing.
3. Diapycnal mixing of a passive tracer by Kelvin–Helmholtz billows: comparison of dynamical configurations
This section presents 2-D and 3-D numerical simulations of stratified turbulence developing from shear-induced Kelvin–Helmholtz billows. Each simulation undergoes the same initial 2-D growth as predicted by linear theory, with later stages leading to different forms of turbulence and mixing.
3.1. Evolution of the different dynamical configurations
In order to follow the time evolution of the three dynamical configurations, the mean background and perturbation kinetic energy (KE) are defined in the standard way (e.g. Mashayek & Peltier Reference Mashayek and Peltier2013). This requires definitions for the mean background and perturbation velocity fields. The mean background velocity field is a function of  $z$ only, and is given as
 \begin{equation} \overline{\boldsymbol{u}}(z) = \frac{1}{L_xL_y}\iint \boldsymbol{u}\,\textrm{d} x\,\textrm{d} y. \end{equation}
The 2-D velocity perturbation is a function of  $x$ and
 $z$, defined as
 \begin{equation} \boldsymbol{u}_{2\hbox{-}\mathrm{D}} = \frac{1}{L_y}\int \left(\boldsymbol{u}-\overline{\boldsymbol{u}}\left(z\right)\right)\textrm{d} y. \end{equation}
Finally, the 3-D velocity perturbation can be expressed using the background velocity and the 2-D velocity perturbation,
 \begin{equation} \boldsymbol{u}_{3\hbox{-}\mathrm{D}} = \boldsymbol{u}-\boldsymbol{u}_{2\hbox{-}\mathrm{D}}-\overline{\boldsymbol{u}}\left(z\right). \end{equation}
Following these definitions, the background KE, KE due to 2-D perturbations, and KE due to the 3-D perturbations are defined as
 \begin{gather} \overline{\mathcal{K}} = \frac{1}{L_z}\int \frac{\overline{\boldsymbol{u}}^2}{2}\,\textrm{d} z, \end{gather}
 \begin{gather}\mathcal{K}_{2\hbox{-}\mathrm{D}} = \frac{1}{L_x L_z}\iint \frac{\boldsymbol{u}_{2\hbox{-}\mathrm{D}}^2}{2}\,\textrm{d} x\,\textrm{d} z, \end{gather}
 \begin{gather}\mathcal{K}_{3\hbox{-}\mathrm{D}} = \frac{1}{L_x L_y L_z}\iiint \frac{\boldsymbol{u}_{3\hbox{-}\mathrm{D}}^2}{2}\,\textrm{d} x\,\textrm{d} y\,\textrm{d} z, \end{gather}
respectively, noting that the mean KE can be expressed as the sum of these three values,
 \begin{equation} \mathcal{K} = \frac{1}{V}\int \frac{\boldsymbol{u}^2}{2}\,\textrm{d} V = \overline{\mathcal{K}} + \mathcal{K}_{2\hbox{-}\mathrm{D}} + \mathcal{K}_{3\hbox{-}\mathrm{D}}. \end{equation}
The general evolution of the dynamical configurations is tracked in figure 2, which plots their mean KE as functions of time. Note that although each of the simulations are performed on domains with different volumes, the initial mean KE is identical for all three cases. This provides a straightforward depiction of the divergent behaviour between the three cases. The 2-D and 3-D perturbation KE will be discussed further in § 4.2 when discussing tracer mixing.


Figures 3 and 4 present the evolution of the density and passive tracer, respectively, for the three dynamical configurations. Each row corresponds to a specific time depicted on the KE time series of figure 2, which indicates an important stage in KH development, or points at which the development of the configurations diverge. The distinct phases enumerated in figure 2 are as follows:
(i) The initial period of linear growth, as predicted by inviscid Taylor–Goldstein theory. This phase is nearly identical for all three simulations, although some weak spanwise effects are visible in the 3-D simulation. Each simulation exhibits stirring of the low and high-density regions by 2-D KH billows with a wavelength close to that of the fastest-growing mode predicted by Taylor–Goldstein theory.
(ii) The branching point between 2-D and 3-D simulations due to the onset of secondary instabilities. All three configurations exhibit secondary shear instabilities along the tilted pycnocline, and secondary convective instabilities within the vortices, while spanwise instabilities begin to emerge in the 3-D configuration. The density field develops alternating layers of high and low density, while the passive tracer takes the shape of ellipses with maximum values centred within the billows, gradually decreasing to no tracer at the billow exterior. A thin strand of low tracer concentration occurs along the braids, while even lower concentrations of tracer are visible between the horizontal edges of the billows.
(iii) First onset of small-scale features, resulting to greater mixing in all simulations. In the 2-D configurations, this leads to the density within the billows becoming nearly uniform. In the 3-D configuration, this leads to a wider pycnocline that is no longer unstable to shear instabilities. The 2-D cases keep their tracer maxima focused at the centre of the billows, although some tracer is pulled from the high concentration regions towards the outsides of the billows. Meanwhile, the density field experiences greater mixing due to the appearance of the small-scale features, and becomes nearly homogeneous within the billows. The secondary instabilities in configuration III mix the high tracer concentration region at the centre of the billow, redistributing the tracer throughout the rest of the pycnocline.
(iv) The onset of pairing in configuration II, which results in much greater mixing further into the low- and high-density layers, while mixing the concentrated regions of tracer within the two billows with the regions external to the billows without tracer. The single billow of configuration I maintains a nearly constant shape and size.
(v) Second onset of small scales due to enhanced stretching from the pairing in configuration II. Configuration III has reached an essentially steady state.
(vi) The nearly steady final phase of the 2-D configurations. The single billow of configuration I continuously rolls and experiences slow diffusion of density at the edges of the vortex. The pairing of configuration II induces stretching, causing new small-scale instabilities to develop, and enhancing the homogenisation of tracer fields within the billows. This leads to formation of a single larger billow that eventually remains nearly steady.
Evolution of slices of the density field for configurations I (a–f), II (g–l) and III (in the streamwise (m–q) and spanwise (r–v) directions) at the times indicated in figure 2. The dashed lines in the images of the third column indicate the position of the spanwise slices depicted in the fourth column, while the streamwise slices of the third column correspond to the right edge of the spanwise slices.

Evolution of slices of the passive tracer field for configurations I (a–f), II (g–l) and III (in the streamwise (m–q) and spanwise (r–v) directions) at the times indicated in figure 2. The dashed lines in the images of the third column indicate the position of the spanwise slices depicted in the fourth column, while the streamwise slices of the third column correspond to the right edge of the spanwise slices.

4. Density–tracer scatter plots
This section examines density–tracer scatter plots as a diagnostic technique to describe the diapycnal fluxes of a passive tracer.
4.1. Weighted density–tracer scatter plots
For definiteness, mixing is here defined as an irreversible process during which the density or tracer concentration of a given fluid parcel is modified. In the equations (2.1c) and (2.1d), it is allowed by the inclusion of an explicit diffusion term. Following other papers on this topic, the term diabatic is used to denote an irreversible (and correspondingly adiabatic to denote a reversible) process applying to density. Stirring is the process of geometric deformation of fluid elements that leads to diffusive mixing, but before diffusion acts. It is in principle reversible, because it does not change the density or tracer concentration within fluid elements. To characterise the diapycnal mixing of tracers during a dynamical event, scatter plots which show the characteristics of fluid parcels in terms of their location in a 2-D space in which the coordinates are density ( $\rho$) and tracer concentration (
 $\phi$) are employed. In such plots, a fluid parcel will remain at the same position in density–tracer (
 $\rho \phi$) space whatever its displacement or geometrical deformation in physical space, provided that there is no irreversible mixing due to the action of diffusion. Any change in the distribution of fluid parcels in
 $\rho \phi$ space is therefore indicative that irreversible mixing has occurred. Similar diagrams are often used to characterise mixing in geophysical flows, such as temperature–salinity diagrams used to qualify the mixing of large water masses in the ocean (e.g. Tomczak Reference Tomczak1981; Teramoto Reference Teramoto1993); tracer–salinity estuarine mixing curves used to identify whether an estuary may act as a source or sink of a given tracer (e.g. Loder & Reichard Reference Loder and Reichard1981; Officer & Lynch Reference Officer and Lynch1981); or tracer–tracer diagrams used to examine compact relationships between different atmospheric tracers (e.g. Tilmes et al. Reference Tilmes, Müller, Grooß, Nakajima and Sasano2006; Plumb Reference Plumb2007). Scatter plots are thus convenient for the purpose of the analysis presented here as they permit the straightforward identification of diapycnal tracer transport which must be indicated by the generation of new points in density–tracer space. For example, if the density–tracer distribution is initially given by the solid black line in figure 5, then the evolution to a distribution given by the dashed line is indicative of diapycnal tracer flux.
Sketch of the initial scatter plot of tracer as a function of density associated with the profiles given by (2.4) and (2.9) where the pycnocline and tracer layer are collocated (solid line). Hypothetical evolution of the scatter plot after a mixing event showing diapycnal fluxes of tracer (dashed line). In the new profile, mixing has led to a flux of tracer towards lower densities.

The geometry of density–tracer scatter plots does not by itself uniquely define density and tracer distributions in physical space. Further information is provided by associating each point in density–tracer space with a ‘weight’, which is a discrete formulation of the density–tracer probability function presented in appendix D of Plumb (Reference Plumb2007), which quantifies the amount of fluid in a given density–tracer bin. The procedure to calculate the weight is outlined as follows. The density and tracer domains are subdivided into  $N_\rho$ and
 $N_\phi$ individual bins, respectively, with sizes
 \begin{gather} \delta\rho=\frac{\rho_{Max}-\rho_{Min}}{N_\rho}, \end{gather}
 \begin{gather}\delta\phi=\frac{\phi_{Max}-\phi_{Min}}{N_\phi}, \end{gather}
where the subscripts  ${Max}$ and
 ${Min}$ indicate the maximum and minimum values of the density and the tracer. The centre of a given bin is defined by the point
 $(\rho _i,\phi _j)$, where
 \begin{gather} \rho_i=\rho_{Min}+\frac{2i - 1}{2}\delta\rho,\quad i=1,2,\ldots,N_\rho, \end{gather}
 \begin{gather}\phi_j=\phi_{Min}+\frac{2j - 1}{2}\delta\phi,\quad j=1,2,\ldots,N_\phi. \end{gather}
The weight corresponding to a given bin with centre  $(\rho _i,\phi _j)$,
 $W_{ij}(t)$, is calculated as
 \begin{align} W_{ij}\left(t\right) &= W\left(\rho_i,\phi_j,t\right) \nonumber\\ &= \frac{1}{V} \sum I_{ij}(\rho,\phi,t) {\rm \Delta} V, \end{align}
where  ${\rm \Delta} V = {\rm \Delta} x \times {\rm \Delta} y \times {\rm \Delta} z$, and
 \begin{align} I_{ij}(\rho,\phi,t) = \left\{\begin{array}{@{}ll} 1, & \left(\rho\left(\boldsymbol{x},t\right) - \rho_i,\phi\left(\boldsymbol{x},t\right) - \phi_j\right) \in \left[- \dfrac{1}{2}\delta\rho,\dfrac{1}{2}\delta\rho\right) \times \left[- \dfrac{1}{2}\delta\phi, \dfrac{1}{2}\delta\phi\right)\\ 0, & {\rm otherwise}, \end{array}\right. \end{align}
and its value is represented in colour on the scatter plot. Note that the total weight is conserved (i.e. the total is always 1), and the integral of the weight multiplied by the tracer concentration or density is also conserved in the absence of sources and sinks.
Since graphical limitations can make it difficult to discern when a scatter plot has converged to a compact relationship, it is useful to define a diagnostic that acts as a measure of the scatter,
 \begin{equation} R\left(t\right)=\frac{\int\left(\phi(\boldsymbol{x},t) - \phi_*(z,t)\right)^2 \textrm{d} V}{\int\left(\phi(\boldsymbol{x},t) - \overline{\phi}\right)^2\textrm{d} V}. \end{equation}
This value will be referred to as the scatter variance. It relates the total variance of the tracer from the isopycnal mean  $\phi _*$ (as defined by (C 11) in appendix C) to the total variance of tracer from the mean over the whole domain
 $\overline {\phi }$. As such, it presents a time evolution of the scatter plots, with larger values of
 $R$ indicating greater relative variance over a given density bin, and smaller values indicating a convergence towards functional, compact relationships between
 $\rho$ and
 $\phi$.
4.2. Scatter plot evolution for the different dynamical configurations
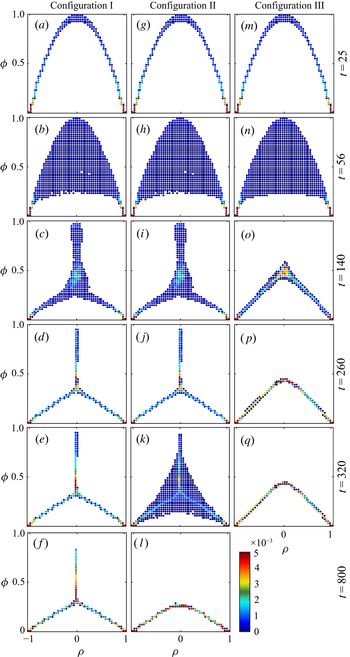
Figure 6 provides the evolution of the weighted density–tracer scatter plots for each of the dynamical configurations, with each of the rows corresponding to those in figures 3 and 4. The weight of each density–tracer bin is represented by the colours indicated by the colour bar, with white indicating no fluid occupies that region of density–tracer space. Prior to  $t=25$, all scatter plots remain close to their initial shape, reflecting that the evolution is mostly adiabatic and advective. Most of the fluid remains located at the edges of the scatter plots (near
 $\rho = \pm 1$), which is indicative of the near-constant high- and low-density layers below and above the pycnocline, while the rest of the curve indicates the pycnocline itself, which initially occupies a relatively small region of the domain. Starting around
 $t=25$ (figure 6a,g,m), the scatter plots begin to spread just below the top of the initial curve, corresponding to the initial roll-up of the pycnocline and slow diffusion of
 $\rho$ and
 $\phi$ near the pycnocline. The greater spreading of the scatter plots at
 $t=56$ relates to the irreversible mixing of both density and passive tracer which starts when the roll-up of the billow has significantly stretched the interface between the regions of high and low density. While the scatter plots of the 2-D configurations appear identical, the slight deviation in shape of the 3-D configuration scatter plot is due to the effect of the spanwise instabilities. The development of these secondary instabilities is when the evolutions of the 2-D and 3-D configurations diverge. The spanwise instabilities lead to the rapid breakdown of the 3-D billows, and thus rapid homogenisation of the density and passive tracer. By
 $t=140$, the scatter plot reduces to an almost piecewise linear tent-like shape with minor spreading along the edges, and slightly more spreading at the peak around
 $\rho =0$ (figure 6o). As the density and tracer further homogenise, this tent-like scatter plot becomes more compact, with the top around
 $\rho =0$ becoming more rounded, and branches on either side remaining nearly linear, as shown in figure 6(q). The convergence of the scatter plots towards more compact curves indicates that the range of tracer concentrations for a given density value has decreased. The 2-D billows continue to rotate uninhibited, which mixes and homogenises the density within the billow, while trapping local maxima of the passive tracer within the core of the billows. These tracer maxima localised in regions of relatively constant density are visible in the scatter plot as narrow vertical protrusions centred at
 $\rho =0$, as in figure 6(c,i). As the density field homogenises, these vertical protrusions converge to more compact vertical lines, as in figure 6(d,j), indicating a wide range of tracer values in a region of nearly constant density. However, while configuration I equilibrates and maintains this shape, configuration II experiences new instabilities and undergoes a new turbulent phase associated with billow pairing. This generates large meanders protruding deep into the upper and lower layers of the fluid, which involves mixing over a wide density range, indicated by the increased scattering in figure 6(k). A new single billow is formed that eventually stabilises. The scatter plot evolves to a new shape where the central branch has vanished.
Weighted density–tracer scatter plots for configurations I (a–f), II (g–l) and III (m–q). Blue, yellow and red indicate low, intermediate and high values of the weight, respectively.

The scatter variance is plotted with different components of the perturbation KE in figure 7, in order to compare the scatter to the dynamical evolution of the instabilities. Note that until  $t \approx 50$, the evolution of the 2-D KE is essentially identical for all three configurations, while it remains the same for the 2-D configurations until
 $t \approx 200$. Each configuration shows an increase in scatter variance that occurs just after the initial increase in 2-D KE, with both quantities depicting similar rates of increase. The first peak in the plots of scatter variance correspond to the period during which secondary instabilities have started to develop. For configuration I, the scatter variance undergoes a rapid decrease as the scatter plot begins to converge to its three branch shape, with a slight increase around
 $t=150$. After this, the decrease in scatter variance is quite slow, as is the decrease in 2-D KE, as the flow has reached a stable state. Configuration II observes similar behaviour in the evolution of its scatter variance, but sees a small rapid increase after the onset of pairing (depicted by the rapid increase in 2-D KE around
 $t=300$), corresponding to the spreading of the scatter plot into away from its three branch structure to the filled triangle structure, as depicted in figure 6(\,j,k), respectively. The scatter variance then undergoes a relatively rapid decrease to near zero as the scatter plot reaches its stable compact shape. The scatter variance of configuration III experiences the same rapid increase as the other cases after the initial billow roll-up, but rapidly decreases after the organised 3-D secondary instabilities develop (the 2-D KE sees a rapid decrease during the development of the spanwise instabilities, which appears to relate to a brief breakdown of the billow). The rate of decrease of the scatter variance slows from around
 $t=90$ to
 $130$, following a rapid increase in the 2-D KE (related to a brief reformation of the coherent billow which occurs prior to the complete breakdown of the primary instability and further development of turbulence). It quickly reaches zero around
 $t=150$ as the scatter plot begins to reach its compact tent-like shape.
Perturbation KE (black lines), and scatter variance (grey lines) for (a) configuration I, (b) configuration II and (c) configuration III. Configurations I and II depict only the 2-D kinetic energy, while configuration III depicts both the 2-D KE (solid line) and 3-D KE (dotted line). The values for the kinetic energy are depicted on the left-hand axes, while the values for the scatter variance are depicted on the right-hand axes.

4.3. Convergence principle for scatter plots
Because density and the passive tracer are both governed by advection–diffusion equations without sources or sinks, there exists an important constraint on the evolution of the density–tracer scatter plot (see Plumb (Reference Plumb2007) and references therein. Lauritzen & Thuburn (Reference Lauritzen and Thuburn2012) used this constraint to determine if the mixing in numerical models is physical). In a general sense, scatter plot evolution can be understood as follows. As previously mentioned, stirring will not modify the scatter plot, but bring fluid parcels from different regions closer together (for example, the four parcels represented by the green points in figure 8). Provided the molecular diffusivities of the density and tracer are equal, mixing will homogenise the density–tracer characteristics of parcels within a cell whose size is determined by the diffusivity coefficient. The resulting density–tracer characteristics of this cell are then the averaged values of the initial parcels, weighted by their volumetric ratio (e.g. the red point in figure 8). This implies that the scatter plot after stirring and mixing will be contained within the convex envelope of the initial distribution (region within the red dashed curve in figure 8). Certain properties can be inferred from this constraint:
(a) Whatever the route to turbulence and mixing, the tracer concentration in a given density range remains within the interval determined by the initial convex envelope. This limits the extrema of the tracer concentration in a given density range to the values set by the initial convex envelope.
(b) During mixing, the scatter plot evolves continuously. Thus, at any given time, a scatter plot must lie within the convex envelope of every preceding scatter plot. In addition, extreme values of tracer or density are eroded by mixing. As a result, the convex envelope reduces with time and may eventually converge to a more compact scatter plot.
(c) The convex envelope of a straight line is simply the same straight line. If fluid parcels along a given straight line mix, they will remain confined to that line.
Diagram illustrating the convex envelope constraint on the evolution of a typical density–tracer scatter plot as described in § 4.3.

Note that if the density and tracer have different diffusivities then these convex envelope constraints can be broken, although whether or not this effect is important in practice remains to be determined.
The scatter plot evolution depicted in figure 6 follows each of the constraints listed above. The large-scale dynamical mixing due to the KH billows (both the initial billows and pairing) reduces the overall size of the convex envelopes and thus the scatter plots, and the maximum possible value of the tracer concentration in specific density ranges. After a certain amount of time, the maximum tracer value slowly decreases, showing that mixing at this point is no longer dynamically active between the layers, but acts at smaller, localised scales between adjacent points in density–tracer space. This localised mixing appears responsible for the formation of the nearly linear regions of the converged scatter plots on either side of  $\rho =0$ because the previous arguments can be applied to restricted portions of the scatter plots provided that mixing acts locally in
 $\rho \phi$ space or at reduced scales.
5. Background density and isopycnal mean tracer profile evolution
This section presents the second approach used to describe and quantify the evolution of the tracer field and contrast it with the evolution of the density. It is based on the evolution of mean density and tracer profiles obtained by an adiabatic rearrangement of the density field.
5.1. Background density and effective diffusivity
The traditional approach to representing transport and mixing of tracers in turbulent flows is via a diffusive formulation, i.e. a turbulent diffusivity is sought that represents the effect of the turbulent flow on the tracer. One of the fundamental limitations of this approach is that the diffusive representation of random walks, and by extension, of the effect on tracers of quasi-random flows, describes evolution that is the result of many small random steps. This condition cannot be justified for flows that are spatially inhomogeneous, such as the KH instability considered here, where the typical fluid particle displacement by a single eddy is comparable to the length scale on which the properties of the flow change. One way of overcoming this is to a move to a tracer-based coordinate system. This is the approach in the effective-diffusivity formalism devised by Nakamura (Reference Nakamura1996) and Winters & D'Asaro (Reference Winters and D'Asaro1996). This formalism applies to systems where tracers are advected and diffused. Contours (in two dimensions) or surfaces (in three dimensions) of tracer concentration are used to define coordinate surfaces or contours, but the latter are labelled not by the value of the tracer concentration but the area (in two dimensions) or volume (in three dimensions) enclosed by the surface. If the tracer has some kind of geometric organisation, then the coordinate system and the variation of tracer concentration within that system represent that organisation. For the KH instability and for other flows in density-stratified fluids, the natural tracer is the density and the corresponding tracer-based coordinate,  $z_*$, represents a vertical coordinate. By construction, the density is a function of one space variable,
 $z_*$, and time
 $t$ alone, written as
 $\rho _*(z_*,t)$, which may be shown to satisfy the diffusion equation
 \begin{equation} {\partial \rho_*}/{\partial t} = {\partial }/{\partial z_*}\left(K_\rho{\partial \rho_*}/{\partial z_*}\right), \end{equation}
where  $K_\rho$ is the dimensional effective diapycnal diffusivity of density, defined as
 \begin{equation} \frac{K_\rho (z_*,t)}{\kappa_\rho} = \left\langle\left|\boldsymbol{\nabla} \rho\right|^2\right\rangle_{z_*} \left({\partial \rho_*}/{\partial z_*}\right)^{{-}2}, \end{equation}
where  $\kappa _\rho$ is the molecular diffusivity of density, and
 $\langle \boldsymbol {\cdot }\rangle _{z_*}$ denotes an appropriately defined average over a
 $z_*$ surface (as defined by (C 11) in appendix C). Note that the rearranged (or background) density field
 $\rho _* ( z_*, t)$ may be calculated from the 3-D simulation by rearrangement to construct a monotonic profile. That is, fluid elements, each with a specified infinitesimal volume, are ordered by their density, giving density as a function of cumulative volume (i.e. the volume of fluid with density less than a given value), and then the volume is converted to a vertical coordinate
 $z_*$ by dividing by the horizontal area of the fluid domain. The coordinate
 $z_*$ is then a decreasing function of
 $\rho _*$. The value of
 $z_*$ for a given
 $\rho _*$ is therefore proportional to the integral, down to
 $\rho _*$ of the weight defined previously in § 4.1. (Note that, typically, (5.1) is written in terms of
 $\rho$ and
 $z_*$ (for example, Smyth et al. Reference Smyth, Nash and Moum2005), with
 $\frac {\partial \rho }{\partial z_*}$ implicitly referring to the adiabatic rearrangement of the density field. For clarity,
 $\rho _*$ will be used here for density when it is being regarded as a function of
 $z_*$, and
 $\rho$ will be used when it is being regarded as a function of the Cartesian coordinates
 $(x,y,z)$, such as in the numerator of the right-hand side of (5.2).)
The left-hand column of figure 9 shows the time evolution of the background density profiles sorted from the simulations of the different dynamical configurations (solid lines), and the profiles calculated from (5.1), using the effective diffusivity calculated from those three simulations. The right-hand column plots the final profiles based on the rearrangement of the simulation results and the diffusion equation. The area around the pycnocline is magnified to show the area of interest in better detail. As suggested by the evolution of the cross-sections in figure 3, the profiles of all three simulations undergo similar evolution until the roll-up of the primary KH billows, at which point the pycnocline of configuration III undergoes greater spreading than the 2-D configurations due to the mixing from secondary instabilities. The profiles for the 2-D configurations continue to evolve identically until the onset of pairing, at which point the pycnocline of the configuration II profile widens significantly. After mixing, for both 2-D configurations, the edges of the pycnocline widen slightly until the end of the simulation. The final state of configuration I is an approximately three-layer profile, with a centre layer near  $\rho _*=0$, and rapid changes to the upper and lower layers. Configuration II has a near constant
 $\rho _*=0$ layer of similar width to configuration I, with less steep changes in profile towards the upper and lower layers. The final profile of configuration III differs by not having a constant density middle layer, instead showing the density continuously decrease with height.
Time evolution of the background density profile from the simulations (solid lines) and as calculated from the diffusion equation (5.1) (dashed lines) for (a) configuration I, (b) configuration II and (c) configuration III. The corresponding final density profiles are presented in the right-hand column (d–f), with the background profile given by the solid black line, and the profile from the diffusion equation given by the solid red line. The initial profile is depicted by the blue line. The solid black and dashed red lines overlap almost perfectly.

Equation (5.1) describes the transport which occurs solely through molecular diffusion of  $\rho$, and hence
 $\rho _*$, across
 $z_*$ surfaces (there is no advective component). As discussed by Nakamura (Reference Nakamura1996) and Winters & D'Asaro (Reference Winters and D'Asaro1996) (and in subsequent papers that exploit this formalism, such as Smyth et al. (Reference Smyth, Nash and Moum2005), Salehipour & Peltier (Reference Salehipour and Peltier2015), Zhou et al. (Reference Zhou, Taylor, Caulfield and Linden2017)), the effective diffusivity
 $K_{\rho }$ is determined by the geometry of the full 3-D density field. The dimensionless factor
 $\langle | \boldsymbol {\nabla } \rho |^2 \rangle _{z_*} ( \partial \rho _* / \partial z_* )^{-2}$ has minimum value 1 when the
 $\rho$ surfaces are planes, and increases as the
 $\rho$ surfaces become more complex. Thus whilst there is no advective transport required in (5.1), the indirect effect of advection is to deform the surfaces of
 $\rho$ and hence to increase the effective diffusivity.
The approach first followed here is to investigate whether (5.1) provides a quantitatively useful expression of the effect of transport and mixing on density and whether it can be extended to other tracers. Whilst (5.1) follows exactly from the partial differential equation for advection–diffusion, with a specified value of molecular diffusivity  $\kappa _{\rho }$ without any approximation, the KH instability simulations rely on a numerical implementation of this partial differential equation, and it is first important to establish whether or not this implementation (5.1) remains quantitatively accurate. It is straightforward to solve the one-dimensional diffusion equation (5.1) numerically by providing the history of
 $K_{\rho } (z_*, t)$ calculated using the density field from the numerical simulations, and to compare this predicted evolution of
 $\rho _* ( z_*, t )$ with that given by the numerical simulation itself. In appendix B it is shown that applying this approach using the constant value of
 $\kappa _{\rho }$ specified for the numerical simulation under-predicts the mixing of density in the evolution of the KH instability. The explanation is that the numerical approximations to each of the derivative terms of the governing equations, which have been designed with certain properties (for example, controlling spurious oscillations near discontinuities Shu (Reference Shu, Barth and Deconinck1999)), in effect augment the specified molecular diffusivity. An estimate of the extra diffusivity provided by the numerical schemes is provided by considering the ratio between the time rate of change of the density variance and the variance of the density gradient (see (B 3)). It may be concluded that by this measure, in the simulation depicted (configuration III), the additional time-varying ‘numerical’ diffusivity reaches up to
 $100\,\%$ of the specified molecular diffusivity during the initial billow roll-up. The numerical diffusivity deduced on this basis can be added to
 $\kappa _{\rho }$ to give a time-dependent ‘net diffusivity’
 $\kappa ^{\textit{Net}}_{\rho } (t)$, which helps better represent the behaviour of the higher-order numerical terms in the simulation by a simple advection–diffusion equation. Fortunately, the derivation of the effective diffusivity formulation in appendix C permits the diffusivity provided in the advection–diffusion equation to vary with time without modifying the end result. By adjusting a single quantity,
 $\kappa _{\rho }$, improved agreement is seen in the predicted
 $\rho _*$ as a function of
 $z_*$. Figure 9 indicates that both the computed and rearranged profiles are in very good agreement for the duration of the simulations, especially towards the edges of the pycnocline. The greatest disparity appears for the
 $\rho _*=0$ isopycnal (green lines) in the configuration I (figure 9a), but remains modest. Note that tracer profiles presented in subsequent sections will also be calculated using net tracer diffusivities.
For reference, the corresponding time evolution of the dimensionless  $K_{\rho }$ (i.e. the right-hand side of (5.2)) for configuration III is presented in figure 10. As has been demonstrated in previous papers, and in applications to different flows (e.g. Nakamura Reference Nakamura1996; Winters & D'Asaro Reference Winters and D'Asaro1996; Shuckburgh & Haynes Reference Shuckburgh and Haynes2003), the distortion of
 $\rho$-surfaces leads to a substantial enhancement of
 $K_{\rho }$ relative to
 $\kappa _{\rho }$, and in the case shown, a factor of several hundred at certain stages of the flow evolution. Note also that the difference between
 $\kappa ^{\textrm {Net}}_{\rho } (t)$ and
 $\kappa _{\rho }$ is not very significant in this enhancement but, again, that it is significant in giving precise quantitative agreement between the evolution of
 $\rho _* (z_*, t )$ predicted by (5.1) and the evolution according to the full numerical simulation.
Example of dimensionless effective diffusivity (i.e. the right-hand side of (5.2)) computed from the sorted density profile for configuration III. The colour indicates the dimensionless values of effective diffusivity, while the white lines indicate different values of the background density profile.

5.2. Effective tracer diffusivity
Once  $\rho _*$ is determined, a tracer in the flow can be sorted relative to this density profile by calculating tracer means over isopycnal surfaces,
 \begin{equation} \phi_*\left(z_*,t\right) = \left\langle\phi\left(\boldsymbol{x},t\right)\right\rangle_{z_*}, \end{equation}
as defined by (C 11). Following the process described in appendix C, a complete governing equation for this isopycnal mean tracer profile can be derived. A preliminary step during the derivation provides a formulation that holds for any  $\phi$ and
 $\rho$,
 \begin{equation} (\left\langle \phi\right\rangle_{z_*})_t = \left\langle \phi_t\right\rangle_{z_*} + \frac{{\partial}}{{\partial} z_*} \left(\left( \left\langle \rho_t\right\rangle_{z_*} \left\langle \phi\right\rangle_{z_*} - \left\langle \phi \rho_t\right\rangle_{z_*} \right) \left(\frac{{\partial} \left\langle \rho\right\rangle_{z_*}}{{\partial} z_*}\right)^{{-}1} \right), \end{equation}
provided the time derivatives  $\phi _t$ and
 $\rho _t$ are supplied via specific evolution equations. The final step in the derivation supplies these time derivatives via the advection–diffusion equations (2.1c) and (2.1d) to give
 \begin{align} {\partial \phi_*}/{\partial t} = {\partial }/{\partial z_*}\left(\frac{\kappa_{\phi}}{\kappa_{\rho}} K_\rho{\partial \phi_*}/{\partial z_*}\right) + {\partial }/{\partial z_*}\left(\left({\partial \rho_*}/{\partial z_*}\right)^{{-}1}\left\langle \kappa_{\phi} \boldsymbol{\nabla}\phi^\prime\boldsymbol{\cdot}\boldsymbol{\nabla}\rho - \kappa_{\rho}\phi^\prime\nabla^2\rho\right\rangle_{z_*}\right), \end{align}
where  $\phi$ and
 $\rho$ have diffusivities
 $\kappa _{\phi }$ and
 $\kappa _{\rho }$, respectively. Here,
 $\phi ^\prime =\phi -\phi _*$ represents the perturbation from the mean value of tracer for a given density. The density at each point corresponds to a specific
 $z_*$, and thus
 $\phi _* (z_*,t)$, which is subtracted from the value of the tracer concentration to give
 $\phi ^\prime$. An intermediate formulation could be derived by supplying
 $\rho _t$ via an advection–diffusion equation, but allowing for a more general form of the equation for
 $\phi$. This equation, and the special limit cases in which either one or both tracers are non-diffusive, are discussed in greater detail in appendix C.3.
Focusing on (5.5), the first term on the right-hand side is straightforward – it simply captures the molecular diffusion of  $\phi _*$ taking account of the geometry of the
 $\rho$-surfaces. The second term on the right-hand side takes account of the variation of
 $\phi$ over
 $\rho$-surfaces, represented by the quantity
 $\phi ^\prime$. Estimating this ‘eddy term’ therefore presents a closure problem, since information about
 $\phi ^\prime$ is not available from
 $\phi _*$. There are two distinct contributions to this second term, both requiring non-zero diffusivity. The first, proportional to
 $\kappa _{\phi } \boldsymbol {\nabla } \phi ^\prime \boldsymbol {\cdot }\boldsymbol {\nabla }\rho$ is associated with a diffusive flux of
 $\phi$ across
 $\rho$-surfaces. The second, proportional to
 $-\kappa _{\rho } \phi ^\prime \nabla ^2 \rho$, is associated with the motion of
 $\rho$-surfaces relative to the fluid. Rather than considering the closure problem further, the importance of the tracer eddy term will be investigated by considering a ‘virtual tracer’
 $\phi _{v}(z_*,t)$ which satisfies (5.5) with the tracer eddy term neglected,
 \begin{equation} {\partial \phi_{v}}/{\partial t} = {\partial }/{\partial z_*}\left( \frac{\kappa_{\phi}}{\kappa_{\rho}} K_\rho{\partial \phi_{v}}/{\partial z_*}\right), \end{equation}
where initially  $\phi _{v}(z_*,t=0)=\phi _*(z_*,t=0)$. Figure 11 shows the time evolution of
 $\phi _*$ (solid lines) as calculated from the different dynamical configurations using (5.3), and
 $\phi _{v}$ as calculated from (5.6) (dashed lines), for the tracer layer collocated with the pycnocline. Profiles at specific times corresponding to the cross-sections of figure 4 are presented in figure 12. During the evolution, there exist strong differences between both profiles for all three configurations, starting around
 $t=50$, immediately after the first mixing event. However, with time, both configurations II and III show an increase in agreement. By the end of these simulations (figure 11e,f), there are relatively minor differences towards the centre of the domain and along the edges of the profiles, where the virtual tracer slightly underestimates and overestimates the tracer concentration, respectively. In contrast, configuration I continues to show marked disagreement between the isopycnal mean profiles from simulation and the virtual profiles, with
 $\phi _{v}$ being wider than
 $\phi _*$, and significantly underestimating the amount of tracer at the centre of the domain. This does indicate that, provided there are adequate mixing events,
 $\phi _{v}$ and
 $\phi _*$ can eventually reach good agreement, suggesting that the mean tracer profile resulting from mixing can be predicted using a simple diffusive equation with diffusivity given by the density effective diffusivity. This is not a trivial result as it requires that, during the evolution, the cumulative effect of the eddy term vanishes. The fact that the eddy term vanishes at the end of the simulation may not be enough.
Time evolution of the virtual tracer profiles (dashed lines) and the isopycnal mean tracer profiles from simulations (solid lines) for (a) configuration I, (b) configuration II and (c) configuration III. The corresponding final tracer profiles are presented in the right-hand column (d–f), with the isopycnal mean profile given by the solid black line, and the virtual profile given by the solid red line. The initial profile is given by the blue line.

Isopycnal mean tracer profiles computed from simulations (solid black lines) and virtual tracer profiles calculated from (5.6) (dashed red lines) for the three dynamical configurations (configuration I (a–f), configuration II (g–l) and configuration III (m–q)).

5.3. Relative contribution of the eddy term
In this section, the eddy term is examined in greater detail to assess its relative importance in tracer profile evolution. First note that (5.5) can rewritten in a way that omits the calculation of  $\phi ^\prime$ or its gradient, facilitating the numerical computation of the eddy term,
 \begin{align} {\partial
\phi_*}/{\partial t} &= {\partial }/{\partial
z_*}\left(\frac{\kappa_{\phi}}{\kappa_{\rho}}
K_\rho{\partial \phi_*}/{\partial z_*}\right) + {\partial
}/{\partial z_*}\Big((\partial
\rho_*/\partial z_*)^{{-}1}\big(\kappa_{\phi}
\boldsymbol{\nabla} \phi \boldsymbol{\cdot} \boldsymbol{\nabla}\rho\rangle_{z_*} \nonumber\\
&\quad - \kappa_{\phi}{\partial \phi_*}/{\partial \rho_*}\langle \boldsymbol{\nabla}
\rho \boldsymbol{\cdot} \boldsymbol{\nabla}\rho\rangle_{z_*}-\kappa_\rho \langle \phi \nabla^2\rho\rangle_{z_*} +
\kappa_\rho \phi_* \langle \nabla^2\rho\rangle_{z_*}\big) \Big).
\end{align}
For the simulations presented here, it has been verified that calculating the evolution of  $\phi _*$ using (5.7) with an eddy term computed directly from simulation significantly improves the agreement with the isopycnal mean tracer profile computed from the simulation at all times. The profiles obtained from (5.7) closely match the mean profiles from the 2-D or 3-D fields, even for configuration I, where the isopycnal mean tracer profile from simulation does not converge to a shape similar to the purely diffusive virtual profile. Figure 13 presents the time evolution of the profiles of the diffusive term, eddy term, and time derivative of the isopycnal mean tracer, for the 3-D configuration III. Following the initial roll-up of the billow and the during the development of secondary instabilities (from about
 $t=50$ to
 $130$), both terms show similar structure of the same magnitude, but of opposite sign. This shows that the eddy term is non-negligible, and provides closure for the accurate computation of
 $\phi _*$. Over this time period, both tend to mostly cancel each other, with the resulting time derivative approximately an order of magnitude smaller than either term. This time derivative shows that
 $\phi _*$ undergoes the most rapid change as the secondary instabilities and 3-D structure develop (around
 $t=60$ to
 $80$), although there are still slow changes in
 $\phi _*$ after
 $t=130$. The slow changes indicated by the blue patches about
 $z_*=0$ between
 $t=130$ and
 $150$ are due to contributions from both terms, while the streaks of red in figure 13(c) between
 $t=130$ and
 $200$ around
 $z_*=\pm 2.5$ are due entirely to the diffusive term.
Time evolution of the profile of (a) the diffusive term, (b) the eddy term and (c) the time derivative of the isopycnal mean tracer for the 3-D dynamical configuration (III).

6. Preliminary interpretations of results
For configurations II and III, the reasoning behind the relatively good agreement between the stable state profiles of  $\phi _{v}$ and
 $\phi _*$ is not entirely clear. This section presents possible behaviours and features that may be indicative of a tendency towards good agreement between
 $\phi _{v}$ and
 $\phi _*$, as well as situations that may yield discrepancies between the two.
In § 4.2, it is observed that the scatter plots for the fully mixed configurations II and III (figure 6l,q) tend to compact forms in which there is little to no variation in tracer concentration for a given value of density. Note that there is a strong relationship between the eddy term of (5.5) and the scatter plots, in that perfect compactness ensures that  $\phi ^\prime =0$, and thus the eddy term is null. The behaviour depicted in figure 13 can thus be interpreted as a tendency for the eddy term to generate small-scale perturbations on the mean profile
 $\phi _*$ and for diffusive term to compensate this effect, as long as the eddy term remains active. After the strong mixing phase, the eddy term diminishes, reflecting the convergence to a compact relationship. The scatter plots of both configurations tend to shapes with outer regions in which the density–tracer relationship appears linear (as suggested in § 4.3), and a central region where the relation lies on a curve. The highest values of tracer concentration are located in the curved central region, with tracer values decreasing along the piecewise linear regions towards the edges. Consideration of the weights in density–tracer space shows that each of these three regions correspond to a non-negligible volume of the fluid.
The density–tracer scatter plot is now compared to the virtual tracer plotted as a function of density,  $\phi _{v}(\rho _*)$ for configuration III. Figure 14 plots the end time (
 $t=329$) density–tracer scatter plot (indicated by primarily blue dots between
 $\rho =-1$ and
 $1$), which has converged to a compact relationship that recreates
 $\phi _*(\rho _*)$ (solid grey line overlapping the scatter plot). This convergence is to be expected, since
 $\phi _*$ represents the mean value of the tracer over a given density surface.
 $\phi _{v}(\rho _*)$ is plotted at different times as dashed grey lines, showing that the shape of the virtual tracer curve converges to a shape similar to the compact scatter plot relationship and
 $\phi _*(\rho _*)$. Both figures 11(f) and 14 indicate that although
 $\phi _{v}(\rho _*)$ underestimates the amount of tracer at the central region around
 $\rho _*=0$, and overestimates the amount of tracer along the two outer regions,
 $\phi _*$ and
 $\phi _{v}$ are in relatively good agreement.
Evolution of the virtual tracer profiles (dashed lines) as a function of the background density for the default tracer field of configuration III. The blue and yellow points (inside and outside  $\rho = -1$ and
 $1$, respectively) indicate the density–tracer scatter plot at
 $t=329$, with the solid grey line indicating the isopycnal mean tracer profile as a function of background density at
 $t=329$. The solid black line indicates the ideal tent shape given by (6.3) at
 $t=329$.

As is the case for the scatter plots (and thus  $\phi _*(\rho _*)$),
 $\phi _{v}(\rho _*)$ has tendency towards nearly piecewise linear relationships. Since
 $\phi _{v}$ is a one-dimensional profile, it can be rewritten as
 \begin{equation} \phi_{v}(z_*,t) = F(\rho_*,t). \end{equation}
Substituting (6.1) into (5.6), a new equation in terms of  $F$ can be written as
 \begin{equation} {\partial F}/{\partial t} - \frac{\partial^2 F}{\partial \rho_* ^2} K_\rho\left({\partial \rho_*}/{\partial z}\right)^2 = 0. \end{equation}
This is a type of diffusion equation, under which the curvature of the graph of the function  $F$ might be expected to reduce, and indeed the equation allows a possible steady state with
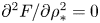 $\partial ^2 F/\partial \rho _* ^2=0$, i.e. with
 $F$ a linear function of
 $\rho _*$. This suggests that the steady state form of
 $F$ might be modelled by a piecewise linear function, which can be used as a framework in which to compare the final stages of
 $\phi _{v}(\rho _*)$ and
 $\phi _*(\rho _*)$.
The mixing event sets the distribution of density weights within a given density range, say  $[\rho _L, \rho _H]$, which will be affected by turbulent mixing over the course of the entire event. Within this range, the total amount of passive tracer is conserved. Therefore, assuming symmetric mixing across the mid-density, a unique ideal piecewise linear tent shape can be entirely determined by the distribution of the density and the total amount of tracer within this range. It can be defined as
 \begin{equation} \phi_{I}(\rho_*) = \begin{cases} \left(\rho_* - \rho_L\right)\left(\dfrac{2\phi_{{Max}}}{\rho_H - \rho_L}\right), & \rho_* \in \left[\rho_L,\rho_M\right],\\ -\left(\rho_* - \rho_H\right)\left(\dfrac{2\phi_{{Max}}}{\rho_H - \rho_L}\right), & \rho_* \in \left[\rho_M,\rho_H\right], \end{cases} \end{equation}
where the maximum tracer concentration value  $\phi _{{Max}}$ occurs at the mid-density defined as
 $\rho _M = (\rho _L + \rho _H)/2$, and is given by solving
 \begin{equation} \phi_{Tot} = \int_{\rho_L}^{\rho_H} \phi_I(\rho) W(\rho)\,\textrm{d}\rho, \end{equation}
where  $\phi _{Tot}$ is the total amount of tracer within the range
 $[\rho _L, \rho _H]$, and
 $W(\rho )$ is the weight function of density at the final state, which is determined from the simulation. Figure 14 depicts
 $\phi _I(\rho _*)$ for configuration III as solid black lines. Though there are important differences that must be considered, the general shape of
 $\phi _I(\rho _*)$ is close to that of
 $\phi _*(\rho _*)$. Primarily, the maximum of the tracer concentration is greater for the ideal tent shape. Given the conservation of total amount of tracer in the mixing region, this discrepancy requires that part of the external branches of
 $\phi _*(\rho _*)$ lie above the linear regions of the ideal tent shape. This indicates that
 $\phi _*(\rho _*)$ has a slightly convex shape in the branch regions. The piecewise linear profile (6.3), with the constraint on
 $\phi _{{Max}}$ implied by (6.4), is an idealisation that, as can be seen from figure 14, has some skill in predicting the actual final relation between tracer and density. However, the prediction is not exact because there is a central range of values of density where the gradient of the function
 $F(\rho _*)$ varies smoothly, rather than changing abruptly as would be required if it were. Thus what happens in the central region is of particular importance for determining the shape of the late time profile defined by
 $F(\rho _*)$ and, in particular, its deviation from a piecewise linear form. Note also that the symmetry assumed in (6.3) is not exact in the simulations discussed here and will not be in general.
The lack of convergence between  $\phi _{v}(z)$ and
 $\phi _*(z)$ for configuration I can be explained by the fact that, in the 2-D simulation, the scatter plot does not tend to a compact relationship. There is a prominent vertical branch at the mid-density (in the central region) corresponding to incomplete homogenisation of tracer along that density surface. Such a feature is impossible to achieve for the virtual profile. However, configuration I seems anomalous for the dynamical configurations tested here, as configurations II and III (the most physically relevant case) demonstrate convergence towards similar vertical profiles. A possible explanation for this is that at intermediate times (for example, configuration III between
 $t=50$ and
 $130$), the forcing provided by the eddy term creates a positive difference between
 $\phi _*$ and
 $\phi _{v}$ near the centre, and negative differences along the sides (e.g. figure 12o). Once the scatter plot reaches a more compact shape, the forcing provided by the eddy term diminishes, allowing diffusion to redistribute
 $\phi _*$ faster than
 $\phi _{v}$ due to its structure. A consequence is that the effective diffusivity of density provides an excellent approximation for the tracer diffusivity in these flows.
7. Sensitivity to variations in the initial tracer field
The comparison of the three different dynamical configurations only considers a tracer that is centred along and of similar width to the pycnocline. The tracer is fully distributed within the density range affected by turbulence and mixing, and its initial gradient is similar in magnitude and geometry to the density. In order to test whether the effective diffusivity provides an adequate representation of tracer mixing in configurations where this is not the case, this section examines the mixing of tracer layers not initially collocated with or of similar width to the pycnocline in the 3-D dynamical configuration III. The background shear and density profiles are maintained as before, but the width and vertical position of the initial tracer profiles are varied by modifying parameters  $a$ and
 $b$ in (2.9), respectively.
7.1. Sensitivity to the vertical extent of the tracer
In § 6, the ideal piecewise linear structure defined by (6.3) depends only the initial values of the tracer at  $\rho =\rho _L$ and
 $\rho =\rho _H$ (taken here to be
 $0$), and the integral quantity of the tracer within the density range
 $[\rho _L, \rho _H]$ affected by the dynamics of the flow,
 $\phi _{Tot}$. To test how strongly the details of the initial tracer distribution influence the final profile, the width and maximum of the initial tracer profile are varied in (2.9) by modifying
 $a$, with
 $b=0$ to keep the tracer collocated with the pycnocline. In the reference configuration for the tracer (i.e. the configuration presented in previous sections),
 $a=1$. When
 $a>1$, the width of the tracer layer is narrower than the that of the reference configuration, while the initial maximum is greater. Therefore, the tracer in these simulations initially resides entirely within the region subject to mixing. The left-hand column of figure 15 presents the evolution of the isopycnal mean tracer profiles from simulation (solid lines) and the virtual profiles (dashed lines) for three passive tracers with initial fields given by (2.9) with
 $a=1$,
 $2$, and
 $5$ (top to bottom), all subject to the same initial dynamical profiles as configuration III. The right-hand column depicts the initial and final profiles for the isopycnal mean (solid blue and black lines, respectively) and final virtual profiles (dashed red line), while profiles at specific times are depicted in figure 16.
(a–c) Evolution of the isopycnal mean tracer profiles from simulation (solid lines) and virtual tracer profiles (dashed lines) with time: (a) wide  $(a=1)$, (b) medium (
 $a=2$) and (c) narrow (
 $a=5$). (d–e) Corresponding initial tracer profiles (blue), final isopycnal mean tracer profiles (black) and final virtual profiles (red).

Isopycnal mean tracer profiles from simulation (solid black lines) and virtual tracer profiles (dashed red lines) for the variable tracer layer width simulations ((a–f) wide ( $a = 1$), (g–l) medium (
 $a = 2$) and (m–r) narrow (
 $a = 5$)).

During the development of the fastest-growing instabilities, and prior to the formation of secondary instabilities around  $t=56$, the virtual and isopycnal mean profiles agree almost perfectly for all three tracers. After the onset of the secondary instabilities, the effective diffusivity overestimates the width of the tracer layers, and the virtual tracer layer is broader than the isopycnal mean tracer layer for all three tracers. At intermediate times (e.g.
 $t=86$), the virtual profiles are smoother than the isopycnal mean profiles, which have slowly changing, low concentration values at the edges, with sharp increases leading towards flatter maximums towards the middle of the domain. This trend continues for the duration of the simulation, although the isopycnal mean and virtual profiles show much better agreement by the end. In each case, the virtual profile tends to underestimate the tracer concentration at the middle of the domain, and overestimate the amount at the edges of the layer. Despite the variation in initial profile widths and maximums, the final profiles for each of the tracers are all of similar magnitudes and shapes.
Figure 17 presents the evolution of density–tracer scatter plots for each tracer layer with different initial widths. The tracer axis has been normalised by the maximum value for the wide tracer layer ( $a=1$) at each time step to better compare scatter plots. Additionally, scatter plots are magnified in the vertical direction between the depicted times. During the initial roll-up of the KH billows, as depicted in figure 17(a,g,m), there is an increase in scattering along
 $\phi$-space as
 $a$ increases. By
 $t=56$ at the onset of secondary instabilities, there is significant scattering induced by the turbulent mixing, filling the area below the initial curves. The maximum concentration of each tracer has been reduced by approximately
 $20~\%$, and there are strong discrepancies between all scatter plots. The outer edges of the scatter plots collapse to protrusions mostly centred at
 $\rho =0$ (
 $t=85$) while maintaining similar maximum tracer values to the previous times. By
 $t=140$, the difference in maximum tracer values of each of the scatter plots has greatly reduced. The amount of scatter over a given density bin varies, however, increasing as the initial profile becomes narrower (
 $a$ increasing). By
 $t=260$, convergence of the scatter plots to similar shapes becomes apparent, with each displaying similar compact relationships in much closer agreement, with minor differences in tracer maximum and concavity. As per figure 10, the effects of turbulent mixing have diminished significantly by this point, with a maximum effective diffusivity of approximately
 $2.5$. Magnifying the scatter plots at the end of the simulation (
 $t=342$) shows that the differences in tracer maximum and concavity persist after the turbulent phase has ended, and the tracers are subject only to diffusive mixing. The similarity between these scatter plots at the end of the simulation suggests that for an arbitrary initial tracer distribution, provided it is entirely within the mixing region, and a sufficiently mixed state has been reached, a reasonable estimate of the final tracer distribution might be obtained using the piecewise linear formulation suggested in § 6.
Density–tracer scatter plots for tracer layers centred along the pycnocline with varying widths, but identical tracer totals ((a–f) wide ( $a = 1$), (g–l) medium (
 $a = 2$) and (m–r) narrow (
 $a = 5$)). Note that the tracer axis is adjusted after each time step as the scatter plots collapse.

The density–tracer scatter plots with the narrow and medium distributions show important cross-isopycnal fluxes of tracers, with a final distribution extending to a wider density range. The amount of tracer affecting new density ranges can be calculated from the knowledge of the density evolution and the total initial tracer amount. Finally, while all three scatter plots tend to nearly piecewise linear tent shapes, the wide (reference) case ( $a=1$) is slightly convex on either side of the tracer maximum, while the scatter plots for the other two tracers are concave on either side of the maximum, with the narrow case (
 $a=5$) being more concave than the medium case (
 $a=3$). Additionally, the tracer concentration maximum increases slightly as
 $a$ increases. This relationship between scatter plot concavity and tracer concentration maximum reflects the observations made about deviations away from the ideal tent shape made in § 6.
7.2. Sensitivity to the vertical position of the tracer
In the results presented in previous sections, all tracer profiles are initially concentrated within the region subject to turbulent mixing. As a result, the amount of tracer initially for densities less than  $\rho =\rho _L$ and greater than
 $\rho =\rho _H$ is null. In this section, the validity of the convergence principle is tested for configurations where the tracer structure is offset above the main turbulent region, so not all the tracer is located within the mixing range. These initial tracer profiles are defined by (2.9), with
 $a=1$, and
 $b$ varied to change the initial vertical position of the tracer. For this simulation,
 $b=0$ sets a layer centred along the pycnocline (i.e. the reference tracer configuration),
 $b=2.86$ is offset above the pycnocline by
 $10\,\%$ of the vertical extent of the domain and
 $b=5.72$ is offset above the pycnocline by
 $20\,\%$ of the vertical extent of the domain. The evolution of tracers subject to these initial conditions for the 3-D configuration III are presented as cross-sections in figure 18. From left to right, the tracers are aligned with the midpoint of the pycnocline (
 $b=0$), slightly offset from the pycnocline (
 $b=2.86$), and completely offset from the pycnocline (
 $b=5.72$). The corresponding density evolution is unchanged, and is depicted in the two right-hand columns of figure 3. The slightly offset tracer initially resides on the edge of the fastest-growing vortex, so that when the KH billow first develops, some of the tracer is entrained into the pycnocline by the vortex, and the tracer layer is significantly distorted. With the onset of small-scale features from the secondary instabilities, the bottom half of this tracer layer is eroded and a thick layer of low tracer concentration develops, extending to the lower edge of the pycnocline. These secondary instabilities affect the interior and upper parts of the high concentration region, but do not significantly mix regions of low and high tracer concentration (e.g. figure 18k), and there remains a layer of relatively high tracer concentration mostly unaffected by mixing. Along the upper edge of this layer, molecular diffusion is the primary source of slow mixing, but this mixing is weak enough to be considered negligible when compared to the strong mixing happening below. The layer of tracer completely offset from the pycnocline is weakly distorted by the outer edge of the billow, but experiences almost no mechanical mixing (some strands of tracer pulled into the secondary instabilities are visible in figure 18t), mostly a spreading of tracer due to diffusion. The effect of the localised mechanical mixing away from the offset tracer layers is visible in the isopycnal mean tracer profiles. The complete time evolution of the isopycnal mean and virtual tracer profiles is presented in the left-hand column of figure 19, with the initial and final profiles presented in the right-hand column. Profiles at specific times corresponding to the cross-sections of figure 18 are presented in figure 20.
Cross-sections of the evolution of tracer layers centred at various depths ((a–g) along the pycnocline ( $b=0$), (h–n) slight offset (
 $b=2.86$) and (o–u) completely offset (
 $b=5.72$)).

(a–c) Evolution of the isopycnal mean tracer profiles with time, (a) along the pycnocline ( $b=0$), (b) slightly offset from the pycnocline (
 $b=2.86$) and (c) completely offset from the pycnocline (
 $b=5.72$), as computed from the simulation (solid lines) and the virtual tracer profiles (dashed lines). (d–f) Corresponding initial tracer profiles (blue), final isopycnal mean tracer profile (black) and final virtual profile (red).

Isopycnal mean tracer profiles (solid black lines) and virtual tracer profiles (dashed red lines) for the simulation where the passive tracers are offset from the pycnocline: (a–g) along the pycnocline ( $b=0$), (h–n) slightly offset from the pycnocline (
 $b=2.86$) and (o–u) completely offset from the pycnocline (
 $b=5.72$).

Compared to the tracers collocated with the pycnocline presented in previous sections, the offset isopycnal mean tracer profiles typically show greater agreement with the virtual profiles throughout the evolution of the flow. The slightly offset tracer shows some disparity at the lower edge of the virtual and isopycnal mean profiles after the onset of the secondary instabilities, and the virtual profile underestimates the maximum value of the profile towards the midpoint of the simulation (e.g.  $t=140$). For the completely offset tracer, the virtual and isopycnal mean profiles appear to agree perfectly for the duration of the simulation. This can be explained by considering that the tracer is located mostly outside the region of strong turbulent mixing and is essentially subject only to slow molecular diffusion. The tracer eddy term is almost null for this tracer distribution, since both
 $\phi ^\prime$ and the gradient of density are nearly zero over the density levels in that region. The full equation for
 $\phi _*$ therefore reduces to the virtual tracer equation in this case.
Figure 21 presents the scatter plots of each of the tracers in figure 18 relative to density. The first thing to note is the offset tracer scatter plots take different initial forms than the centred tracer scatter plot. They are asymmetric, and have different convex envelopes, essentially triangles with corners at the top left, bottom left and bottom right corner of the graphs. The slightly offset tracer ( $b=2.86$) experiences most of its scattering above the concave region of the plot, and tends to a final shape that is nearly piecewise linear, with lines of two different slopes that intersect near
 $\rho =0$. The tracer maximum occurs along an isopycnal with a density lower than the mean. The cross-isopycnal flux of tracer is strong in this case, since at the end of the simulation, a significant quantity of the tracer is distributed over a much wider density range. For most of the flow, the completely offset tracer is modestly affected by mixing and does not show much scattering, although some redistribution of the scatter plot is visible at the lower edge of the tracer layer where it is more significantly eroded by mixing. This tendency for the completely offset tracer to maintain a nearly compact relationship is indicative of the fact that the eddy term remains negligible for the entire simulation. As for the simulations with different tracer layer widths, the present offset configurations show that mixing can strongly modify tracer concentration and entrain significant amounts of tracer into new density ranges.
Density–tracer scatter plots for tracer layers centred at various depths: (a–g) along the pycnocline ( $b=0$), (h–n) slight offset (
 $b=2.86$) and (o–u) completely offset (
 $b=5.72$).

8. Conclusions
This paper uses the classical problem of turbulence arising from Kelvin–Helmholtz instabilities to investigate the mixing of passive tracers. Three different stratified shear configurations providing different routes to turbulence are simulated, and the mixing of different passive tracers layers is examined. Simulations examining the mixing of tracer layers with different widths and vertical positions are performed. Weighted density–tracer scatter plots are proposed as a method through which to analyse diapycnal transport of tracer. When tracer and density diffusivities are equal, a convex envelope constraint can be placed on the evolving scatter plot, which limits on the maximum tracer values achievable in specific density ranges. In the initial stage of the KH instability, when the density and tracer are materially conserved there is no modification of the scatter plots. The stirring effect of the growing KH disturbance eventually enhances diffusive mixing which yields irreversible modifications of the density–tracer scatter plot, such that the plotted points fill a finite area, over the density range affected by the mixing. The area filled then reduces as the tracer and density then relax towards a different compact relation than that set by the initial conditions. Note that a peculiarity of the 2-D case is that there may be a persistent volume of fluid with essentially constant density within which the tracer varies. This does not occur in the more realistic 3-D case. The formulation for the scatter variance as introduced by (4.7) and presented in figure 7 provides an additional diagnostic to compare the evolution of the tracer layer collocated with the pycnocline in each of the three dynamical configurations. Times at which the diagnostic is near zero can also be used to identify if the relationship between the density and tracer has become compact. This can supplement the information available in the weighted scatter plots, as it can be difficult to ascertain whether a compact density–tracer relationship has been reached based only on graphical analysis.
The use of the effective diffusivity derived from the density field as a model for the mixing of the passive tracer has also been examined. This model does not predict the details of the mixing as the KH billow develops (e.g. see figure 12c,i,o), but in configuration II and configuration III (which is the 3-D case and therefore considered to be the most realistic) does make a good prediction of the cumulative effect of the mixing (e.g. figures 12(l,q), 15 and 19). Note that the disagreement is most apparent during the stages of the mixing when a compact density–tracer relationship has not been established. In the single billow case, configuration I, such a relationship is never established, although this is considered to be rather unrealistic.
The approach taken in this paper is to investigate, for  $\phi$ representing the concentration of a passive tracer, to what extent most of the evolution of
 $\phi _*$ is captured by (5.5), with the eddy term ignored. A question beyond the scope of this paper is whether, for cases where the eddy term cannot be ignored, can it be estimated using a closure assumption and whether this can be accomplished whilst retaining the advantages that have been demonstrated for the standard use of a tracer-based coordinate and the corresponding effective diffusivity. Note that Shuckburgh & Haynes (Reference Shuckburgh and Haynes2003) consider whether particle transport can be approximated using an effective diffusivity calculated from a tracer field, i.e. to
 $\kappa _{\phi } =0$, corresponding to Example 2 in appendix C. Some success (at least semi-quantitative) was demonstrated. In terms of the new results given above, this would be equivalent to
 \begin{equation} \frac{{\partial}}{{\partial} z_*} \left ( - \left\langle \phi^\prime \kappa_{\rho} \nabla^2 \rho \right\rangle_{z_*} ({\partial} z_* / {\partial} \rho ) \right ) \simeq \frac{{\partial}}{{\partial} z_*} \left ( K_{\rho} \frac{{\partial} \left\langle \phi\right\rangle_{z_*}}{{\partial} z_*} \right ). \end{equation}
It remains to investigate whether the approximate equality above holds (and, if it does, under what circumstances).
This paper has described tracer transport in KH billows when the diffusivity of the tracer is equal to the diffusivity of the density, i.e. the diffusivity ratio  $\tau = \kappa _\phi /\kappa _\rho$ is equal to
 $1$. However, as noted in the introduction, in geophysical cases
 $\tau$ is typically much smaller than 1. For example, in an oceanic environment where the density is controlled by temperature and the passive tracer is some dissolved chemical species,
 $\tau \sim O(10^{-2})$. Reducing
 $\tau$ from
 $1$ may change the description of tracer transport in several ways. In particular it will break the convex envelope constraint placed on the scatter plot. In the hypothetical limit where only density diffuses and the passive tracer is non-diffusive (
 $\tau =0$), the displacement of the points on the scatter plot would be strictly horizontal, eventually converging to a vertical line located at the mean density. Similarly, if only the passive tracer were diffusive and the density is non-diffusive (
 $\tau \to \infty$), the displacement of points would be entirely vertical, leading to a horizontal line at the tracer mean. It therefore remains to be determined what constraints can be placed on scatter plots for tracers with different diffusivities. Reducing
 $\tau$ may also alter how well the virtual tracer represents the isopycnal mean tracer evolution. Preliminary simulations in which the tracer density is reduced moderately relative to that for the density (
 $\tau \sim O(10^{-1})$) have shown reasonable agreement between the virtual and isopycnal mean tracer profiles in the sense that the virtual tracer still provides useful estimate of the cumulative effect of the mixing event. However, substantial further work would be needed to determine whether this held at smaller values of
 $\tau$ potentially relevant to oceanic mixing. Unfortunately, modelling systems in which two tracers have significantly different diffusivities can be computationally expensive due to the large number of grid points required to adequately resolve the lower diffusivity tracer (Penney & Stastna Reference Penney and Stastna2016), and is beyond the scope of the present study.
It also remains to be determined if these scatter plots provide a useful analysis in the event where the tracer is an active component of the density. For example, if  $\rho$ is a function of
 $\phi$ only, then a
 $\rho \phi$-scatter plot would simply depict the functional form of
 $\rho =\rho (\phi )$. However, if
 $\rho$ is a function of two tracers,
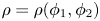 $\rho =\rho (\phi _1,\phi _2)$, it remains to be seen what information could be derived from
 $\rho \phi _1$ or
 $\rho \phi _2$ scatter plots. It is also worth considering a situation in which one is concerned with the mixing of a passive tracer when density is a function of two different active tracers, such as for double-diffusive flows (for example in the ocean, where salt and temperature are the active tracers). Because double diffusion allows for the creation of new density anomalies, this immediately presents the possibility of breaking the convex envelope constraint presented here.
Diffusion is a major component of the physics discussed in the present paper. It is the process by which tracer characteristics are eventually modified, although as demonstrated here, there exist constraints on these modifications that lead to a predictable evolution. The knowledge and control of diffusive terms in numerical models is thus a major issue. In this respect, another result of interest discussed in the present study concerns the evaluation of a net diffusivity to be used in place of the prescribed ‘explicit’ one. Indeed, discretisation and numerical schemes used in models can involve implicit diffusion, accounting for which is shown here to be essential when evaluating (5.5)–(5.7). Note also that implicit diffusivity does not modify the physics of mixing discussed here. For instance, in addition to the  $N_x \times N_z = 512^2$ resolution simulation of configuration II presented in this article, additional tests at resolutions of
 $N_x \times N_z = 256^2$,
 $384^2$ and
 $768^2$ were performed (not shown). In general, the lower the resolution, the larger the implicit numerical diffusivity, and thus, the larger the net diffusivities of the density and tracers. Each of these simulations (including the
 $768^2$ resolution simulation for which the implicit diffusivity is practically negligible), lead to similar convergence of the scatter plots, as well as the virtual and isopycnal mean tracer profiles. This process is thus controlled by diffusivity whatever its origin (prescribed or implicit), not by other properties of the model's numerical schemes. Finally, it is worth mentioning that in oceanic or atmospheric circulation models, horizontal and vertical advection terms are often discretised with different operators involving parameterisations. In these cases, the implicit and explicit diffusion are no longer isotropic, which may violate the constraints and taint the mixing physics discussed in the present paper. A detailed study of such numerical effects is worth investigating.
An important part of the behaviour described here is the evolution towards a compact density–tracer relation during the final stages of the mixing event. This is rather similar to the tracer redistribution along streamlines examined from a theoretical perspective for steady and oscillatory 2-D flows by Rhines & Young (Reference Rhines and Young1983). They describe how, from an arbitrary initial condition, passive tracers will tend to homogenise along streamlines (hence resulting in a compact relationship between a tracer and streamfunction, or indeed between any two tracers). This description cannot be easily extended to the configurations studied here, as density is not a passive tracer, there are strong 3-D effects (for configuration III), and convergence is achieved during the chaotic mixing phase (see figure 7) when no clear streamlines can be identified. On the other hand, the density field clearly plays a similar organisation role on the flow as the steady streamfunction in the Rhines & Young (Reference Rhines and Young1983) case. On general dynamical grounds it is plausible that motion will be stronger along density surfaces than across them and that passive tracers will therefore tend to homogenise along density surfaces. A more complete description of this process would predict the time evolution for the homogenisation and its relation to the time decay of the turbulence in the later stages of the KH mixing event.
Acknowledgements
The authors would like to thank C. Howland, who supplied simulations that aided in the validation of the results presented here. We would also like to express gratitude to the two referees whose comments helped improve this manuscript. This work is part of the TEASAO project, funded by the IDEX Attractivity Chairs programme from the University of Toulouse. Simulations were performed using high-performance computing resources from the CALMIP supercomputing centre in Toulouse (Grant P17008).
Declaration of interests
The authors report no conflict of interest.
Appendix A. Non-Boussinesq, non-hydrostatic system of equations (CROCO model)
The numerical models used in the study of stratified shear generally consider that volume (rather than mass) is conserved, and that the flow satisfies the Boussinesq assumption. For non-hydrostatic, incompressible processes such as Kelvin–Helmholtz instabilities, the system of Boussinesq equations (2.1) accurately represents the flow. From a numerical point of view, the non-hydrostatic implementation of an incompressible flow degenerates to an elliptic system of equations (with respect to acoustic waves). A 3-D Poisson equation must thus be solved to obtain a pressure ‘avatar’ for the resulting flow and several types of algorithms (based on, for example, pressure projection (e.g. Subich, Lamb & Stastna Reference Subich, Lamb and Stastna2013) or pressure correction (e.g. Jiang Reference Jiang2019)) can be implemented to simulate non-hydrostatic flows. When dealing with geophysical flows, whether in the atmosphere or in the ocean, the re-introduction of acoustic waves can lead to efficient numerical algorithms for non-hydrostatic flows (see for instance Janjic, Gerrity & Nickovic (Reference Janjic, Gerrity and Nickovic2001) for atmospheric flows and Auclair et al. (Reference Auclair, Bordois, Dossmann, Duhaut, Paci, Ulses and Nguyen2018) for oceanic flows). Several reasons can explain this at-first-glance paradoxical conclusion: energy transfers are simulated in a presumably consistent way (Tailleux Reference Tailleux2009), and the resulting computations are ‘local’ and they are thus well adapted to massively parallel implementations. In the ocean, the re-introduction of acoustic waves additionally provides a convenient way to simulate non-hydrostatic flows with time-splitting algorithms (Auclair et al. Reference Auclair, Bordois, Dossmann, Duhaut, Paci, Ulses and Nguyen2018).
The numerical simulations presented in this article were performed using the CROCO ocean model. CROCO is a free-surface, non-hydrostatic, non-Boussinesq model. It inherited from ROMS and ROMS-AGRIF (Shchepetkin & McWilliams Reference Shchepetkin and McWilliams2005; Debreu et al. Reference Debreu, Marchesiello, Penven and Cambon2012) their numerically efficient two-mode leapfrog–third-order Adams–Moulton (LF-AM3) time splitting. The non-hydrostatic implementation of this time splitting is conveniently obtained by calling into question the Boussinesq assumption and re-introducing acoustic waves together. The resulting compressible processes are treated in the LF-AM3 fast mode which cannot remain 2-D (barotropic) and becomes 3-D. The resulting system of equations is given in dimensional form by
 \begin{gather} \frac{\partial\rho}{\partial t} ={-}\boldsymbol{\nabla} \boldsymbol{\cdot} \left(\rho\boldsymbol{u}\right), \end{gather}
 \begin{gather}\frac{\partial\rho\boldsymbol{u}}{\partial t} ={-} \boldsymbol{\nabla} \boldsymbol{\cdot} \left(\rho \boldsymbol{u}\otimes\boldsymbol{u}\right) -\boldsymbol{\nabla} p - \rho g \boldsymbol{\hat{k}} + \rho\nu \nabla^2 \boldsymbol{u} + \rho\lambda \boldsymbol{\nabla} \boldsymbol{\nabla} \boldsymbol{\cdot} \boldsymbol{u}, \end{gather}
 \begin{gather}\frac{\partial\rho_h}{\partial t} ={-} \boldsymbol{\nabla} \boldsymbol{\cdot} \left(\rho_h \boldsymbol{u} \right) + \kappa_{\rho} \nabla^2 \rho_h, \end{gather}
 \begin{gather}\frac{\partial\rho\phi}{\partial t} ={-} \boldsymbol{\nabla} \boldsymbol{\cdot} \left(\rho\phi \boldsymbol{u} \right) +\rho\kappa_{\phi} \nabla^2 \phi, \end{gather}
 \begin{gather}\rho =\rho_h+\delta\rho, \end{gather}
where  $\lambda$ is the bulk viscosity. Dimensional parameters used in all simulations presented in this paper, including those used in non-dimensionalisation, are listed in table 2.
Prescribed dimensional parameters consistent across all simulations presented in this paper.

Density components  $\rho _h$ and
 $\delta \rho$ are respectively the hydrostatic, Boussinesq and the non-hydrostatic, non-Boussinesq contributions to density. In the current implementation, the latter compressible density anomaly is linked to the pressure by the first-order relation
 $\delta \rho =c_s^{-2} \delta p$, with
 $\delta p = p-p_h$, where
 $p_h$ is the hydrostatic component of pressure and
 $c_s$ is the speed of sound. As in the original ROMS-AGRIF hydrostatic time splitting, the free-surface anomaly is prognosticated in CROCO fast mode. The speed of sound and number of fast time steps per slow time step,
 $N_{{\rm \Delta} t_{{Fast}}}$, are given in table 3.
Relevant computational parameters of the dynamical configurations presented in this paper.

Concerning first the consequences of the explicit modelling of acoustic waves, sensitivity tests have been carried out in the frame of the present study. The propagation speed of acoustic waves has been modified, and no significant consequences have been found on the evolution of KH instabilities. As far as the consequences of the surface-induced processes are concerned, the studied configurations are based on deep pycnocline and shear-stress layers, hence minimising the interactions between the free-surface and Kelvin–Helmholtz instabilities. Sensitivity studies with a deeper water column (and a deeper pycnocline and shear layer) have shown that the development of the instability is not influenced by the free surface. Only a slight influence in the difference between upper and lower boundary conditions was observed during the pairing and subsequent mixing in the 2-D case with two billows, as the vertical extent of the final billow becomes large. This leads to an asymmetry of the mixing at the edge of the billow, but this effect does not modify the conclusions presented here.
Appendix B. Net diffusivity estimate
Provided the fluid is incompressible, for a tracer governed by an advection–diffusion equation in the form,
 \begin{equation} {\partial \rho}/{\partial t} + \boldsymbol{u}\boldsymbol{\nabla} \boldsymbol{\cdot}\rho = \kappa_\rho \nabla^2\rho, \end{equation}
one can solve for the diffusivity at a given time by multiplying the equation by the tracer field, then integrating over the entire domain, giving
 \begin{equation} \kappa_\rho ={-}\frac{\int_V \dfrac{\partial \rho^2}{\partial t} \textrm{d} V}{2 \int_V \left|\boldsymbol{\nabla} \rho\right|^2 \textrm{d} V}. \end{equation}
For an ideal numerical simulation with perfect numerical schemes, the resulting value of  $\kappa _\rho$ would be constant and equal to the prescribed value at all times. In reality, numerical schemes are imperfect, and the resulting effects due to extra terms can act as extra diffusion inherent to the schemes. The resulting ‘net diffusivity’ will vary with time, and depend on the schemes used, the grid size, the time step and the flow geometry,
 \begin{equation} \kappa_\rho^{Net}\left(t\right) ={-}\frac{\int_V \dfrac{\partial \rho^2}{\partial t} \textrm{d} V}{2 \int_V \left|\boldsymbol{\nabla} \rho\right|^2 \textrm{d} V}. \end{equation}
As an example, the net diffusivities as calculated by (B 3) and normalised by the prescribed molecular value ( $5\times 10^{-3}~\mathrm {m}^2~\mathrm {s}^{-1}$) are presented as a function of time in figure 22 for the density and passive tracer fields with initially different vertical positions (as described in § 7.2) of configuration III. The net estimates all begin at the prescribed molecular value, with the time series for the density and the
 $b=0$ tracer showing similar overall trends: an initial increase of approximately
 $100\,\%$ corresponding to the stretching of the field interfaces by the initial billow formation before decreasing to near the prescribed value as the secondary instabilities collapse the billow. The evolution of the net diffusivity of the middle tracer (
 $b=2.86$) is similar to that of the density and
 $b=0$ tracer, although it only sees a maximum increase of approximately
 $70\,\%$. In contrast, the upper layer of tracer (
 $b=5.72$) experiences a much smaller increase in net diffusivity of about
 $10\,\%$ when the billow initially distorts the field. This increase away from the maximum is much less significant and shorter lived, as there is little meaningful interaction being the upper tracer and the dynamic mixing process.
Evolution of the estimate of global effective diffusivity for the density (solid line) and passive tracer (dashed lines) fields for each of the offset tracers described in § 7.2 normalised by the prescribed molecular diffusivity.

For this study, the net diffusivity was calculated in order to account for the effects of numerical processes when calculating profile evolution. Figure 23 depicts the complete time evolution (with figure 24 depicting profiles at individual times) of the background density profile as a calculated from the rearrangement of the density from simulations (solid lines) versus the profiles calculated from (5.1) using the constant prescribed diffusivity value  $\kappa _\rho$ for the simulation (figure 23a), and the time-dependent net diffusivity
 $\kappa _\rho ^{Net}(t)$ computed from the simulation using (B 3) (figure 23b). Note that the theory used to derive (5.1) and (5.5) as described in appendix C remains unchanged if the diffusivity in the advection–diffusion equation is time dependent, and thus the net diffusivity can be directly applied. As shown in figure 23(a), the isopycnals calculated from the diffusion equation typically lie within the sorted isopycnals, indicating that the constant diffusivity leads to the spreading of the pycnocline being underestimated. Using the time-dependent net diffusivity shows better agreement between the calculated and sorted isopycnals. This is also apparent in the later times shown in figure 24, which also demonstrates that the profiles calculated using the prescribed diffusivity underestimate the steepness of transition at
 $\rho _*=0$.

Background density profiles as calculated from simulation outputs (solid black line), calculated from (5.1) using the time-dependent, net diffusivity  $\kappa _\rho ^{Net}(t)$ (dashed red lines), and calculated from (5.1) using the prescribed, constant diffusivity
 $\kappa _\rho$ (dashed blue lines).

Appendix C. Diffusion equation of one tracer relative to another
C.1. Starting point
Consider flow in a 3-D domain with horizontal area  $A_d$ and, for definiteness, assume that the domain is bounded in the vertical coordinate
 $z$. The density
 $\rho (\boldsymbol {x}, t)$ is assumed to satisfy the advection diffusion equation
 \begin{equation} \frac{\partial\rho}{\partial t} + \boldsymbol{u} \boldsymbol{\cdot} \boldsymbol{\nabla} \rho = \kappa_{\rho} \nabla^2 \rho, \end{equation}
with the velocity field  $\boldsymbol {u} (\boldsymbol {x}, t)$ being non-divergent, and the diffusivity
 $\kappa _\rho$ being either constant or a function of time. Note that for convenience, all variables presented in this appendix are given in their dimensional forms. Following Nakamura (Reference Nakamura1996) and Winters & D'Asaro (Reference Winters and D'Asaro1996), the density field may be used to define a new vertical coordinate
 $z_*$, as follows. For a specified value
 $\rho _*$ of the density, define
 \begin{equation} z_* ( \rho_*, t ) = \frac{1}{A_d} \int_{\rho ( \boldsymbol{x}, t) \ge \rho_*}\textrm{d} V. \end{equation}
Note that  $z_*$ is a monotonically decreasing function of
 $\rho _*$, so the inverse function
 $\rho _* ( z_*, t)$ is well-defined. Now for any field
 $\phi (\boldsymbol {x}, t)$ define
 \begin{equation} \Phi ( \rho_*, t) = \int_{\rho ( \boldsymbol{x}, t) \ge \rho_*} \phi (\boldsymbol{x}, t) \,\textrm{d} V. \end{equation}
Simple vector calculus implies that
 \begin{equation} \frac{{\partial}}{{\partial} t} \Phi ( \rho_*, t) = \int_{\rho ( \boldsymbol{x}, t) \ge \rho_*} \phi_t \,\textrm{d} V + \int_{S(\rho_*)} \phi \rho_t \frac{\textrm{d} A}{| \boldsymbol{\nabla} \rho |}, \end{equation}
and
 \begin{equation} \frac{{\partial}}{{\partial} \rho_*} \Phi ( \rho_*, t) ={-} \int_{S(\rho_*)} \phi \frac{\textrm{d} A}{| \boldsymbol{\nabla} \rho |}, \end{equation}
where the surface  $S(\rho _*)$ is the boundary of the volume
 $\{ \boldsymbol {x} | \rho (\boldsymbol {x}, t) \ge \rho _* \}$ and
 $\textrm{d}A$ is the area element on that surface. Note that it follows from (C 4) and (C 5) with
 $\phi =1/A_d$ that
 \begin{equation} \frac{{\partial}}{{\partial} t} z_* ( \rho_*, t) = \frac{1}{A_d} \int_{S(\rho_*)} \rho_t \frac{\textrm{d} A}{| \boldsymbol{\nabla} \rho |}, \end{equation}
and
 \begin{equation} \frac{{\partial}}{{\partial} \rho_*} z_* ( \rho_*, t) ={-} \frac{1}{A_d} \int_{S(\rho_*)} \frac{\textrm{d} A}{| \boldsymbol{\nabla} \rho |}. \end{equation}
The next step is to consider  $z_* ( \rho _*, t)$, rather than
 $\rho _*$, as an independent variable, i.e. to regard
 $\rho _*$ as a function of
 $z_*$, and
 $t$. Again, using (C 4) and (C 5),
 \begin{equation} \frac{{\partial}}{{\partial} t} \Phi ( \rho(z_*,t) , t ) ={-} \left ( \int_{S(\rho_*)} \phi\frac{\textrm{d} A}{| \boldsymbol{\nabla} \rho |} \right ) \frac{{\partial} \rho_*}{{\partial} t} + \int_{\rho ( \boldsymbol{x}, t) \ge \rho_*} \phi_t \,\textrm{d} V + \int_{S(\rho_*)} \phi \rho_t \frac{\textrm{d} A}{| \boldsymbol{\nabla} \rho |}. \end{equation}
Now note that the condition on  ${\partial } \rho _* / {\partial } t$ for
 $z_* (\rho _*, t)$ to remain constant in time is that
 \begin{equation} - \int_{S(\rho_*)} \rho_t \frac{\textrm{d} A}{| \boldsymbol{\nabla} \rho |} + \frac{{\partial} \rho_*}{{\partial} t} \left ( \int_{S(\rho_*)} \frac{\textrm{d} A}{| \boldsymbol{\nabla} \rho |} \right ) = 0. \end{equation}
Hence using (C 9) to substitute for  ${\partial } \rho _* / {\partial } t$ in (C 8) it follows that, regarding
 $\Phi$ as function of the two variables
 $z_*$ and
 $t$,
 \begin{align} \frac{{\partial}}{{\partial} t} \Phi ( z_*, t ) &={-}\left ( \int_{S(\rho_*)} \phi \frac{\textrm{d} A}{| \boldsymbol{\nabla} \rho |} \right ) \frac{\int_{S(\rho_*)} \rho_t \,\textrm{d} A/| \boldsymbol{\nabla} \rho |}{\int_{S(\rho_*)} \,\textrm{d} A/| \boldsymbol{\nabla} \rho |} \nonumber\\ &\quad + \int_{\rho ( \boldsymbol{x}, t) \ge \rho_*} \phi_t \,\textrm{d} V + \int_{S(\rho_*)} \phi \rho_t \frac{\textrm{d} A}{| \boldsymbol{\nabla} \rho |}. \end{align}
A natural definition of the mean value of  $\phi$ over a
 $z_*$-coordinate surface is given by
 \begin{equation} \left\langle \phi ( z_*, t )\right\rangle_{z_*} = \frac{1}{A_d} \frac{{\partial}}{{\partial} z_*} \Phi ( z_*, t ) = \frac{\int_{S(z_*)} \phi \,\textrm{d} A/| \boldsymbol{\nabla} \rho |}{\int_{S(z_*)} \,\textrm{d} A/| \boldsymbol{\nabla} \rho |} ={-}\frac{1}{A_d} \frac{{\partial} \rho_*}{{\partial} z_*} \int_{S(z_*)} \phi \,\textrm{d} A/| \boldsymbol{\nabla} \rho |, \end{equation}
where the final equality follows from (C 7), noting that  ${\partial } z_* / {\partial } \rho _* = \{ {\partial } \rho _* / {\partial } z_* \}^{-1}$, where both partial derivatives are evaluated for constant
 $t$. (Defining a mean of one quantity over isosurfaces of a different quantity, as suggested here, is a technique often employed in atmospheric sciences (e.g. Butchart & Remsberg Reference Butchart and Remsberg1986; Nakamura Reference Nakamura1995).) To reflect the fact that
 $z_*$ is from now on going to be an independent variable, rather than
 $\rho _*$, the notation
 $S(\rho _*)$ is replaced by
 $S(z_*)$ (but recall that
 $\rho = \rho _*$ on the surface
 $S(z_*)$).
Note that this implies that  $A^{-1}_d \int _{S(\rho _*)} \phi \,\textrm {d} A/| \boldsymbol {\nabla } \rho | = \left \langle \phi \right \rangle _{z_*} ({\partial } \left \langle \rho \right \rangle _{z_*}/{\partial } z_*)^{-1}$, so (C 10) is equivalent to
 \begin{equation} \frac{1}{A_d} \frac{{\partial}}{{\partial} t} \Phi ( z_*, t ) = \left( \left\langle \rho_t\right\rangle_{z_*} \left\langle \phi\right\rangle_{z_*} - \left\langle \phi \rho_t\right\rangle_{z_*} \right) ({\partial} \left\langle \rho\right\rangle_{z_*}/{\partial} z_*)^{{-}1} + \frac{1}{A_d} \int_{\rho ( \boldsymbol{x}, t) \ge \rho_*} \phi_t \,\textrm{d} V. \end{equation}
Now differentiating with respect to  $z_*$ gives, using (C 11) as an identity that holds for any field,
 \begin{equation} (\left\langle \phi\right\rangle_{z_*})_t = \left\langle \phi_t\right\rangle_{z_*} + \frac{{\partial}}{{\partial} z_*} \left(\left( \left\langle \rho_t\right\rangle_{z_*} \left\langle \phi\right\rangle_{z_*} - \left\langle \phi \rho_t\right\rangle_{z_*} \right) \left(\frac{{\partial} \left\langle \rho\right\rangle_{z_*}}{{\partial} z_*}\right)^{{-}1} \right). \end{equation}
C.2. The standard case: $\phi = \rho$

This is the case considered by Nakamura (Reference Nakamura1996) and Winters & D'Asaro (Reference Winters and D'Asaro1996). Note that (C 11) implies the identity
 \begin{equation} \left\langle f(\rho) \psi\right\rangle_{z_*} = f(\left\langle \rho\right\rangle_{z_*}) \left\langle \psi\right\rangle_{z_*} = f( \rho ) \left\langle \psi\right\rangle_{z_*} \end{equation}
for any function  $f(\cdot )$ and for any quantity
 $\psi$. In particular
 $\left \langle \rho _t\right \rangle _{z_*}\left \langle \rho \right \rangle _{z_*} =\left \langle \rho \rho _t\right \rangle _{z_*}$ and hence from (C 13)
 \begin{equation} (\left\langle \rho\right\rangle_{z_*})_t = \left\langle \rho_t\right\rangle_{z_*}. \end{equation}
Because  $\left \langle \rho \right \rangle _{z_*}$ and
 $\rho$ are the same, and
 $\rho _*$ is the notation used for the value of
 $\rho$ on the
 $\rho$-surface which is labelled by
 $z_*$,
 $\rho _*$ will be used instead of
 $\left \langle \rho \right \rangle _{z_*}$.
The standard result on effective diffusivity follows if  $\rho$ is the solution of an advection–diffusion equation, with incompressible flow field
 $\boldsymbol {u} (\boldsymbol {x}, t)$ and diffusivity
 $\kappa _{\rho }$. Then from the above results,
 \begin{equation} {\partial \rho_*}/{\partial t} = \frac{1}{A_d} \frac{{\partial}}{{\partial} z_*} \left ( \int_{\rho ( \boldsymbol{x}, t) \ge \rho_*} ( \kappa_\rho \nabla^2 \rho - \boldsymbol{u} \boldsymbol{\cdot} \boldsymbol{\nabla} \rho ) \,\textrm{d} V \right ) = \frac{1}{A_d} \frac{{\partial}}{{\partial} z_*} \left ( \int_{S (z_*)} \kappa_{\rho} | \boldsymbol{\nabla} \rho | \,\textrm{d} A \right), \end{equation}
where the last equality follows by first using the divergence theorem to transform the volume integral to a surface integral. Then, using the fact that for the term including  $\boldsymbol {u}$ the factor
 $\rho$ is constant on the surface
 $S(z_*)$ and can be taken outside the integral, the incompressibility condition can be applied so that the integral vanishes. The final step is to use (C 7) to introduce a factor
 ${\partial } \rho _* / {\partial } z_*$, giving
 \begin{equation} (\rho_*)_t = \frac{{\partial}}{{\partial} z_*} \left ( \frac{1}{A^2_d} \left[ \int_{S (z_*)} \kappa_{\rho} | \boldsymbol{\nabla} \rho | \,\textrm{d} A \right] \left[ \int_{S (z_*)} \frac{\textrm{d} A}{ | \boldsymbol{\nabla} \rho |} \right] \frac{{\partial} \rho_*}{{\partial} z_*} \right ) = \frac{{\partial}}{{\partial} z_*} \left ( K_{\rho} \frac{{\partial} \rho_*}{{\partial} z_*} \right), \end{equation}
where the effective diffusivity  $K_{\rho }$ is defined by the second equality and hence, via (C 7) and (C 11), is given by
 \begin{equation} K_{\rho} = \kappa_{\rho} \left\langle | \boldsymbol{\nabla} \rho |^2 \right\rangle_{z_*} ({\partial} z_* / {\partial} \rho_* )^2. \end{equation}
C.3. The non-standard case: $\phi \ne \rho$

The question is how to organise (C 13) in this case. The key difference is that  $\phi$ varies on the coordinate surfaces defined by
 $z_*$. Therefore define
 $\phi ^\prime = \phi - \left \langle \phi \right \rangle _{z_*}$ to capture this variation. Assume that
 $\phi$ satisfies an advection–diffusion equation, i.e.
 $\phi _t + \boldsymbol {u} \boldsymbol {\cdot } \boldsymbol {\nabla } \phi = \kappa _{\phi } \nabla ^2 \phi$, allowing the diffusivity of
 $\phi$ to be different from
 $\kappa _{\rho }$, and also either a constant or a function of time. Consider
 \begin{align} \left\langle \phi_t\right\rangle_{z_*} &= \frac{1}{A_d} \frac{{\partial}}{{\partial} z_*} \left ( \int_{S (z_*)} [ \kappa_{\phi} \boldsymbol{\nabla} \phi - \phi \boldsymbol{u} ] \boldsymbol{\cdot} \textrm{d}\boldsymbol{A} \right ) \nonumber\\ &=\frac{1}{A_d} \frac{{\partial}}{{\partial} z_*} \left ( \int_{S (z_*)} [ \kappa_{\phi} \boldsymbol{\nabla} \phi^\prime - \phi^\prime \boldsymbol{u} ] \boldsymbol{\cdot} \textrm{d}\boldsymbol{A} + \int_{S (z_*)} \kappa_{\phi} \boldsymbol{\nabla} \left\langle \phi \right\rangle_{z_*} \boldsymbol{\cdot} \textrm{d}\boldsymbol{A} \right ). \end{align}
The term inside the brackets on the right-hand side of the first equality comes from writing the volume integral of  $\kappa _{\phi } \nabla ^2 \phi - \boldsymbol {u} \boldsymbol {\cdot } \boldsymbol {\nabla } \phi$ as a surface integral using the divergence theorem. In the second equality, the term containing
 $\boldsymbol {u} \left \langle \phi \right \rangle _{z_*}$ is zero by the same reasoning as applied in the previous section. In the second term in brackets on the right-hand side the quantity
 $\boldsymbol {\nabla } \left \langle \phi \right \rangle _{z_*}$ can be rewritten as
 $({\partial } \left \langle \phi \right \rangle _{z_*} / {\partial } \rho _*) \boldsymbol {\nabla } \rho$ and then, again, using the same reasoning as in the previous section, the entire term can be written in terms of
 $K_{\rho }$. Inserting in (C 13) implies that
 \begin{equation} (\left\langle \phi\right\rangle_{z_*})_t = \frac{{\partial}}{{\partial} z_*} \left (\frac{\kappa_{\phi}}{\kappa_{\rho}} K_{\rho} \frac{{\partial} \left\langle \phi\right\rangle_{z_*}}{{\partial} z_*} \right ) + \frac{{\partial}}{{\partial} z_*} \left ( - \left\langle \phi^\prime \rho_t\right\rangle_{z_*} \frac{{\partial} z_*}{{\partial} \rho_*} + \frac{1}{A_d} \int_{S (z_*)} [ \kappa_{\phi} \boldsymbol{\nabla} \phi^\prime - \phi^\prime \boldsymbol{u} ] \boldsymbol{\cdot} \textrm{d}\boldsymbol{A} \right ). \end{equation}
Now consider the two quantities in the bracket in the second term on the right-hand side, which can be combined as a surface integral, using (C 7) and (C 11), plus the fact that  $\textrm {d}\boldsymbol {A} = \boldsymbol {\nabla } \rho \,\textrm {d} A / | \boldsymbol {\nabla } \rho |$, to give
 \begin{align} & -\left\langle \phi^\prime \rho_t\right\rangle_{z_*} \frac{{\partial} z_*}{{\partial} \rho_*} + \frac{1}{A_d} \int_{S (z_*)} [ \kappa_{\phi} \boldsymbol{\nabla} \phi^\prime - \phi^\prime \boldsymbol{u} ] \boldsymbol{\cdot} \textrm{d}\boldsymbol{A} \nonumber\\ &\quad =\frac{1}{A_d} \int_{S(z_*)} \frac{ - \kappa _{\rho} \phi^\prime \nabla^2 \rho + \phi^\prime \boldsymbol{u} \boldsymbol{\cdot} \boldsymbol{\nabla} \rho + \kappa_{\phi} \boldsymbol{\nabla} \phi^\prime \boldsymbol{\cdot} \boldsymbol{\nabla} \rho - \phi^\prime \boldsymbol{u} \boldsymbol{\cdot} \boldsymbol{\nabla} \rho}{| \boldsymbol{\nabla} \rho |} \textrm{d} A \nonumber\\ &\quad = \frac{{\partial} z_*}{{\partial} \rho_*} \left\langle ( \kappa_{\phi} \boldsymbol{\nabla} \phi^\prime \boldsymbol{\cdot} \boldsymbol{\nabla} \rho - \kappa_{\rho} \phi^\prime \nabla^2 \rho ) \right\rangle_{z_*}. \end{align}
Hence, substituting into (C 19),
 \begin{equation} (\left\langle \phi\right\rangle_{z_*})_t = \frac{{\partial}}{{\partial} z_*} \left (\frac{\kappa_{\phi}}{\kappa_{\rho}} K_{\rho} \frac{{\partial} \left\langle \phi\right\rangle_{z_*}}{{\partial} z_*} \right ) + \frac{{\partial}}{{\partial} z_*} \left ( \frac{{\partial} z_*}{{\partial} \rho_*} \left\langle ( \kappa_{\phi} \boldsymbol{\nabla} \phi^\prime \boldsymbol{\cdot} \boldsymbol{\nabla} \rho - \kappa_{\rho} \phi^\prime \nabla^2 \rho ) \right\rangle_{z_*} \right ). \end{equation}
This is the governing equation for  $\left \langle \phi \right \rangle _{z_*}$. Some checks on the form of the above equation are as follows.
Example C.1 When  $\kappa _{\rho } = 0$ and
 $\kappa _{\phi } = 0$ both
 $\rho$ and
 $\phi$ are materially conserved and therefore, since
 $\rho$-surfaces are material surfaces, there will be no change in the total amount of
 $\phi$ within each
 $\rho$-surface. Furthermore the volume within each
 $\rho$-surface remains constant. Therefore for each
 $z_*$,
 $\left \langle \phi \right \rangle _{z_*}$ is constant in time. Equation (C 22) is consistent with this.
Example C.2 When  $\kappa _{\rho } \ne 0$ and
 $\kappa _{\phi } =0$ then
 $\phi$ is materially conserved. The rate of change of the total amount of
 $\phi$ within the volume
 $z_*$ is therefore given by
 \begin{align} \frac{\textrm{d}}{\textrm{d} t} \int_{z_*} \phi \,\textrm{d} V &= \int_{S(z_*)} \phi ( \boldsymbol{u}_S - \boldsymbol{u} ) \boldsymbol{\cdot} \textrm{d}\boldsymbol{A} \nonumber\\ &= \int_{S(z_*)} \phi ( \boldsymbol{u}_S - \boldsymbol{u} ) \boldsymbol{\cdot} \boldsymbol{\nabla} \rho \frac{\textrm{d} A}{|\boldsymbol{\nabla} \rho|} \nonumber\\ &= \left\langle \phi ( \boldsymbol{u}_S - \boldsymbol{u} ) \boldsymbol{\cdot} \boldsymbol{\nabla} \rho \right\rangle_{z_*} ( {\partial} z_* / {\partial} \rho_* ), \end{align}
where  $\boldsymbol {u}_S$ is the local normal velocity of the surface
 $S(z_*)$. Since
 $S(z_*)$ is a surface of constant
 $\rho$ (but the value of
 $\rho$ on the surface varies in time), on
 $S(z_*)$,
 \begin{equation} \rho_t + \boldsymbol{u}_S \boldsymbol{\cdot} \boldsymbol{\nabla} \rho = \kappa_{\rho} \nabla^2 \rho + ( \boldsymbol{u}_S - \boldsymbol{u} ) \boldsymbol{\cdot} \boldsymbol{\nabla} \rho = \alpha (t), \end{equation}
where  $\alpha (t)$ is to be determined by the condition that the volume within the surface
 $S(z_*)$ stays constant, requiring that
 \begin{equation} \int_{S(z_*)} \boldsymbol{u}_S \boldsymbol{\cdot} \textrm{d}\boldsymbol{A} = \int_{S(z_*)} \boldsymbol{u}_S \boldsymbol{\cdot} \boldsymbol{\nabla} \rho \frac{\textrm{d} A}{|\boldsymbol{\nabla} \rho|} = \left\langle \boldsymbol{u}_S \boldsymbol{\cdot} \boldsymbol{\nabla} \rho\right\rangle_{z_*} ( {\partial} z_* / {\partial} \rho_* ) = 0. \end{equation}
Incompressibility implies (e.g. replace  $\boldsymbol {u}_S$ by
 $\boldsymbol {u}$ in the preceding equation) that
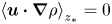 $\left \langle \boldsymbol {u} \boldsymbol {\cdot } \boldsymbol {\nabla } \rho \right \rangle _{z_*} = 0$. Therefore applying
 $\left \langle \boldsymbol {\cdot }\right \rangle _{z_*}$ to (C 24) implies that
 \begin{equation} \alpha(t)=\left\langle \kappa_{\rho} \nabla^2 \rho\right\rangle_{z_*} \end{equation}
and it follows also from (C 24) that  $( \boldsymbol {u}_S - \boldsymbol {u} ) \boldsymbol {\cdot } \boldsymbol {\nabla } \rho = \left \langle \kappa \nabla ^2 \rho \right \rangle _{z_*} - \kappa \nabla ^2 \rho$. Additionally
 $\left \langle (\boldsymbol {u}_S - \boldsymbol {u} ) \boldsymbol {\cdot } \boldsymbol {\nabla } \rho \right \rangle _{z_*} = 0$ implies that
 \begin{equation} \left\langle \phi (\boldsymbol{u}_S - \boldsymbol{u} ) \boldsymbol{\cdot} \boldsymbol{\nabla} \rho\right\rangle_{z_*} = \left\langle \phi^\prime (\boldsymbol{u}_S - \boldsymbol{u} ) \boldsymbol{\cdot} \boldsymbol{\nabla} \rho\right\rangle_{z_*} = \left\langle \phi^\prime ( \left\langle \kappa_{\rho} \nabla^2 \rho\right\rangle_{z_*} - \kappa_{\rho} \nabla^2 \rho ) \right\rangle_{z_*} ={-} \left\langle \phi^\prime \kappa_{\rho} \nabla^2 \rho\right\rangle_{z_*}. \end{equation}
It follows from (C 23) that
 \begin{equation} (\left\langle \phi\right\rangle_{z_*})_t = \frac{{\partial}}{{\partial} z_*} \left ( - \left\langle \phi^\prime \kappa_{\rho} \nabla^2 \rho \right\rangle_{z_*} ( {\partial} z_* / {\partial} \rho_* ) \right ), \end{equation}
consistent with (C 22) when  $\kappa _{\phi } =0$.
Example C.3 When (formally)  $\kappa _{\rho } = 0$ but
 $\kappa _{\phi } \ne 0$, then as in Example 1
 $\rho$-surfaces are material surfaces, and there is no advective flux of
 $\phi$ across
 $\rho$-surfaces. Therefore the rate of change of the total amount of
 $\phi$ within a
 $\rho$-surface is equal to the diffusive flux across the surface.
 \begin{equation} \frac{\textrm{d}}{\textrm{d} t} \int_{z_*} \phi \,\textrm{d} V = \int_{S(z_*)} \kappa_{\phi} \boldsymbol{\nabla} \phi \boldsymbol{\cdot} \textrm{d}\boldsymbol{A}. \end{equation}
Now write  $\phi = \left \langle \phi (\rho )\right \rangle _{z_*} + \phi ^\prime$ and hence
 $\boldsymbol {\nabla } \phi = ({\partial } \left \langle \phi \right \rangle _{z_*} ) / ( {\partial } \rho ) \boldsymbol {\nabla } \rho + \boldsymbol {\nabla } \phi ^\prime$. It follows that
 \begin{align} \frac{\textrm{d}}{\textrm{d} t} \int_{z_*} \phi \,\textrm{d} V &= \kappa_{\phi} \left ( \frac{{\partial} \left\langle \phi\right\rangle_{z_*}}{{\partial} \rho} \int_{S(z_*)} \boldsymbol{\nabla} \rho \boldsymbol{\cdot} \textrm{d}\boldsymbol{A} + \int_{S(z_*)} \boldsymbol{\nabla} \phi^\prime \boldsymbol{\cdot} \textrm{d}\boldsymbol{A} \right ) \nonumber\\ &= A_d \kappa_{\phi} \left ( \frac{{\partial} \left\langle \phi\right\rangle_{z_*}}{{\partial} \rho} \left\langle | \boldsymbol{\nabla} \rho |^2\right\rangle_{z_*} + \left\langle \boldsymbol{\nabla} \phi^\prime \boldsymbol{\cdot} \boldsymbol{\nabla} \rho\right\rangle_{z_*} \right )\frac{{\partial} z_*}{{\partial} \rho}. \end{align}
Finally, differentiating with respect to  $z_*$, dividing by
 $A_d$ and rearranging the right-hand side,
 \begin{align} (\left\langle \phi\right\rangle_{z_*})_t &= \frac{{\partial}}{{\partial} z_*} \left ( \kappa_{\phi} \left\langle | \boldsymbol{\nabla} \rho |^2\right\rangle_{z_*} \left(\frac{{\partial} z_*}{{\partial} \rho_*}\right)^2 \frac{{\partial} \left\langle \phi\right\rangle_{z_*}}{{\partial} z_*} + \left\langle \boldsymbol{\nabla} \phi^\prime \boldsymbol{\cdot} \boldsymbol{\nabla} \rho\right\rangle_{z_*} \frac{{\partial} z_*}{{\partial} \rho_*} \right ) \nonumber\\ &= \frac{{\partial}}{{\partial} z_*} \left ( \frac{\kappa_{\phi}}{\kappa_{\rho}} K_{\rho} \frac{{\partial} \left\langle \phi\right\rangle_{z_*}}{{\partial} z_*} \right )+ \frac{{\partial}}{{\partial} z_*} \left ( \kappa_{\phi} \left\langle \boldsymbol{\nabla} \phi^\prime \boldsymbol{\cdot} \boldsymbol{\nabla} \rho\right\rangle_{z_*} \frac{{\partial} z_*}{{\partial} \rho} \right ), \end{align}
again consistent with (C 22) in the relevant limit.