


Introduction
Photogrammetry is of fundamental value for certain types of glacier research, more particularly for the observation and estimation of the phenomena of glacier retreat.
Its chief value lies in its convenience for the rapid and thorough survey of a glacier or a glacier system and its surroundings, especially the moraines. Naturally modern stereophotogrammetric methods are meant, not the old plane table photogrammetry based on the use of single photographs. In 1911 ground photogrammetry was the great hope of topographic surveyors. The stereo-autograph, invented by Leut. von Orel of Vienna in 1909 and made by Zeiss, reached completion in 1911; it enabled exact contour lines to be drawn from photographs taken stereoscopically. It soon became apparent, however, that this method was only applicable in mountainous regions where photographs could be taken from high view-points. Since most regions in which topographic surveys are made are flat or of low relief covered to some extent by trees and woods, ground photogrammetry was abandoned as soon as it was possible to use aerial photographs and to plot them by new precise plotting machines. Aerial photogrammetry first became possible in 1923, and since then great developments have taken place. Nearly all countries now use this method for mapping.
Surveys of glaciated regions have also been made by aerial photogrammetry, for instance in Spitsbergen by the Norwegians on a scale of 1:50,000 and in Iceland and Greenland by the Danes. In Sweden the Kebnekajse Glacier was surveyed by aerial photogrammetry and in Greenland a special survey was made by Lacroann on Clavering Ø. Glacier survey from the air tends to be difficult. As weather conditions in glacier regions are mostly bad, it is not easy to obtain the necessary ground control and to mark the control points so that they can be reliably identified on the photographs. In this connexion it should be stressed that only contour maps with a very high degree of accuracy and on a large scale provide a reliable foundation for estimating the retreat of the ice in all zones of a glacier and over the entire glacier. High-precision cameras and plotting instruments are therefore necessary. Extensive survey by the so-called trimetrogon method and with plotting instruments of the multiplex type seems to be insufficient in most cases. With respect to glacier research, it is a disadvantage of aerial photogrammetry that the glaciologist cannot make the survey himself. It can, therefore, be understood that, valuable as are the aerial surveys, less use has been made of their results in glacier research than could have been expected.
For the accurate mapping of glaciers, ground photogrammetry is still convenient in many regions, especially in high mountains. The glaciologist can make the survey himself, using a special, light and not too expensive photo-theodolite, and this instrument can also be used for constructing a trigonometrical net by which to fix the points from which the photographs are taken. The methods and instruments are well known; the literature on them is extensive, and a new description is given in the author’s text-book Photogrammetrie (see bibliography below). The glaciologist using these methods must be a good and hardy mountaineer, and must have some experience as a surveyor. It should be added that ground photogrammetry is easier in glaciated regions than elsewhere. Normally, deep narrow valleys form obstacles to the use of this method, as it is difficult to take suitable photographs in them. In glacier regions, such narrow valleys are filled with the ice of the glacier tongues, so that a good view of the ice surface is usually obtainable from the lateral ridges. Experience proves that by ground photogrammetry large and remote glaciated regions can be surveyed and accurately mapped in a relatively short time. The following surveys may be cited as examples. First, the official topographical survey of the Swiss and Austrian Alps made by ground photogrammetry since 1920, where special care has been taken in fixing and reproducing the firn regions of the glaciers. Great care was also taken by the Deutsche and Österreichische Alpenverein in surveying and plotting the results on a scale of 1:12,500 for its tourist maps which are printed on a scale of 1:25,000. These surveys were started in 1913 and the first tourist map, the Dachsteinkarte, was published in 1915. A collection of such maps was published in 1935. The first glacier survey by this method other than in the Alps was made in 1913 in the outer Pamirs by Deimler; Mason made a survey of the Shaksgam in 1926. Larger glaciated areas were surveyed by the German Alai-Pamir Expedition in 1928; the Zemu Glacier in the Himalayas was surveyed in 1932, the glaciers of Nanga Parbat in 1935 and those of Hornsund (Spitsbergen) in 1938. In South America Kinzl has surveyed the glaciers of the Cordillera Blanca on a scale of 1:50,000 and on a scale of 1:25,000 in the Cordillera Huayhuash. In Africa there is a small but fundamentally important survey by Troll and Wien of the Lewis Glacier on Mount Kenya, on a scale of 1:13,333, and a survey of the Ruwenzori range by Stumpp on a scale of 1:25,000 In 1952 two glaciers of the Cascade Range (north-western U.S.A.) were surveyed by W. Hofmann with the help of American glaciologists.
Most of the ground surveys made by active glaciologists and some of the aerial surveys have provided data for the construction of very accurate maps. These show the full extent of the glaciers with practically exact contour lines and all surface features, e.g. crevasse systems and recent moraines. They are of great importance, not only in showing the characteristics of the glaciers but also for the purpose of making measurements of several kinds, for instance in the determination of the areas of glaciers, or of the angle of slope of each point, or for noting the positions and types of moraines. These accurate maps are of still greater and more fundamental importance for the investigation of the fluctuation of glaciers, especially during the present widespread glacier retreat. If an accurate survey of a region is repeated with the same accuracy, it is possible to estimate the amount of recession. This has been done in the Alps, where accurate surveys of several glaciers have been repeated. A brief summary of the methods applied is given below, together with some other methods which facilitate the observation and estimation of glacier retreat.
I. Determination of Decrease of Glaciated Areas
Two methods are possible.
a. The surface area of the earlier state of the glacier is measured in a zone between two contour lines and compared with the area of the later state of the glacier in a zone between the same contour lines of the earlier state (Fig. 1, p. 309). The marginal loss is thus obtained directly by summarizing the losses of all zones. The method is very simple but not quite correct for the individual zones.
b. To obtain complete accuracy the surface areas of the later and of the earlier state in the zone between the contour lines of each state must be measured (Fig. 2). This gives the true surface areas of every zone in both states. The results are not as uniform as with method (a), but they give a deeper insight into the behaviour and state of the retreating glacier throughout its whole surface.
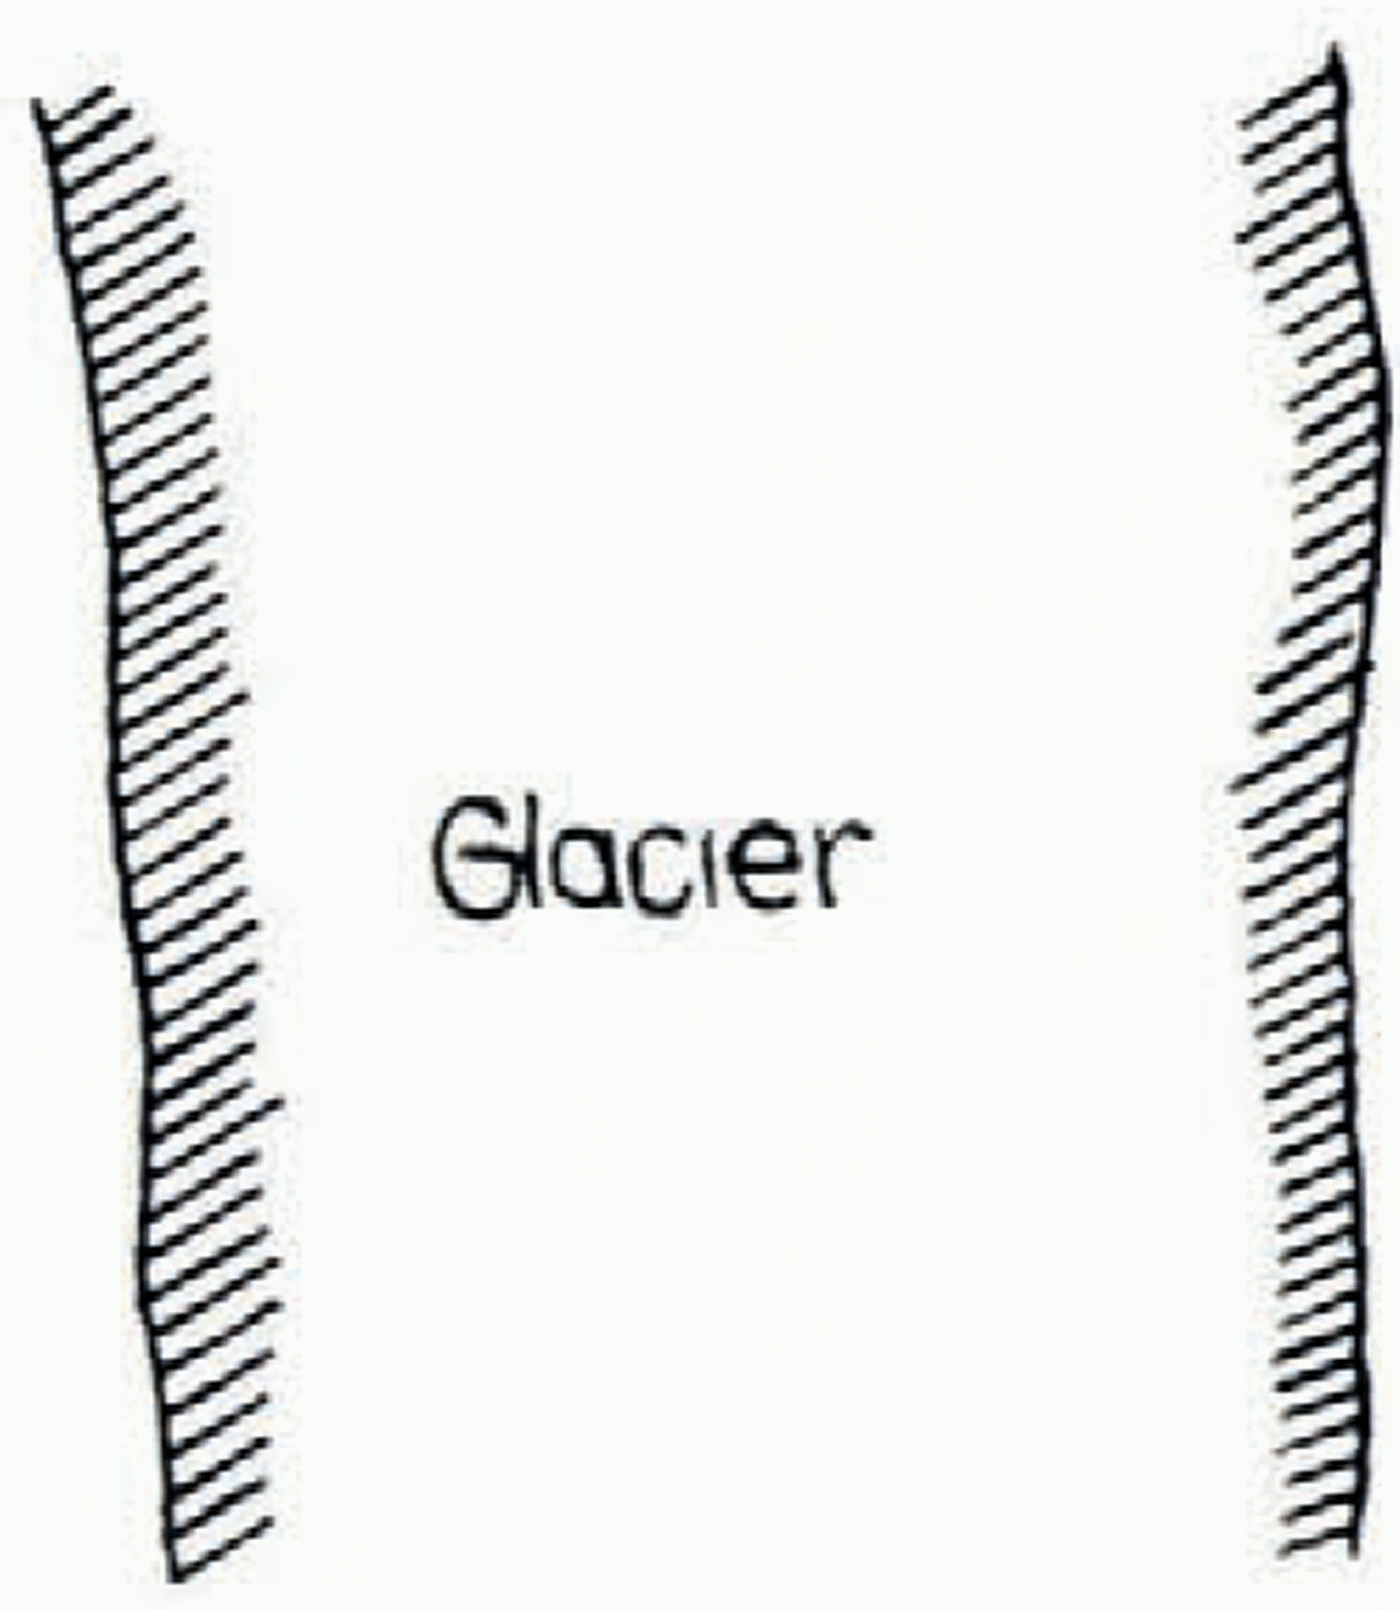
(top left and centre) indicate respectively methods (a) and (b) (see p. 307) for the calculation of the surface retreat. The old surfaces have wide hatching, the new surfaces narrow. For clarity the hatchings have not been extended beyond the centre line of the glacier. The old contour lines are broken, the present contours are continuous
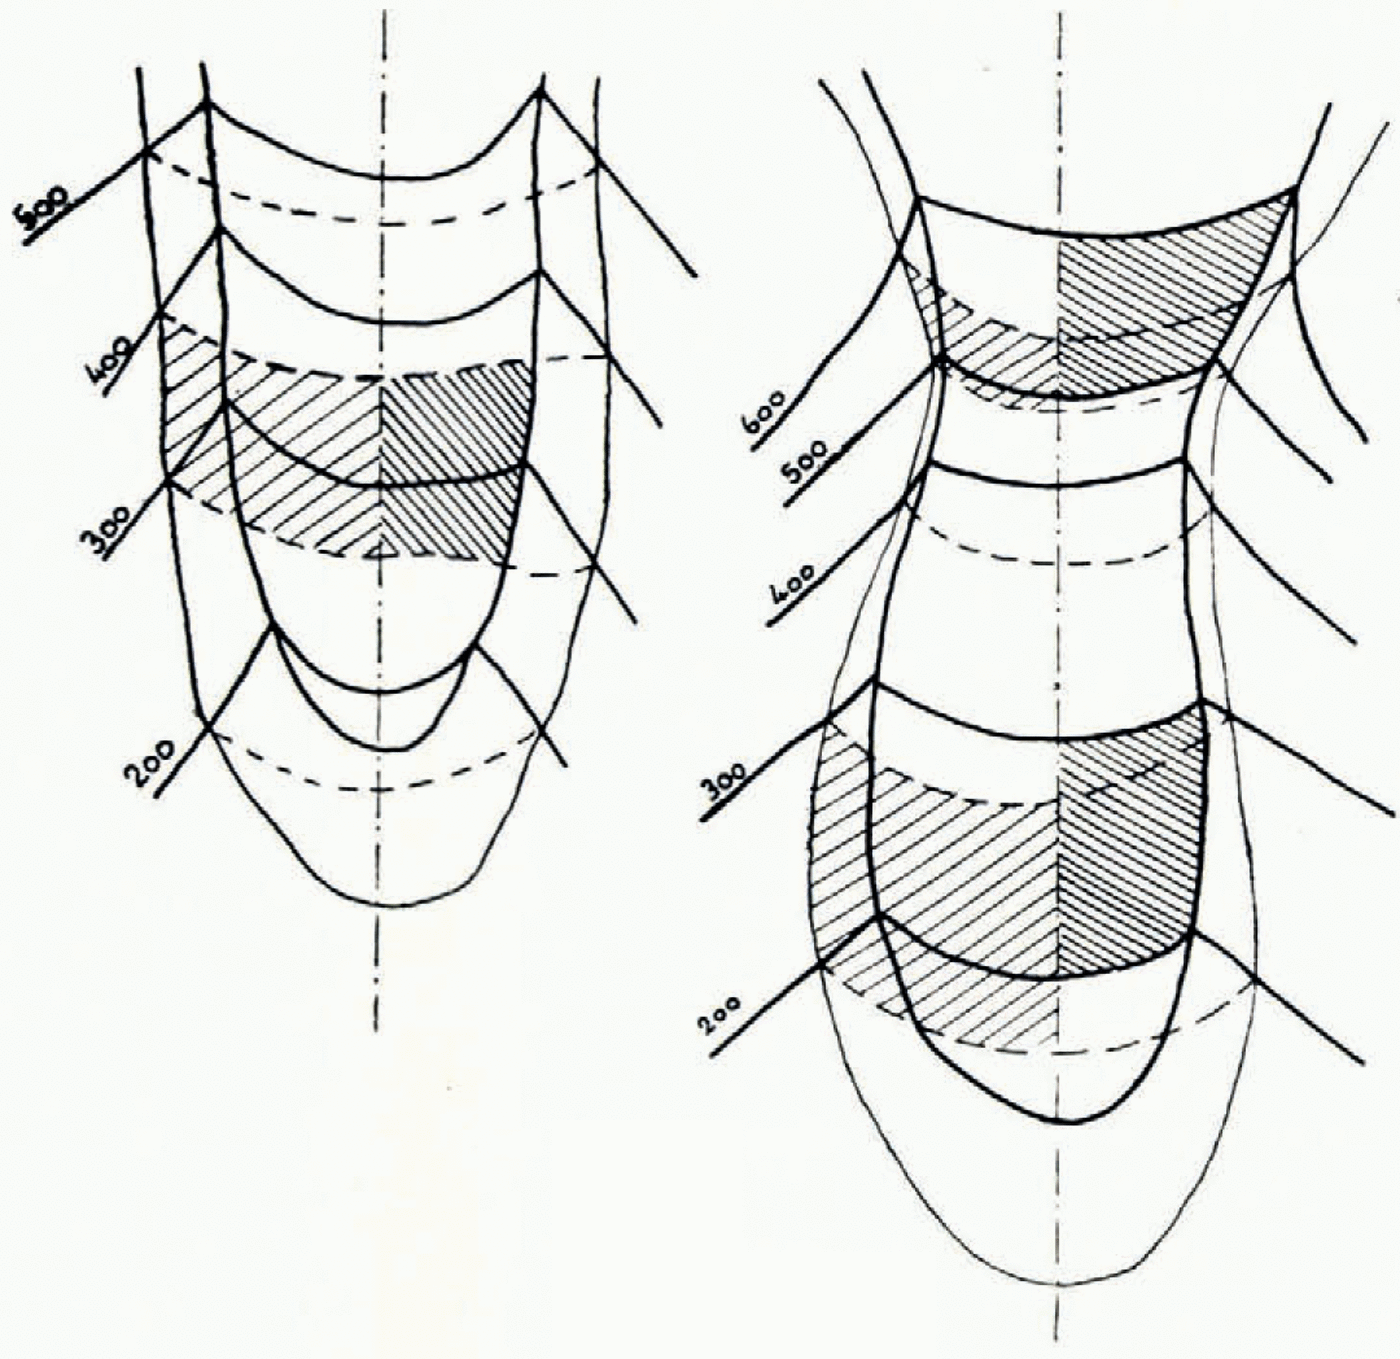
The sum of all zones, obtained by either method, gives the same amount of decrease in surface area.
Both these methods have been applied to eight typical glaciers in the eastern Alps. The result showed a decrease of surface area of between 9 per cent and 24 per cent from 1920 to 1950, and averaging 17 per cent, i.e. an annual decrease of 0.51 per cent of the 1920 surface area. The result is interesting, but certain difficulties present themselves. First, thick glaciers with steep rock slopes on the margins react slowly when retreating, with small losses of surface area, while glaciers with thin tongues react relatively quickly, so that the result does not give an exact picture of the amount of retreat. Secondly, it seems to be difficult to correlate the result with meteorological observations.
II. Determination of the Decrease in the Height of the Surface
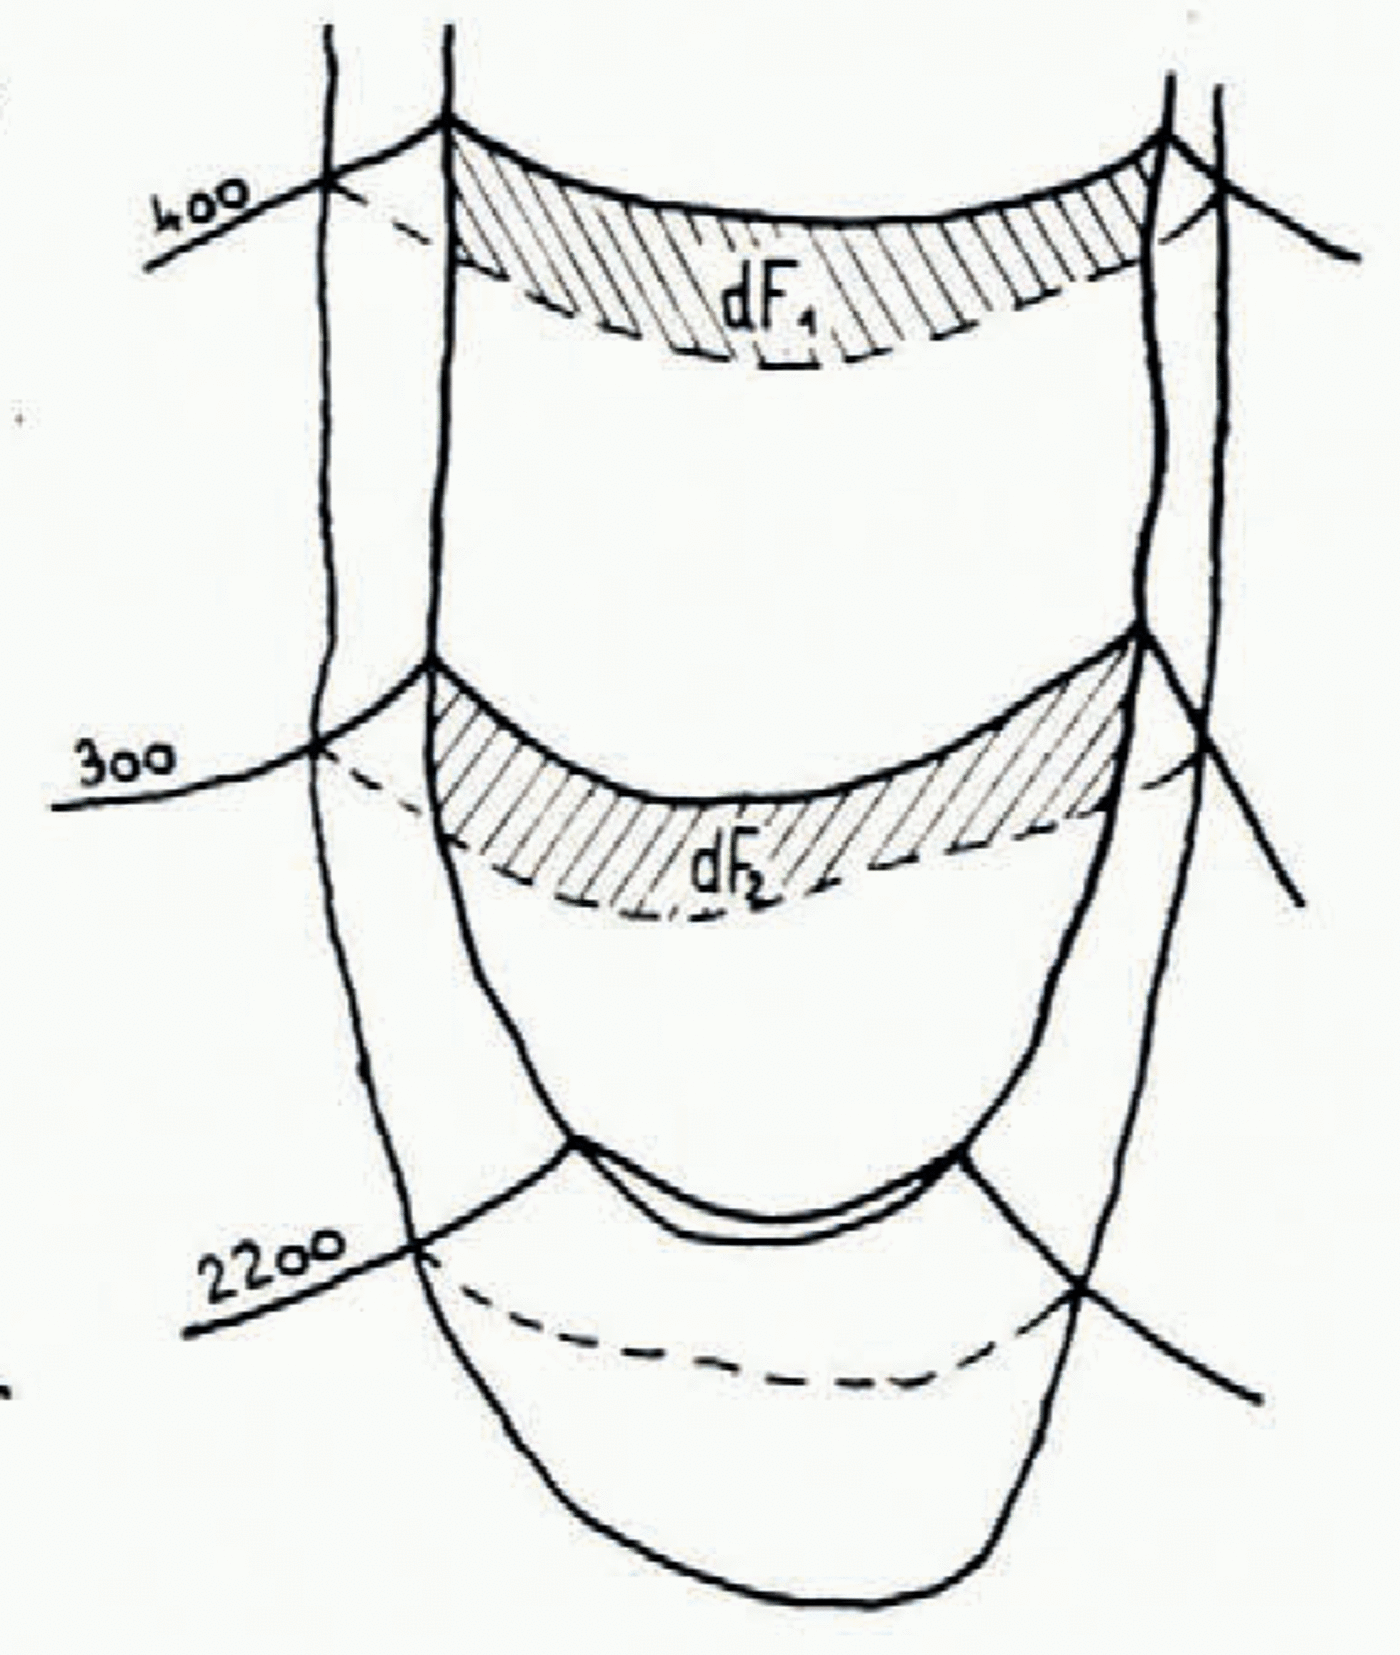
It is possible to determine the decrease in height directly from the contour lines of the two states, but as this decrease varies from point to point, at least from zone to zone, it is better to calculate the decrease in each zone by the formula:

Here dh is the decrease in height of the zone; Δh is the contour interval of the zone, e.g. Δh = 100 m.; for dF 1 and dF 2 see Fig. 3; F 1 and F 2 are the surface areas in a zone measured between two contour lines of the later state and of the earlier state respectively (in this case over the area which has remained covered by ice).
(top right) shows method of calculating decrease in the height of the surface (see p. 308)
In the lower zones the decreases are, of course, larger than in the upper ones. The average diminution of decrease from lower to upper zones is normally a quadratic similar to a parabola. This has been proved for the glaciers of the eastern Alps.
III. Determination of the Decrease in the Volume of Ice
Here we apply the formula:
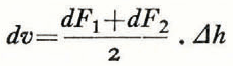
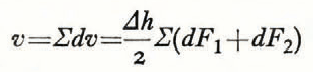
Here dv is the decrease in volume for one zone; v is the decrease in volume for the whole glacier; Δh is the contour interval of the zone, e.g. Δh = 100 m.; dF 1 and dF 2 (Fig. 3) have to be extended over the area formerly covered by ice.
IV. Determination of the Mean Annual Decrease in the Height of a Whole Glacier
For calculating the mean loss of height dh m of the whole glacier in a year we apply the formula:
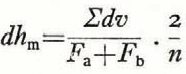
where dh m is the mean annual decrease in height of the whole glacier, F a and F b are the surface areas of the earlier and the later state of the glacier and n is the number of years between the two surveys of the glacier.
The value of dh m characterizes the amount of retreat fairly well. In the eastern Alps it has been determined for several glaciers to be 0.20 to 0.85 m.; the average value of dh m was 0.61 m.±0.06 m./ann. during the period 1920–50. One should encourage the meteorologists to examine this value from their standpoint, in connexion with their records relating to the rise in temperature and radiation.
V. Determination of the Rise of the Snow Line
On a stationary glacier the height of the snow line can be determined from accurate contour lines in the following manner:
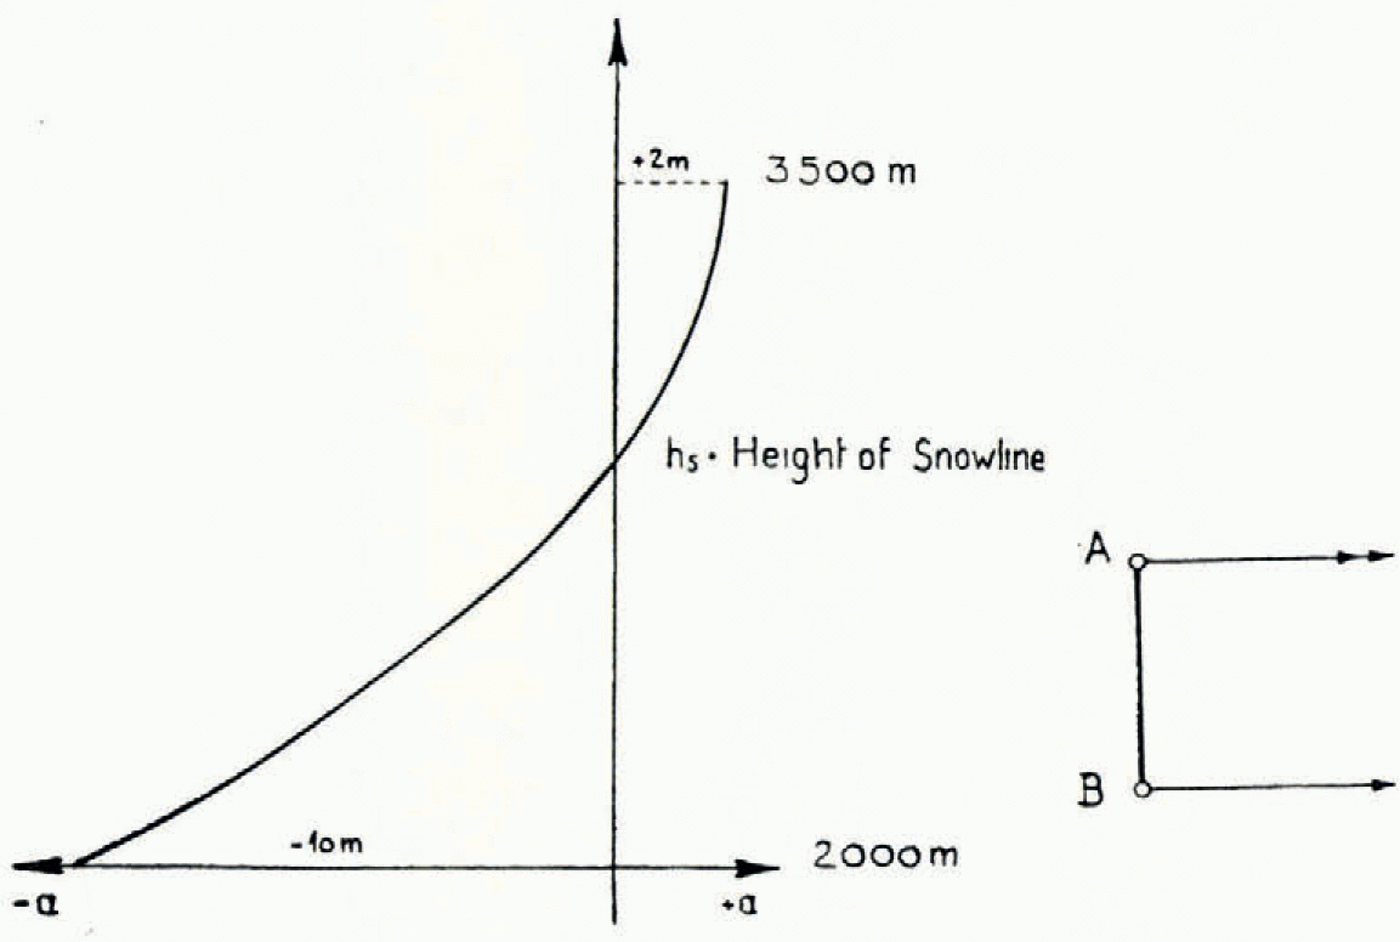
Let a be the amount of accumulation minus ablation in a zone—the value of a is positive in the zones above the snow line, negative in those below it, zero on the snow line itself; let f be the surface area of the zone. Then

This equation signifies that the total amount of accumulation is as large as the amount of ablation with respect to the whole glacier. The value of f for each zone can be taken from the contour map. The corresponding value of a must be obtained from meteorological records. It should be noted that comparatively rough values of a are sufficient. In the eastern Alps and similar mountain ranges the curve for the alteration of a with the height can be shown as a parabola (Fig. 4, p. 309). By assuming the values of a, and by shifting the parabola slightly in a vertical direction, small changes of the values of a are obtained, ensuring the fulfilment of equation (5). In this case the value of zero for a gives the real value of the height of the snow line. It is not necessary for the curve for the variation of a with height to be a parabola; if another type of curve occurs it can be used in the same way as the parabola.
(centre left). Graph showing variation of accumulation and ablation with height (see p. 310)
If two states of a glacier are represented by maps with accurate contour lines, and if in both of these states the glacier was stationary,Footnote * the heights of the snow line in both states can be determined, and from this the amount of rise or fall of the snow line in the interval. For two glaciers in the eastern Alps, the Waxeggkees and the Schlegeiskees in the Zillertaler Alpen, which were both stationary in 1921 and 1950, it was possible to determine the amount of rise of the snow line from 1921 to 1950 by the method summarized above, as 90–92 m. This corresponds with an increase of 0.5° in mean annual temperature during this period. In the same period, the snouts of these glaciers have retreated by a vertical distance of about 300 m. It can indeed be said that glaciers are very sensitive climatic indicators, the indicator scale being given by the rising of the snow line.
VI. Measurements of Ice Velocity and Economy
The method of making these measurements is not based on photogrammetric contour lines; up to the present day they have been made by ground photogrammetry.
a. The measurement of ice velocity. The method is based on the use of photographs, taken at intervals from a point A, on solid ground, looking across the tongue of a large, rapidly flowing glacier. The horizontal displacements of surface, d, caused by the movement of the ice, can be measured stereoscopically as horizontal parallaxes, p, on a stereocomparator. The displacements are calculated by the formula:

where f is the focus of the phototheodolite and s is the distance between the point where the photographs were taken and the point on the ice to be measured; s is easily obtained from a photogrammetric base line between A and another point B (Fig. 5, p. 309). The advantage of this method is that, with comparatively little effort a transverse profile is obtained, showing many values of the velocity between the margin and the middle of the tongue from a single point on solid ground near the glacier, while it is net necessary to mark any point on the glacier itself. As the process is quick and easy it is possible to make such measurements for several transverse profiles of the tongue. The condition for success with this method is a relatively quick rate of movement of the ice; the change of positions on the surface must be larger than changes due to ablation. On account of this photogrammetry must be repeated, normally after a few days, especially in the summer; in autumn a longer interval of time is permissible. Aerial photogrammetry would be useful for measuring changes of position due to glacier movement if vertical photographs were taken from a low altitude, the process being repeated after some days and very precise plotting methods being used. Direct values of the displacement would then be obtained by plotting the two states of the glacier in plan, and velocity values could then be calculated for all points of the glacier surface below the temporary snow line. This method has not, so far, been used.
b. The evaluation of the economy of the glacier. If measurements have been made of the values of ice velocity at many points on the surface of a transverse profile, the depth of the glacier and the shape of the rock bed can be found by the Lagally formula; these findings can be checked by conclusions drawn from the morphological evidence and by the data obtained in the same way from the other transverse profiles. From the surface velocities of the ice the distribution of velocities within the glacier can be calculated, down to the ground where velocity is almost zero. From the measured surface velocities and estimated sub-surface velocities, the volume of ice which is moving can be found by using successive profiles extending from near the snow line to the end of the tongue. The amount of ice flowing through the lower profiles is smaller, and eventually dies out at the end of the tongue. The reduction in the amount of the ice stream between two transverse profiles indicates the loss in volume of the ice by surface ablation; from this the mean annual amount of ablation in cubic metres can be calculated. Direct measurements of ablation by bore-holes provide a check on this method. It is more useful for large glaciers with long tongues. In the firn area it would only be applicable if markers were placed on the firn surface, which is a very troublesome procedure, so that there the photogrammetric method is not greatly superior to the classic method of measuring with a theodolite; but if the ice economy of the whole tongue below the snow line is known, especially the total amount of ablation, it follows that the total amount of accumulation in the firn region is also known, as these two totals are of equal numerical value, the former being negative, the latter positive. These methods have been applied with success on the glaciers of the Alps and of the Alai Pamir, on the Zemu Glacier in the Himalaya, on Nanga Parbat in 1934, and very thoroughly and successfully in Spitsbergen and on Jostedalsbreen in Norway.

(centre right). Positions A and B of cameras for photogrammetric measurement of glacier speed (see p. 310)
If a glacier is investigated twice over a period of time, this method gives a deeper insight into its behaviour, its retreat or advance, in addition to the results reached by the use of the preceding methods.
VII. Estimation of Glacier Fluctuation
By repeated application of the methods referred to above, clear data, numerically expressed, are obtained of the behaviour of glaciers at present in retreat. These data are: loss of surface area and volume, average decrease in height, rise of the snow line, and decrease in velocity and the volume of through-flow. All these methods give results over a period of at the very least one year, in most cases over years and decades. The methods have not as yet been widely applied, as photogrammetry is a young science, and experience in it has been limited. But it appears certain that they can be of great value for glacier research in the future. Examples of methods I to V dealing with glacier retreat in the eastern Alps will be found in the author’s paper of 1931 in the bibliography at the end of this paper, and a full account with a detailed description of the methods and their application, of the apparatus used and of the results will appear in a forthcoming issue of the Zeitschrift für Gletscherhunde und Glazialgeologie. The progress of the annual decrease in height between 1856 and 1950 referred to therein and obtained by repeated photogrammetric measurement of eight typical glaciers of the eastern Alps is given in Fig. 6 (p. 309) of the present paper.
Glacier recession from 1856–1950 (see p. 310). The broken line indicates the secular fluctuation. The figure for the total ablation should be 47.4
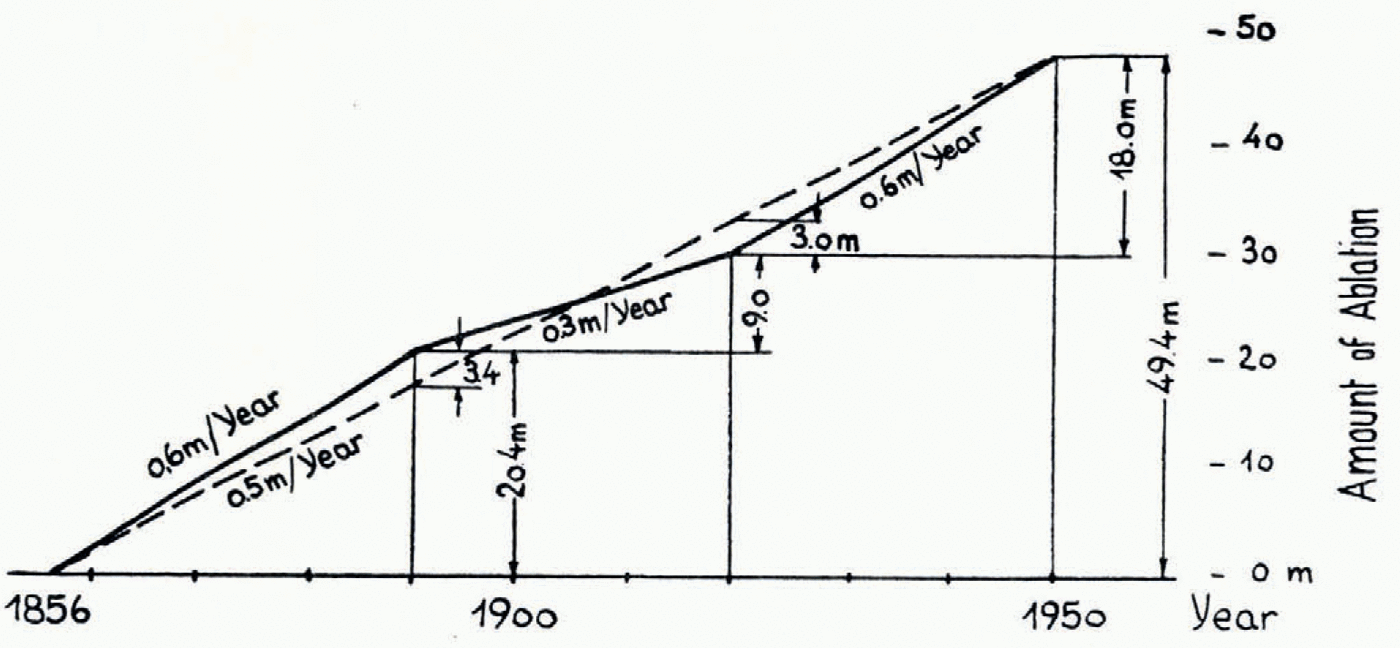
From Fig. 6 it will be seen that glacier retreat occurred in three periods: from 1856 to 1890 the annual decrease in height was 0.6 m., from 1890 to 1920 it was 0.3 m. and from 1920 to 1950 it was again 0.6 m. The average annual decrease from 1856 to 1950 amounted to 0.5 m.; the average total decrease in height in this period was 49.4 m. Thus the existence of a secular fluctuation over the whole period with an intensity of 0.5 m./ann. can be postulated; it is accompanied by the shorter “waves” shown in Fig. 6.
Most of the photogrammetric surveys mentioned make it possible to obtain figures for the amount of glacier retreat, as has been explained. In the Alps this has been achieved by repetition of the surveys, and further surveys should be made in other regions as yet unsurveyed, to provide foundations for the estimation of future glacier retreat. In order to obtain valuable control data and better correlation with meteorological observations, direct measurements of ablation and accumulation according to Ahlmann’s method would be highly desirable so as to reach a worldwide estimate of climatic changes.
Discussion
The following discussion took place after the reading of Professor Finsterwalder’s paper
Professor G. Manley (Bedford College): Professor Finsterwalder’s exposition of the results of his glacier surveys in the eastern Alps is extremely interesting because the fluctuations run in part parallel with those of Iceland and Norway. The maximum advance in Iceland was commonly about 1850, but a number of glaciers show a notable advance to about 1890 which in the Alps has not been evident according to the slide we saw. (Although the Zugspitze maximum in 1886 was also conformable, we should not rely on a single glacier.) Presumably all depend ultimately on the extent to which the cooler Atlantic air pervades Europe during the ablation season. A surge of Atlantic air will affect Iceland and Norway more, and for a longer time, than the eastern Alps. Labrijn’s curves of fluctuations of the ten-year running means of summer temperature appear to show this, although single seasons may not. From the meteorological standpoint Willett has suggested that the present general amelioration began about 1885. The small alpine advances about 1920 are also shown further north, and again in the English temperature record. Hence it seems that if Professor Finsterwalder’s careful surveys of the variations in the level of the snow line can be extended for example in the Himalaya we shall be able to calculate the variations of summer temperature. In many parts of the world where reliable records are lacking we should thus get some idea of how widespread has been the recent amelioration and how long it will last in different regions. This in turn will assist our knowledge of the fundamental reasons for variations in the pattern of atmospheric circulation.
Finally I should like to ask whether measurements have yet become available, from alpine areas, of relative ablation—loss due to radiation, evaporation, convection and condensation, similar to those made by Ahlmann.
Professor Finsterwalder: Very exact measurements have been carried out by Dr. Hoinkes of the Institut für Meteorologie, Innsbruck, on the Vernagtferner and on the Hornkees in the eastern Alps.Footnote *
Mr. W. V. Lewis (Department of Geography, Cambridge): Can Professor Finsterwalder enlighten us concerning the special circumstances associated with the remarkable forward lurches of the Vemagtferner and how these movements bear on the problem of the mechanism of glacier flow?
Professor Finsterwalder: The previously observed forward lurches of the Vernagtferner have been found to continue during the actual recession, but in the form of fluctuations. The cause seems to be the special shape of the firn basin, but a full understanding of this aspect, as of many others, of glacier flow has not yet been reached.
Dr. A. Valentin (Department of Geography, Cambridge): Although scarcely any work of an accuracy comparable with that of Professor Finsterwalder is to be found for other parts of the world, the lengths of many glaciers in the Alps, Scandinavia, Iceland and, more recently, north-western North America have been measured regularly. After the last great advance of the ice in 1850 there appears to have been a general recession up to now, interrupted only by the advance of 1890 and minor advances in 1920 and probably 1938. In my treatise on the coasts of the earth† I correlated the general glacial recession since 1860 with the recent eustatic rise of sea-level of 1–2 mm. a year (calculated from the results of 253 tide gauges all over the world). A curve similar to that obtained for glacier recession has also been obtained from British tide-gauge records. In general slightly rising, it shows a definite minimum in about 1890, 1920 and 1938. This may be considered a direct proof of the glacier-eustatic theory.
Professor Manley: With reference to the last speaker, I feel I should recall that this work appears to be a development of that of Gutenberg which was referred to in a remarkable paper by Thorarinsson, who therein boldly estimated the eustatic rise of sea-level as about 0.5 mm. a year. Although this was perforce based on scanty data it was of the same order of size as Gutenberg’s extimate of 1.0 mm. published in 1938 and based on a world-wide survey of tidal records.
Mr. W. V. Lewis: The very real possibility of detecting movements of mean sea-level associated with glacial recession seems to be borne out by Professor Werenskiold’s estimate, based on his extensive observations of Norwegian glaciers, that these glaciers have lost roughly half their volume in the last fifty years.
Mr. M. M. Miller: It occurs to me that the photogrammetrists and meteorologists, who are such natural partners in the study of glacier position and movement in terms of related causes, should keep in mind the matter of “lag” or delays in the effect on the glacier ends of short-term meteorological changes up in the accumulation area. Some of these changes are not going to be shown in the advance or recession of outlet glaciers for ten to twenty or, in some cases, fifty or more years later. The lag depends upon factors such as the length and the gradient of the valley glacier involved. The principal of lag on some glaciers, therefore, may vitiate our attemps to achieve an exact correlation between known years of eustatic sea-level change and the recorded dates of terminal glacier fluctuation. It would seem that the only solution is to provide detailed studies of all other factors relating to the orography and the economy of the particular glacier(s) involved. Then perhaps more can be said about the time significance of any one particular ice advance or retreat.
Professor Finsterwalder: The lag in the recession of glaciers of different type can be measured by fixing the height of the snow line. We can determine the height of the snow line on glaciers on which there is obviously no lag. For instance in the eastern Alps the Waxegg and Schlegeis glaciers, which have lost their tongues hanging down over steep slopes, are now stationary in their higher positions. Other glaciers in the neighbourhood still have their tongues, which are slowly melting down. On these glaciers we get lower values for the snow line from the calculation by our method. This indicates the lag for each glacier. It is very interesting to study this lag too with the aid of other methods, for instance by measuring the regime, i.e. the balance between accumulation and ablation, in connexion with the measurement of through-flow.
Mr. W. V. Lewis: Would not the photographic surveys carried out by the Swiss and Norwegian Survey Departments for their 1:50,000 maps provide many useful data of the state of the glaciers at the time of the surveys?
Professor Finsterwalder: The photogrammetric material of the Swiss and Norwegian Survey Departments is without doubt very useful, especially if it is possible to use the original contour plans worked out by the plotting machines. For our investigations we have used contour plans on large scales of 1:5,000 and 1:10,000 in order to obtain sufficient accuracy.
Mr. A. Stephenson (Imperial College of Science and Technology) (communicated): Professor Finsterwalder’s paper is very welcome in that it states clearly, and with the authority of experience, the branches of glaciological study in which photogrammetric methods are better than those practised hitherto. He also describes those surveying problems in which photogrammetry, as at present known, cannot produce the answer. For this information we are extremely grateful.
Much has been claimed for photogrammetry with regard to accuracy of plotting from air photographs, and the misconception has arisen that, providing one has sufficient ground control, the correct scale of photography and a suitable plotting machine, almost anything is possible. But, even with such ideal conditions, one still has to consider the suitability of the terrain, as shown in the stereoscopic model, for precise measurements in three dimensions. It is clear from Professor Finsterwalder’s paper that what is required is an extremely accurate delineation, at a fairly close interval, of the contours of an ice and snow surface and the measurements of very small movements of a particular piece of ice (markers being unsuitable). It is interesting to note that Professor Finsterwalder found the contour interval as published on some National Topographic maps was not close enough, and, knowing that the maps were based on air photographs, he referred to the original machine plots where contours were drawn at a closer interval. This is a useful tip and it would be interesting to know what contour interval was available. Nevertheless, it requires a little inside information to know that more contours were plotted than were printed and this will not necessarily always he the case. Admittedly, given the ideal conditions referred to above, it is almost certain that more contours can be plotted from the photographs than are capable of being printed on the published scale, but it may be an expensive matter to obtain these, once the maps have been published.
The accuracy attainable theoretically by photogrammetric methods is affected quite considerably by the nature of the ground being considered, for the state of the surface (e.g. unbroken, freshly fallen snow) and the light conditions can so affect the relative tones in the photographic image that an accurate placing upon it of a floating mark is impossible. To draw contours of the precision required for computations such as those of Professór Finsterwalder’s, an exceptionally clear stereoscopic model is essential, and snow and ice surfaces do not necessarily give this, especially in unsuitable light conditions. It was presumably in connexion with this clearness of the stereosopic model that Professor Finsterwalder found the Multiplex method of projection unsuitable; for, theoretically, this method of optical projection is capable of giving the required accuracy, but the clearness and “solidity” of the stereoscopic model is not so good as that of the mechanical plotting machines.
Concerning the measurement of movement there are two important limiting factors; one referring to the amount of movement, the other to the number of such measurements that are possible. The first is that there must be considerable movement, certainly more than that caused by ablation. This is an obvious limitation, but one that has not always been heeded in the past.
The second factor is implied in Professor Finsterwalder’s statement that in observing the amount of movement it is not necessary to mark artificially any point on the glacier itself. Without such marks the problem becomes one of identification, and the ease. or otherwise, with which this can be done will control the number of transverse sections that can be made. The writer suggests that as many transverse sections can be taken as are desired, but this will depend very much upon having even light conditions throughout the series of observations and upon the number of points that can be identified without any doubt when seen at different times and from different directions. The use of markers will obviate this difficulty, but they are useless when the amount of movement is less than that caused by ablation, and they are not easy to set up and maintain.
With very careful attention to light conditions the difficulties of identification can probably be minimized, and in any case there is more scope in this method than in the alternative method of theodolite measurement. However, there is room for research in this particular branch of the work; Professor Finsterwalder has only referred to the measurement of fairly straightforward movement in a direction at right angles to the direction of photography, but there is also the problem of the multi-directional small movements which will require simultaneous photographic exposures from three or four suitably distributed cameras, and the increased difficulty of identification from three or four directions.
Professor Finsterwalder has rendered a great service to glaciologists in stressing the photogrammetric side of his work, thereby encouraging the use of the best available methods for particular problems.



