1 Introduction
Language sample analysis is regarded as a critical component for diagnosis and tracking of intervention practices in the field of communication disorders (Redmond Reference Redmond2004). These spontaneous language samples provide key information on children's performance across different complementary language skills, such as vocabulary knowledge, speaking rate, utterance formulation, speech fluency, and morphosyntactic complexity. Clinical researchers and practitioners analyze these samples manually and code for specific clinical markers — language patterns — that are known to be good discriminators of language status in children. Together with other language productivity measures, such as mean length of utterance (MLU), number of different words (NDW), and total number of words (TNW) produced, these clinical markers form a conversational profile of the child. Measures from these language samples, such as MLU, have yielded high discrimination accuracy for identifying language impairment in children as young as kindergarten age (Leonard Reference Leonard1998).
Adaptation of automated techniques from the field of natural language processing (NLP) to this problem of language sample analysis seems like a promising direction and there is emerging research exploring this path (Sagae, Lavie and MacWhinney Reference Sagae, Lavie and MacWhinney2005; Roark, Mitchell and Hollingshead Reference Roark, Mitchell and Hollingshead2007a; Roark, Mitchell and Kaye Reference Roark, Mitchell and Kaye2007b; Gabani et al. Reference Gabani, Sherman, Solorio, Liu, Bedore and Peña2009; Roark et al. Reference Roark, Bachrach, Cardenas and Pallier2009). In addition to streamlining the process of language sample analysis, the automated extraction of features from transcripts and the use of statistical methods for language status prediction allow the study of a wide variety of features, which in turn might lead to the discovery of new clinical markers and the development of more robust assessment tools.
Feature extraction methods driven by NLP have not been fully explored in bilingual samples. Bilingualism is of interest because worldwide many children have exposure to more than one language. In the U.S. Spanish–English bilinguals are the largest group of children who speak two languages.
An important component in the assessment of language development in bilingual children is the establishment of language dominance. This is relevant for research purposes, e.g., trying to understand bilingual acquisition (Gutiérrez-Clellen and Kreiter Reference Gutiérrez-Clellen and Kreiter2003), studying the similarities, differences, and implications of these, between bilingual and monolingual children with and without language impairment (Paradis et al. Reference Paradis, Crago and Genesee2003; Paradis Reference Paradis2005). It is also critical for educational purposes (e.g., placement of children in bilingual education settings or in special education classrooms). In the educational system, bilingual children are typically tested in English, even though this might not be the better language for some children. Therefore, having practical and accurate approaches for determining the language dominance in bilingual children is an important first step for intervention practices involving bilingual children.
Establishment of language dominance can be considered more of an art than a science. Typically, language dominance decisions are based on parent and teacher questionnaires aimed at measuring language exposure (amount of input and output) of children (e.g., Bedore et al. in press; Gutiérrez-Clellen and Kreiter Reference Gutiérrez-Clellen and Kreiter2003), but a composite score of language productivity measures has also been used (see Paradis et al. Reference Paradis, Crago and Genesee2003). In this study, we propose a machine learning scenario for the categorization of Spanish–English bilingual children into one of three language dominance groups: balanced-bilingual (BB), English-dominant (ED), or Spanish-dominant (SD). We use the first approach, exposure and use of language, to establish reference labels for our bilingual population since it is the most commonly used. We explore the use of a wide range of features automatically extracted from children's narratives including lexico-syntactic featuresFootnote 1 that are commonly used in NLP tasks, features inspired from clinical research, and the adaptation of metrics for readability assessment. The questions we want to answer in this study are the following: (1) Do these automatically derived features provide any discriminative value for predicting language dominance?, (2) How do these features compare to the traditional measures used by speech clinicians and clinical researchers?, and lastly, since we lack consistently annotated data for training a parser for bilingual children's speech, (3) Can we develop an accurate learning approach using features that do not depend on syntactic parsing?
We present in this study a series of experiments that explored a wide range of features for developing language profiles of bilingual children. Our results are encouraging and show that features from NLP can be successfully adapted for the prediction of language dominance in bilingual children.
2 Related work
Automatically derived measures from spoken language samples have been studied previously with the goal of determining their discriminative value for separating the clinical versus the nonclinical population in adults suffering from mild cognitive impairment (Roark et al. Reference Roark, Mitchell and Hollingshead2007, Reference Roark, Mitchell and Kaye2007b). Among the interesting findings from these studies are the results showing that syntactic measures, such as the Yngve score per words, and words per clause, can retain their discriminative value even when they are derived from automatic parsers. Note that the parser was adapted to this task by retraining on in-domain data, but this required only a small amount of manually parsed data. It would be interesting to see how/if the values of these are diminished if no domain adaptation is performed for the parser, as would be the case when no manually parsed data is available. In a later study, Roark et al. explored additional syntactic measures for the same problem (Roark et al. Reference Roark, Bachrach, Cardenas and Pallier2009). The new measures included the POS tags cross entropy, Frazier scoring, dependency distance, and developmental level. When these measures were compared against the ones used in the previous study, some unexpected patterns were observed. For instance, none of the metrics that showed significant differences on the first retelling task yielded statistically significant results on the second one. Moreover, the group with mild cognitive impairment scored higher (better) than the nonclinical group on three measures on the first retelling task. The authors speculate that these higher scores on the clinical group can be attributed to a decreased ability of verbatim recall from this group, which can potentially provoke a higher number of disfluencies and off-topic utterances.
Feng et al. evaluated the correlation of readability metrics designed for elementary school grades and the readability scores of text for adults with intellectual disabilities (Feng, Elhadad and Huenerfauth Reference Feng, Elhadad and Huenerfauth2009). Their study included typical metrics used in readability assessment studies, such as average number of words per sentence, average number of syllables per word, and syntactic and parse-derived features. They also proposed new metrics that consider the specific limitations of the target population: limitations in working memory and discourse representation. The new metrics attempt to measure the demand of memory load imposed by the document by (1) counting the number of entities mentioned per sentence, and in the entire document, and (2) identifying lexical chains and computing several metrics from them, including average length and span of the lexical chains. The evaluation of these metrics showed that all of the features, syntax and parse-based ones, and all the newly proposed ones, except for the average lexical chain length and the number of lexical chains with a span greater than half the document length, have a significant difference between the original texts and their simplified versions. Correlation comparisons between the models and the text comprehension scores of adults with intellectual disabilities showed that the metrics designed specifically for this population were more highly correlated with the comprehension scores than the other models. The study shows that targeting the metrics for the specific characteristics of literacy impairment provides more accurate readability assessments.
3 Our approach for the automated prediction of language dominance
Clinicians and researchers analyze language samples of children looking specifically at language productivity, grammatical errors and speech fluency. A language sample however, might contain additional information that can potentially contribute to develop a richer language profile. Our study is motivated by the hypothesis that a learning approach, exploiting a wide variety of language features, can yield an acceptable prediction accuracy to provide support to clinical researchers and practitioners in the task of assessing the language dominance of bilingual children.
We frame the problem of language dominance prediction as a three-way supervised classification task. Each child should be categorized into one of the three coarse language classes: BB, ED, and SD. For each child we have the transcripts of the retell stories in two languages. In this setting, the transcripts from bilingual children in each language are processed to extract different features. Then, each child is represented by a fixed-length feature vector that combines the features automatically extracted from the transcripts in each language. These feature vectors are then input to a machine learning algorithm that is trained to predict whether the transcripts belong to a BB, an ED, or an SD child. Since the target language for each transcript is known a priori, the feature extraction process uses this knowledge when needed. For instance, computing some complexity measures requires syllabification. Knowing the target language of the transcript allows us to determine which syllabifier to use. In what follows we describe in more detail the data sets we used, the preprocessing of the transcripts, and the features explored in this work for representing the language profile of children.
3.1 Data sets
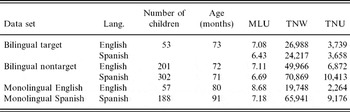
Throughout the experiments presented in this work we make use of four data sets. All of them are transcripts of children in the same age range (~6) years) and contain story narratives of a similar nature.
The transcripts for our target population were gathered as part of an on-going longitudinal study of language impairment in Spanish–English speaking children.Footnote 2 The children in this study were enrolled in kindergarten with a mean age of about 6 years and 1 month. A total of 180 children participated in this study. However, we are working only with a subset of 59 children that the investigators in the original study selected for further studies on language impairment. These children were all bilingual, using both languages at least 20% of the time. They were selected for the study because they scored below the 30th percentile on at least two of four measures of language performance based on a bilingual language screener. Of the 59 children, 6 were excluded from our work due to missing information, yielding a total of 53 bilingual children.
The process for collecting the stories for each language proceeds as follows. The interviewer first narrates a story to the child following the script in (Miller and Iglesias Reference Miller and Iglesias2008) while the child follows the pictures in the book. Then, the child retells the story while looking at the pictures. After this, a new book is handed to the child and he/she is asked to narrate the story, this time without a script. Interviewers follow the protocols for elicitation described in (Berman and Slobin Reference Berman and Slobin1994). These narratives are recorded and then transcribed for manual analysis using the Systematic Analysis of Language Transcripts (Miller and Iglesias Reference Miller and Iglesias2008). We refer to this data set as the bilingual target data set.
For each child in this collection, we have transcripts from four stories: two were told in English and two were told in Spanish, for a total of four transcripts per child. All story narratives use Mayer's wordless picture books (Mayer Reference Mayer1967; Mayer Reference Mayer1969; Mayer Reference Mayer1973; Mayer Reference Mayer1974). The books used for English were “A boy, A dog and a frog” and “Frog, where are you?” The books used for Spanish retelling were “Frog on his own” and “Frog goes to dinner.”
The second data set contains transcripts of 503 Spanish–English bilingual children. This data set can be further divided into Spanish transcripts and English transcripts. The Spanish language transcripts contain 302 story retellings and the English language transcripts contain 201 story retellings from Mayer's book “Frog, where are you?” (Mayer Reference Mayer1969). In the rest of the paper, we refer to this data set as the bilingual nontarget data set. We are unable to use this data set for evaluation because no information regarding bilingual status is available for these children. We take advantage of the large number of transcripts in this data set and use them as reference language patterns by training language models (LMs) with them.
The third data set we used here contains story retells of monolingual English speaking children. This set has a total of 57 transcripts and we refer to this data set as the monolingual English data set. This set uses the story “Frog, where are you?” (Mayer Reference Mayer1969) for the elicitation of speech. Similarly to the bilingual nontarget data set, these monolingual sets of transcripts are not used for testing, but for generating features for LMs as described in Section 3.3.1. Thus, they are considered as a reference for monolingual language patterns.
The fourth and last data set has transcripts from monolingual Spanish speaking children. It was recorded in Guadalajara, Mexico, and has a total of 188 transcripts. The story used in this elicitation task was: “Frog goes to dinner” by Mayer (Reference Mayer1974). This data set is referred as the monolingual Spanish data set.
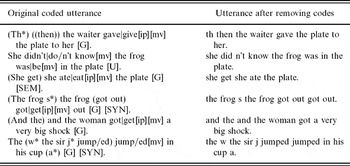
In Table 1, we show a summary describing the four data sets. They were all processed in the same manner. First, we removed from the transcripts all manual codes. Most of the transcripts included different levels of coding, from morpheme boundaries, to grammaticality judgments. In these experiments however, we want to assume we only have the transcript available, without additional manual codes. Table 2 shows an example of an excerpt that was human coded and the resulting one we are using in our experiments after stripping off codes.
Data sets used in this study. Age shows the average age in months of the data set. MLU is mean length of utterance in words. TNW is the total number of words in the set. TNU is the total number of utterances

Transcript excerpts from the target data set. The utterances on the left have been manually coded. The right hand side shows the utterances after all codes have been automatically removed

The cleaned transcripts were POS tagged using the morphological analyzers MOR and POST provided in the CLAN toolkit for each language (MacWhinney Reference MacWhinney2000). The POS tag set we are using is the one developed in the context of the CHILDES data base (MacWhinney Reference MacWhinney and Behrens2008). We decided to use these analyzers since they are customized for children's speech. We do not have a gold standard to measure the POS tagging accuracy of these analyzers. However, in a previous study a manual inspection of two randomly selected transcripts (one in each language) showed a POS tagging accuracy of 90% for English and 84% for Spanish (Gabani et al. Reference Gabani, Sherman, Solorio, Liu, Bedore and Peña2009). Due to low coverage of the lexicons provided in CLAN we had to do some manual adaptation. This step consisted of scanning all words not recognized by the analyzers and adding them to the appropriate lexicons. This step also helped us in identifying partial words. We created a new POS category for the partial words identified from this process.
The morphological analyzers from CLAN are not designed for dealing with code-switching. Therefore, we used a two stage process for automatically assigning POS tags. First, the transcripts are analyzed morphologically by both language versions of MOR and POST. When these analyzers do not recognize the word form they output a “?.” We used this information to POS tag code-switched data by choosing the output of the analyzer that found a valid tag. We used the target language of the transcript to break ties.
3.2 The reference labels
The target data set contains labels of the bilingual status of children made by the clinical researchers that collected the language samples. These reference labels were assigned by analyzing the levels of exposure to each language. Children's parents completed the language use questionnaire via interview by phone or in person. The interview included questions about years of monolingual and bilingual exposure and detailed breakdown of daily input and output in English and Spanish for every hour of a typical weekday and typical weekend days. The questionnaire was based on interview questions drawn from Gutiérrez-Clellen and Kreiter (Reference Gutiérrez-Clellen and Kreiter2003) and Restrepo (Reference Restrepo1998). All interviews were conducted by bilingual examiners. Hour by hour input and output in each language was summed for typical day reported and weighted to estimate a weekly percentage of language output and language input in each language. Language output (use) is considered to be the most functional measure of exposure for initial grouping of the children as it provides a general index of their overall exposure (i.e., exposure over time as well as input and output at the time of interview); and has been shown to correlate significantly with grammatical productivity in the target language (Gutiérrez-Clellen and Kreiter Reference Gutiérrez-Clellen and Kreiter2003).
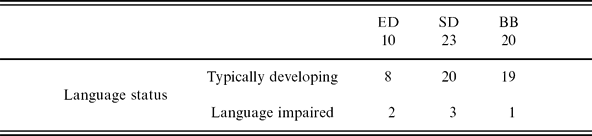
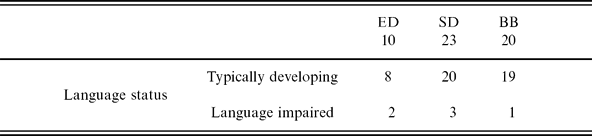
The final decisions on language dominance use the following criteria: children with a language usage and exposure between 55% and 80% Spanish were classified as SD (a total of 23 children fell in this category); ED children had 55%–80% English use/exposure (10 children); BB had reported use and exposure of 45%–55% in each language (20 children). It should be noted that six of the children in this data set were identified as possibly having a language impairment due to their very low scores on the Bilingual English–Spanish Assessment test (Peña et al. in development). It is possible that these children will impact the classification accuracy of the learner. Table 3 shows the language dominance breakdown with respect to the language status, typically developing or potentially language impaired.
Distribution of children by language dominance status in the target data set
Recent analyses of the children in this data set indicate that input and output both correlate significantly with performance in morphosyntax and semantics (Bohman et al. Reference Bohman, Bedore, Peña, Mendez-Perez and Gillam2010). For Spanish morphosyntax, increases in use were related to higher scores (odds ratios of 1.15, p < 0.001.) For Spanish semantics, increases in use and input were positively related to increases in scores (odds ratios of 1.10 and 1.08, p < 0.001, respectively). For English morphosyntax, increases in use and input were significantly associated with higher scores (odds ratios 1.12 and 1.02, p < 0.001 and 0.009, respectively). For English semantics, higher use and scores were positively related (odds ratios 1.07, p < 0.001).
3.3 Extracting features from language samples
The features explored in this study are inspired by previous work on NLP and language development but we also make use of features drawn from recent work in communication disorders. Even though detecting language impairment is not the end task we will use to measure performance, we expect features from communication disorders to be useful for identifying language dominance. Phenotypes of language impairment include deficits in language acquisition that are measured with respect to developmental milestones. A child with language impairment might exhibit language patterns that match those of younger children (delayed language patterns), but the child can also produce totally different language patterns (deviant language patterns). It is expected then that there is an overlap among language measures used for monitoring language development in children and those used as diagnostic markers for language impairment.
3.3.1 Perplexities from N-gram language models
N-gram LMs have been successfully used in many NLP applications, including speech and hand-writing recognition, augmentative communication for the disabled, and spelling error detection (Manning and Schütze Reference Manning and Schütze1999; Brill and Moore Reference Brill and Moore2000; Jurafsky and Martin Reference Jurafsky and Martin2000). These statistical models have also been used in previous work on clinical domains (Roark et al. Reference Roark, Mitchell and Kaye2007b). In this work, we explored using perplexities from LMs trained on different data sets described previously. More specifically, the perplexity (PP) of a sequence of words W = {w 1, w 2, . . ., w n} with an N-gram LM is computed as

where P(w 1, w 2, . . ., w n) is the probability of W as approximated by the LM. More specifically, for an N-gram LM

Our goal is to train syntactic (class based) rather than lexical LMs, therefore the LMs used in our study are trained on POS tags rather than on words. There are two main reasons why we chose to use POS tags to train the LMs. First, it reduces the emphasis on vocabulary knowledge (what was said) and places more attention on the grammar of what was said. Second, using POS tags greatly reduces the number of parameters needed for training the LMs. This is especially beneficial for us since we have limited data that has been manually labeled for language dominance.
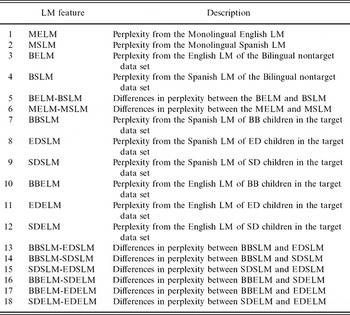
Table A1 in Appendix A shows the list of all the features we generated from LMs. For all LMs we used a Leave One Out Cross-Validation (LOOCV) procedure when needed so that when we are calculating PP values for a given transcript, that transcript has not been used to train the LMs. This is the case for features 7–18. Features 1–6 are computed for each transcript (retell) in the target data set. Features 7–9 and 13–15 are only computed for the retells where Spanish is the target language while Features 10–12 and 16–18 are computed for the English counterpart. The LMs were trained using unigrams, bigrams, and trigrams. This gives a total of 36 N-gram LM features per retell, ((6 + 6) × 3). For training and testing these LMs we used the SRI Language Modeling Toolkit (Stolcke Reference Stolcke2002).
3.3.2 Speech fluency
In children, repetitions, revisions, interjections, and filled pauses have been considered as indicators of either development or language learning difficulties (Thordardottir and Weismer Reference Thordardottir and Weismer2002; Bedore et al. Reference Bedore, Fiestas, Peña and Nagy2006; Wetherell, Botting and Conti-Ramsden Reference Wetherell, Botting and Conti-Ramsden2007; Guo, Tomblin and Samelson Reference Guo, Tomblin and Samelson2008). These different types of content-free repairs are called mazes or vocal hesitations in the clinical literature (Kowal, O'Connell and Sabin Reference Kowal, O'Connell and Sabin1975; Loban 1976; Dollaghan and Campbell Reference Dollaghan and Campbell1992). Recent studies on maze use in bilingual children have found that there is no significant difference in rate use of mazes between bilingual children and monolingual typically developing children (Bedore et al. Reference Bedore, Fiestas, Peña and Nagy2006). However since previous work has found that speech disruption rates are related to lexical and syntactic abilities, we regard them as promising features for measuring language ability in bilingual children.
The features for speech fluency include:
• The number of fillers, such as uh, um, er
• The number of partial words found in each transcript as identified by the process described in Section 3.1 (e.g., the f frog run away)
• The number of words in repetitions (e.g., and then the frog and then the frog run away)
Different studies analyzing maze rates in children have used different criteria for normalization of these counts — while some have used the TNW as the normalization constant (e.g., Dollaghan and Campbell Reference Dollaghan and Campbell1992; Guo et al. Reference Guo, Tomblin and Samelson2008), others have opted for using communication units (e.g., MacLachlan and Chapman 1998). To investigate if normalization has any effect on the discriminative value of these features, we include in this study both types of normalization.
3.3.3 Language productivity
Measures of language productivity include MLU in words, total number of utterances (TNU) produced, TNW, NDW and interviewer support. Interviewer support counts the number of turns from the interviewer excluding back channels (uh-huh, yeah) or communicators. This feature captures how many times the child required encouragement from the interviewer to continue the narrative.
It is a standard practice to ignore mazes when computing these measures. Ignoring words that are part of repetitions or revisions allows to focus on the words that are truly adding new information or content to the utterance. We explored the impact of allowing mazes to count towards two of these measures, MLU and TNW, versus the standard practice of ignoring them. We experimented using four versions for these metrics: no mazes, no partial words, no repetitions, and including everything. The resulting number of features in this group is 11.
3.3.4 Demographic information
Several sociodemographic variables, such as parental education and family income, have been linked to children's developmental performance and have been found to be more influential than race or ethnicity (Dollaghan et al. Reference Dollaghan, Campbell, Paradise, Feldman, Janosky, Pitcairn and Kurs-Lasky1999). Thus, in this study we explore the sensitivity to proficiency level of the following variables:
• Maternal educational level
• Paternal educational level
• Free lunch enrollment status
• Sex
To estimate socioeconomic status of children in the target population we use the enrollment status of these children in free lunch programs at their schools. Schools that participate in the National School Lunch program offer free or reduced price lunches to eligible children. These schools receive cash subsidies from the U.S. Department of Agriculture for each meal they serve. Children are eligible for free lunch if their family's income is at or below 130 percent of the poverty level.Footnote 3 Note also, that we have sex information as a feature as well. There is still moderate support for the belief that males have higher incidence rate of language impairment than females. The actual male to female ratios reported vary from 2:1 to 1.33:1 (Tomblin Reference Tomblin1997). It is reasonable then to hypothesize that information about gender could be helpful for our task.
3.3.5 Morphosyntactic features
The evidence of language developmental patterns in young monolingual English-speaking children shows that normally developing children exhibit a stage where nonfinite forms of verbs, as well as person and number agreement markers, such as -ed, -s, be and do are used in contexts where finite forms are required (Wexler Reference Wexler, Lightfoot and Hornstein1994; Brown Reference Brown1973). Children suffering from a language impairment often have an “extended” stage of inconsistent use of nonfinite forms (Rice and Wexler Reference Rice, Wexler and Rice1996). The features in this group are designed to reflect behavior of children in contexts where this inconsistent pattern can become apparent.
Features in this group include:
• Ratio of nonfinite verb forms to the total number of verbs (NFV/TNV)
• Counts of morphosyntactic patterns relevant for English
• Counts of morphosyntactic patterns relevant for Spanish
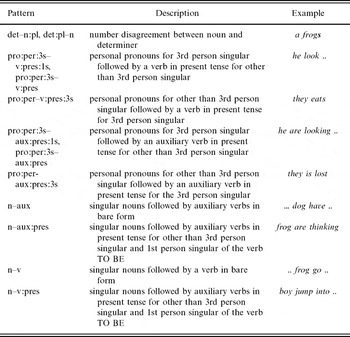
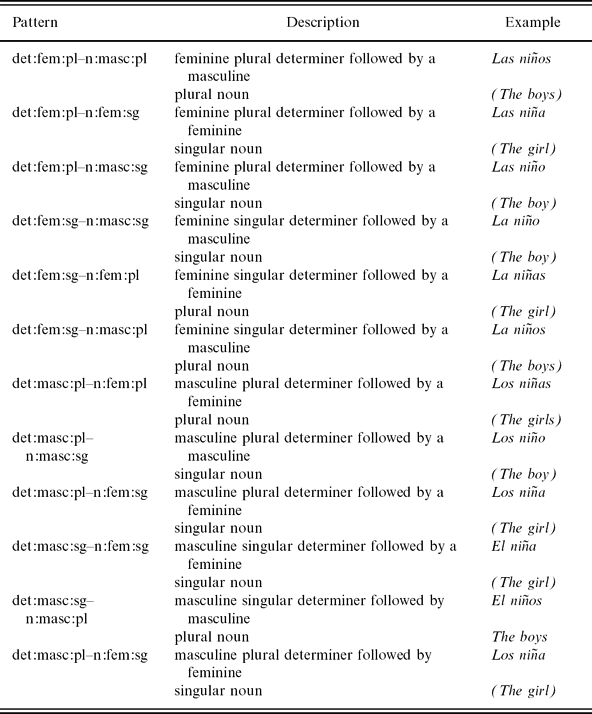
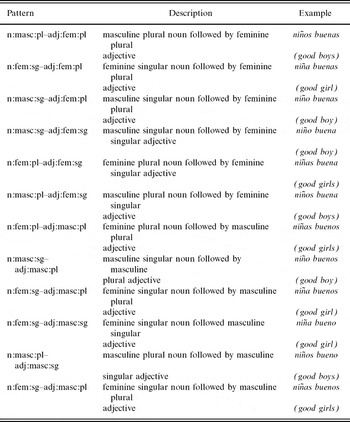
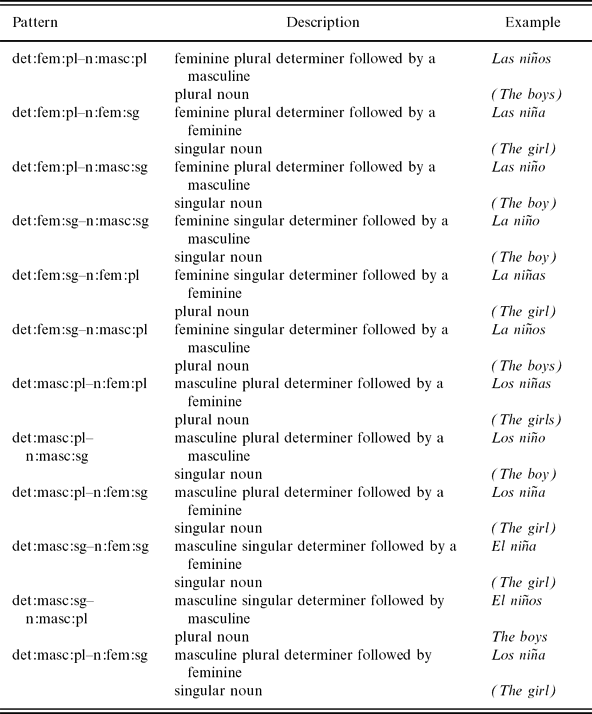
We include as features the counts of POS tag n-grams that correspond to these error patterns as identified by the POS taggers. For a list of the bigrams we used for English see Table A2 in the Appendix. Note that most of these bigrams reflect subject verb errors, except for the first one that accounts for number disagreement between determiners and nouns. Tables A3 and A4 in the Appendix show the patterns for Spanish. The first table shows morphosyntactic patterns involving number and gender agreements between determiners and nouns while the second table shows the patterns involving agreement between nouns and adjectives.
3.3.6 Features of syntactic complexity
In clinical research, measuring children's grammatical development has been typically limited to using MLU, assuming complexity increases with the length of the utterance. While this measure is easy to compute, and there are tools for computing it automatically, MLU has been claimed to lack informative value for children beyond 3 years of age (Klee and Fitzgerald Reference Klee and Fitzgerald1985). An alternative to measure syntactic complexity is the Index of Productive Syntax (IPSyn) (Scarborough Reference Scarborough1990). This more elaborated metric comes at a higher price. It requires the syntactic parsing of utterances in order to identify the grammatical relations. There is recent work on developing an automated tool for computing IPSyn, and in general for providing syntactic annotations to children's transcripts (Sagae et al. Reference Sagae, Lavie and MacWhinney2005; Sagae et al. Reference Sagae, Davis, Lavie, MacWhinney and Wintner2007). However current approaches have some limitations. For instance in (Sagae et al. Reference Sagae, Lavie and MacWhinney2005) the underlying statistical parser was trained on adult speech, in particular on the PennTreebank and it required a postprocessing step to make the output format compatible with the standards required for computing the IPSyn measure. Later on, Sagae et al. trained a parser on child language using 15 files from the CHILDES Eve corpus that showed promising results (Sagae et al. Reference Sagae, Davis, Lavie, MacWhinney and Wintner2007). We decided against exploring this IPSyn measure in our study since it is currently only available for English. In addition, adapting the tool developed by Sagae et al. would require a parser for Spanish trained on child language.
In this group we include measures inspired by recent work on readability assessment (Petersen and Ostendorf Reference Petersen and Ostendorf2008; Feng et al. Reference Feng, Elhadad and Huenerfauth2009), as well as work on text simplification.
• Out of vocabulary (OOV) features. These features are similar to those proposed by Petersen and Ostendorf (Reference Petersen and Ostendorf2008). In our work, the vocabulary was created from the nontarget bilingual data set. To generate the vocabulary lists for each language, we consider the n most frequent words in the nontarget bilingual data set that account for different levels of coverage of all transcripts in the corresponding language. We also computed OOV scores for POS tags, again using the nontarget bilingual data set as the vocabulary. Following Petersen and Ostendorf (Reference Petersen and Ostendorf2008), we computed two versions of each of these scores: one based on tokens (all word/POS instances) and the other one on types (all unique words/POS). The OOV features are the following:
— Percentage of words (types and tokens) in transcript not in 55% coverage
— Percentage of words (types and tokens) not in 65% coverage
— Percentage of words (types and tokens) not in 75% coverage
— Percentage of POS tags (types and tokens) not in 55% coverage
— Percentage of POS tags (types and tokens) not in 65% coverage
— Percentage of POS tags (types and tokens) not in 75% coverage
• Average number of syllables per word. To compute this feature we used the Perl module HyphenFootnote 4 for English and we wrote our own syllabifier for Spanish. The syllabifier for Spanish is based on regular expressions.Footnote 5
• Flesch–Kincaid scores. We used the two widely known readability measures, the Flesch Reading Ease and the Flesch-Kincaid Grade Level (Flesch Reference Flesch1948; Kincaid et al. Reference Kincaid, Fishburne, Rogers and Chisson1975). Both metrics were calculated ignoring fillers, disfluencies, and communicators.
• Automated Readability Index (ARI). This index is also a function of average word length and average sentence length. The difference between the Flesch–Kincaid scores and this one is that in the ARI index word length is measured in characters. We included this feature since it can be easily calculated using the GNU style tool.
• Coleman-Liau Index (ARI). This readability index is similar to the ARI. Word length is measured in characters and its output is also related to US Grade levels.
• Gunning Fog Index. This index was developed by Gunning (Reference Gunning1952) and it is a function of sentence length and the number of syllables per word. In contrast to the Flesch–Kincaid score, this one counts only polysyllabic words, defined as words with three or more syllables.
• SMOG score. The Simple Measure of Gobbledygook was developed by McLaughlin as an alternative to the Gunning Fog index (McLaughlin Reference McLaughlin1969). Similar to the Gunning Fog score, the SMOG score also counts polysyllabic words but has the advantage of using a simpler formula for computing the readability metric.
• Number of different POS tags, raw counts and normalized counts.
It should be noted that some of the metrics we are using here were developed for English, not for Spanish, and they might turn out not to reflect relevant features of Spanish. However, since they are based on metrics of word length, based on either syllables or characters, they are easy to calculate and thus we decided to explore their usefulness. We will return to this point on the feature analysis experiments.
3.3.7 Speaking rate
This group includes several versions of speaking rate calculated per minute. To calculate this measure we used the time stamps in the transcripts. For the transcripts where no timing information is available this feature is left as missing.
• Average number of syllables per minute
• Average number of words per minute
• Average number of words per minute without counting partial words
• Average number of words per minute without fillers or partial words
• Average number of words per minute without fillers, partial words, or repetitions
• Average number of words per minute without mazes
3.3.8 POS n-grams
We use a bag of words approach for the POS tags of the transcripts. The features are counts of unigrams, bigrams, and trigrams of POS tags, as well as normalized versions of them.
3.3.9 Standard scores
A standard score, known as a z-score, is the difference between an observation and the mean relative to the standard deviation. We computed standard scores for each of the features in the language productivity group (Section 3.3.3) and speaking rate (Section 3.3.7). For this feature group, we first find separate distributions for each feature for each of the three bilingual populations. Then, for each transcript, we compute the standard scores based on each of these distributions. This represents how well the child is performing relative to each population: ED, SD, and BB.
4 Experimental results and analysis
Our bilingual target data set is small. It has a relatively small number of bilingual children compared to the typical corpus size for language processing tasks. However, we have two story narratives per language for each child. Hence, to increase the number of data points available for training and testing we decided to consider the two narratives in the same language as different instances. We use a vector representation with features extracted from each language. By separating the narratives, we now have two feature vectors per child, one for each language pair of transcripts, yielding a total of 106 instances. This scenario is more realistic for evaluating our approach than relying on having two narratives per child since most speech clinicians and researchers collect only one narrative per language.
We separated the corpus into a development set and a test set. For the development set we selected 12 BB, 6 ED, and 14 SD transcripts. We used the development set to perform different attribute selection tests. The test set has the remaining instances, 28 BB, 14 ED, and 32 SD transcripts. LOOCV was used to produce the training and testing portions within this test set. In each iteration of a cross-validation, one child is chosen for testing. Hence, both of his/her transcripts are removed from the training set and used for testing while the rest of the transcripts are used for training. The purpose of this per child cross-validation is to prevent the learners from identifying children, as opposed to the intended task: identifying language dominance status.
For measuring classification performance we used accuracy as the comparison metric. Accuracy is defined as the percentage of instances correctly labeled by the learner out of the total instances in the test set. In our results we present the average accuracy of the cross-validation procedure. The learning algorithm used was Logistic Regression with Decision Stumps implemented in the WEKA environment (Witten and Frank Reference Witten and Frank1999). We report results using this classifier since it was the best performing one in our preliminary experiments on the development set.
4.1 Baseline comparison
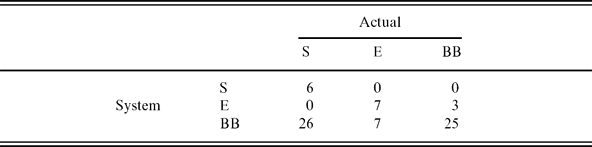
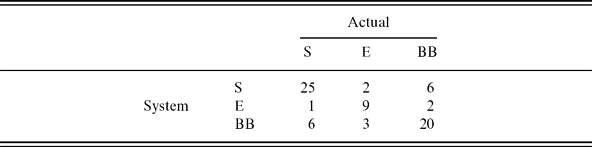
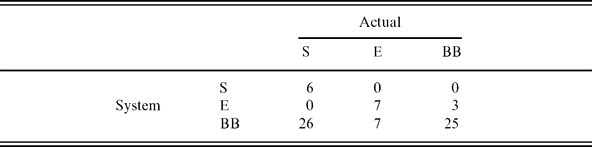
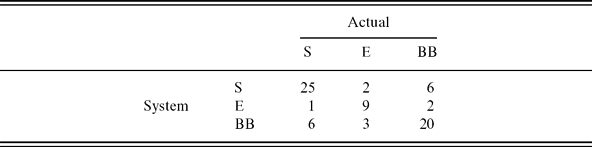
Without the possibility of comparing prediction accuracy against other approaches it is difficult to judge the contribution of our method. Therefore, we present results of a very intuitive baseline that uses the percentage of words output in the nontarget language to make language dominance predictions. This baseline predicts a child as BB if the percentage of words in the nontarget language is smaller than 5% in both language tasks. Children having less than 95% of words in the target language will be categorized by the baseline as dominant in the nontarget language. We moved the baseline threshold to 2% and then to 10%, but found that while the individual predictions were different, the resulting accuracy remained almost unchanged. Table 4 shows the results of the baseline and our approach using all features. This baseline system yielded a somewhat counterintuitive result, since one would expect children that are dominant in one language to be more prone to code-switch thus producing narratives that include more words in the nontarget language. However, what these results show is that children do tend to make a great effort of producing the narratives in the target language. This is more apparent when we look at the confusion matrices for both approaches shown in Tables 5 and 6. The baseline system has a stronger preference for labeling children as balanced bilingual.
Baseline comparison of accuracy for language dominance prediction

Confusion matrix for the baseline method on the test set
Confusion matrix for the test set using our approach
4.2 Feature selection
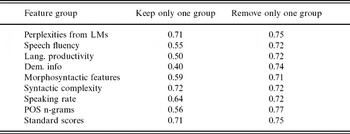
We have a large number of features derived from the narratives since each instance contains a pair of transcripts in two languages. Therefore, we performed two sets of experiments to explore which feature groups are more useful. In the first set we kept only one group of features at a time while in the second one we removed only one group. Table 7 shows the results. The highest accuracy when keeping only one group was 72%. It was achieved by using only the syntactic complexity group. This is the same accuracy we reached by using all features. For the case of removing only one group, the best result, 77% accuracy, is achieved when removing the feature from the POS n-grams group. This is the best feature setting for language dominance detection. There are two possible reasons accounting for this gain in accuracy when dropping the POS n-gram counts: (1) the POS tags are noisy due to having a tagger that has not been optimized for bilingual child language, (2) the high dimensionality of this feature group. The number of features is particularly large for Spanish since it has a larger POS vocabulary than English. A larger training set might help in this respect.
Prediction accuracy for language dominance with different feature groups

By looking at Table 7 we can see that if used by themselves, the best feature groups are the perplexities from the LMs, the syntactic complexity metrics, and standard scores. Results from the PP measures are consistent with previous work (cf. Gabani et al. Reference Gabani, Sherman, Solorio, Liu, Bedore and Peña2009). The results from the complexity metrics, on the other hand, were unexpected. As described in Section 3.3.6, some of the features in this group were developed for English and were adapted to Spanish by changing the syllabifier. This shows that readability metrics have good discriminative value for predicting language dominance even though these metrics have not been validated for Spanish. The successful adaptation of the readability metrics can be due to the fact that these metrics are a function of word length, either measured in characters or in syllables, and therefore, as long as the length estimates are correct, the coefficients of these formulae will be able to provide a good raw estimate on readability.
With respect to the features inspired by the literature in the clinical domain, standard scores were ranked second best, together with perplexities from LMs. It should be noted that while standard scores are commonly used when developing language profiles, these are typically computed for MLU, TNW, and TNU, while in this work we compute standard scores for a larger number of features (see Section 3.3.9 for a list of these features).
Using a cross-validation procedure on the development set we performed two types of feature selection within each group. In the first scenario we used genetic algorithms to search the space of attribute subsets. The evaluation criteria is the correlation of features with the class while preferring attributes that have low intercorrelation. The second approach to feature selection chooses as features those that showed significant differences between the means on the three populations, as calculated by a t-test. Overall, feature selection did not help in boosting classification accuracy, as measured by a cross-validation procedure on the separate test set. For some feature groups, such as speech fluency, language productivity, morphosyntactic features, and POS n-grams, no significant changes in accuracy were observed. While for some others, including complexity measures and demographic information, accuracy drops considerably. The reason why both approaches to feature selection seem to be of little help can be an artifact of using a very small data set for performing the feature selection.
An analysis of the feature selection experiments showed that from the “syntactic complexity group” useful features are OOV scores for words and POS tags for both English and Spanish, and the OOV scores for the nontarget language for words and POS tags for both languages as well. Several readability scores were also selected as relevant features. These include the Gunning FOG and the SMOG scores for Spanish. Most of the readability indexes rely on word length metrics measured either in characters or in syllables. It seems that having a language-dependent syllabifier then allows to exploit these metrics for a language other than English, at least for the purpose of measuring language dominance prediction. This finding highlights the relevance of using NLP features in this domain of language dominance prediction and suggests the need for developing easy-to-use tools for speech clinicians and researchers that allow them to exploit these features in their analyses.
For the “speech fluency features” both attribute selection algorithms chose as relevant features the number of repetitions in the transcript.
The “language productivity group” includes four versions of MLU and TNW: one where all tokens uttered by the child are included, another version that ignores mazes, one that ignores only partial words, and one that ignores only repetitions. The t-test results showed that all four versions of these metrics had significant differences when looking at Spanish transcripts. However it seems that only two versions of these metrics are not redundant: MLU counting all tokens and MLU without mazes. This conclusion comes from the results of feature selection with genetic algorithms. Only these two versions were selected as having stronger correlation with the class and low intercorrelation among them. The most interesting finding about this group of features is that both features selected by the genetic algorithm strategy and all but one of the features selected by the t-test are for Spanish, suggesting that this type of features is more informative for Spanish than for English. The only feature selected from the t-test results for English was the NDW normalized.
For the “demographic group,” the t-test results showed no significant difference between the means of the populations for any of the features in this group. In contrast, the genetic algorithm found that mother's educational level was a relevant feature in this group. This is consistent with previous studies of English speaking monolingual children that have shown maternal education to be a good predictive variable for language development in children (Dollaghan et al. Reference Dollaghan, Campbell, Paradise, Feldman, Janosky, Pitcairn and Kurs-Lasky1999).
4.3 Prediction consistency
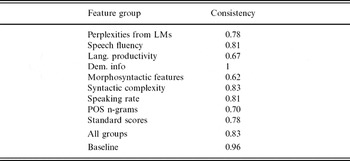
Having two instances per child allows us to measure consistency on the predictions of the algorithm, something that is not always possible to measure. If a child is being monitored for language development it is likely that different narratives would be elicited and analyzed. For the task at hand it is therefore more critical to have a consistent evaluator. We measure consistency as the number of times the two instances of the same child are assigned to the same class by the learner. Table 8 shows consistency results. Most of the feature groups yield acceptable levels of consistency. Note that having a consistency of 1 for the demographic feature group was expected since these features will have exactly the same values for the two instances of the same child. The highest consistency, excluding the demographic group, of 96% was reached by the baseline system. It is likely the baseline system is measuring a stable speaker behavior across the narratives of the same child: that of choosing to produce words in the target language. Using all feature groups reaches a consistency of 83%, which is the second best, again excluding the demographic group. An interesting finding is that the lowest consistency score is coming from morphosyntactic features. The fact that other feature groups, though also dependent on POS tagging accuracy, such as POS n-grams and perplexities from LMs, have higher consistency results might indicate that this feature group has an additional source of noise. This feature group uses the counts of specific POS n-grams targeted to account for morphological error patterns. Children in the language acquisition stage are inconsistent in their use of morphology and this inconsistency might confound the learner.
Comparison of consistency on language dominance predictions

4.4 A binary classification setting for language dominance
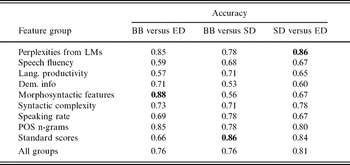
We performed another round of experiments where we transformed the three class problem into three binary classification problems. For each of these experiments one class was removed at a time and the learning algorithm was trained to discriminate between the remaining two classes. No feature selection was performed in these binary classifications since it was not helpful in the three-way setting. The goal of this experiment is to explore which of these three scenarios poses greater difficulties for the machine learning algorithm. Intuitively, we would expect to see the problem of distinguishing between SD and ED an easier task than either of the remaining two scenarios. Table 9 shows the results for binary classification using Logistic Regression with Decision Stumps. %There was a small boost in accuracy, but only in the case where all features are used in the SD versus ED scenario.
Prediction accuracy for language dominance in a binary classification scenario

Overall, accuracy increases in these binary problems. This is no surprise since from the point of view of the classifier, a binary problem is “easier” than a three-class problem. But there are some interesting patterns when we look at the accuracy of individual groups. For instance, there are significant differences in performance for language productivity (57% against 71% and 65%) and standard scores (66% against 86% and 84%) when the problem involves discriminating between ED and BB as compared with the other two scenarios, suggesting these two populations have a larger overlap in performance on these metrics. Perplexities from LMs and the POS n-grams, on the other hand, seem to have a higher discriminative power with this ED versus BB setting, and the SD versus ED, than in the BB versus SD one (see rows 1 and 8 from Table 9). This can be due to the fact of having less noisy features for English since we have a more accurate POS tagger for English than for Spanish. There are also significant differences, although to a lesser extent, in the performance of demographic features. Accuracy in the BB versus ED setting is 71%, while for BB versus SD and SD versus ED accuracies are 53% and 60%, respectively. These features seem to be better at discriminating between ED and BB than the other two scenarios. Another unexpected result is that morphosyntactic features are better for separating the BB from ED children than any of the other cases. Here again it is possible that the confounding factor for Spanish might be the noise in the POS tags. It is also possible that for children learning a language that is morphologically richer than English allows them to master English morphology faster and therefore the error patterns we are trying to capture for English loose discriminative value. All these different trends in performance for the language groups suggest that the structure of the language, as well as the level of dominance have an important effect on performance for different metrics. More studies need to be carried out in order to better understand these effects.
5 Discussion
The empirical results presented in the previous sections support our motivation for proposing a learning approach for predicting language dominance from transcripts. A baseline system that counts the total number of words output in each language cannot account for the different language dominance levels of children as it seems that children make a strong effort to produce the narrative using the target language. It is possible however, that this same baseline could yield higher prediction accuracy if the narratives were elicited without specifically asking children to use one language. Children may place less emphasis on the target language and more on narrating the events in the story, and thus, more code-switching will be observed. The current transcripts cannot be used to test this hypothesis so this remains an open question until we can replicate these experiments with narratives elicited without specifying a target language.
The feature group of perplexities from LMs was one of the feature groups that showed high accuracies. Other studies have used POS tags to train LMs for similar tasks (Roark et al. Reference Roark, Mitchell and Hollingshead2007a; Gabani et al. Reference Gabani, Sherman, Solorio, Liu, Bedore and Peña2009). Gabani (Reference Gabani2009) extracted these features from narratives for the prediction of language impairment in monolingual children. He found that using POS tags to train LMs, as opposed to words, yielded the best results overall. Together with previous findings, our results show that LMs trained on POS sequences are a powerful source of information that should be explored further for these applications. This seems to be the case even if the POS tags themselves are somehow noisy, as in our experiments, perhaps because LMs focus on the patterns of POS tags and not on the individual tags.
One aspect that remained unsolved was with respect to the 6 children in the target data set that were identified as having a potential language impaired. It was not clear that having these children in the data set would add a confounding factor to the learner. Our analysis of results did not show a clear trend with respect to children with language impairment. Their probability of being classified correctly according to their language dominance was not significantly different from the nonimpaired children. For most algorithms tested and most feature groups the error rates in each group were similar. This is consistent with recent studies of bilingual children with language impairment supporting the belief that their language impairment does not imply a risk for delayed linguistic development (Goldstein and Kohnert Reference Goldstein and Kohnert2005).
From the experiments on the binary classification setting we can draw some interesting conclusions. First, several feature groups show different accuracies across the three scenarios, including PP features, morphosyntactic features, standard scores, and POS n-grams. This suggests that there is a correlation between the dominant language and speech patterns on these specific language characteristics. The groups of features that were able to reach consistently high prediction accuracies across the three bilingual settings are POS n-grams and syntactic complexity.
We should remark that this study focused on a particular narrative task: a story narrative from a wordless picture book. As it so happens with most corpus-based approaches to language processing, it is anticipated that different accuracy performance could be achieved if we apply this approach to a different elicitation task. In fact, Gabani et al. (Reference Gabani, Sherman, Solorio, Liu, Bedore and Peña2009) reported lower prediction accuracies for language impairment identification when using a spontaneous narrative that was elicited by prompting subjects to describe the most annoying person they knew (cf. Wetherell et al. Reference Wetherell, Botting and Conti-Ramsden2007) than when the sample analyzed was a story retell. Since we are using very similar sets of features, it is likely that we will have these differences as well.
6 Conclusion
In this work we set to the task of finding answers to the following questions: (1) Do automatically extracted features provide any discriminative value for predicting language dominance in a machine learning scenario?, (2) How do these features compare to the traditional measures used by speech clinicians and clinical researchers?, and lastly, (3) Can we develop an accurate learning approach using features that do not depend on syntactic parsing?
Regarding the first question, we explored a wide range of feature groups with different experimental settings. Our empirical evaluation showed that combining all but one of the feature groups, POS n-grams, reached the highest prediction accuracy, 77%, a considerably large improvement over the simple baseline that reached an accuracy of 47%. When using individual feature groups, the highest prediction accuracy, 72%, was reached by features derived from PP values of LMs and complexity measures that are currently being explored for automatic reading level assessment. These results motivate future in-depth analyses of the correlation of these features with current methods for measuring language dominance. The question regarding whether our results lie within agreement margins of human judgements remains open.
To answer question 2 we performed experiments with different groups of features. The results showed that some of the NLP inspired features were more useful for this prediction problem than typical metrics used in communication disorders. However, we did find that features such as standard scores ranked third place in accuracy (see Table 7). It should be noted that in this group we included metrics not commonly used by clinicians, such as average syllables per word that were signaled by both feature selection methods as relevant metrics. For future experiments with standard scores we would like to explore if comparing these children against the population means of the additional language samples we have, from other bilingual and monolingual children, could be helpful for this task.
Our results showed that we can reach acceptable accuracies for the problem of language dominance prediction in Spanish–English bilingual children by using an inexpensive feature engineering approach.Footnote 6 Our feature set does not require parsing the transcripts, therefore we can conclude an affirmative answer to question 3. However, we have yet to perform additional experiments with parsed transcripts in order to evaluate how much information we are loosing by not parsing the data. These experiments will need to be postponed until gold standard parsed data for our bilingual children becomes available.
It is widely acknowledged that bilingual children are not two monolinguals in one (Grosjean Reference Grosjean1989), and in our experimental setting we are considering them as such. Our future work then will explore how these features can be adapted to provide a “compound” approach. Previous work on bilingual assessment has used a combination of measures for semantic development, as well as sentence complexity, to exploit a unified bilingual profile. We would like to explore how the NLP features can be combined in a similar way and if the combination provides a more accurate language profile of bilingual children.
Another important next step of this work is to study the effect of code-switching for the POS taggers. Dealing with code-switched data introduces a lot of noise for the syntactic analyzers. It has been shown before that monolingual POS taggers will degrade accuracy when they process mixed-language data (Solorio and Liu Reference Solorio and Liu2008). We believe these detriments in POS tagging accuracy had minor impact on overall accuracy of the approach. Only features dependent on capturing specific POS patterns could suffer more from lower POS tagging accuracy. In particular, we saw that POS n-grams had the lowest accuracy when used in the three-way classification setting, and lower results when looking at Spanish, than English, in the binary settings. But we need additional experiments to evaluate the effect of a more accurate POS tagger. We are currently working on gathering a gold standard POS annotated data for bilingual child language that we will use to boost the POS tagging accuracy of our taggers.
The field of computational linguistics has reached a maturity stage where its technology is being exploited in many different disciplines. Our work is one example of how techniques developed within this field can be successfully adapted to the field of communication disorders and contribute to a more accurate assessment of language dominance in bilingual children. Similar successful results, such as (Sagae et al. Reference Sagae, Davis, Lavie, MacWhinney and Wintner2007; Feng et al. Reference Feng, Elhadad and Huenerfauth2009; Roark et al. Reference Roark, Bachrach, Cardenas and Pallier2009) suggest that there is great potential in exploring these cross-disciplinary avenues. However, we are still far from being able to deploy these proposals for their adaptation in the clinical setting. To make this last step possible we need to have access to a much larger pool of transcripts so we can perform tests for statistical significance. Moreover, there is also the concern on how these methods will perform across dialects. That is, what will happen when analyzing samples from Spanish–English bilingual children of Cuban or Puerto Rican descent? Further studies are needed to answer these questions and provide stronger evidence in favor of these approaches. We can start with less ambitious steps, though, for instance, by first making some of the syntactic analyzers available to clinical researchers and speech clinicians. Having these analyzers implemented inside environments well known by practitioners in communication disorders is a very good step forward and there are already great efforts invested towards this end (cf. Sagae et al. Reference Sagae, Davis, Lavie, MacWhinney and Wintner2010). This will promote more interaction between NLP researchers and clinical researchers and practitioners that is critically needed to advance research in both fields.
Acknowledgements
This work was partially supported by the National Science Foundation under grants IIS 1008743 and 0812134, and by NIH NIDCD R01 grant DC007439. This research was also supported in part by grants HD39521 and R305U010001, both of which are jointly funded by the NICHD, NIH, and the US Department of Education's Institute of Education Sciences. The authors would like to thank the anonymous reviewers for their constructive feedback.
Features used
Perplexity features from N-gram language models

Morphosyntactic features for English. Dashes separate the POS tag unigrams while colons separate morphological features

Morphosyntactic features for determiners and nouns in Spanish. Dashes separate the POS tag unigrams while colons separate morphological features
Morphosyntactic features for nouns and adjectives in Spanish. Dashes separate the POS tag unigrams while colons separate morphological features