INTRODUCTION
For over two decades, considerable attention has been given to finding cost-effective methods for benthic studies owing to their inherent difficulties in sampling and laboratory processing efforts. Taxonomic sufficiency (TS) (Ellis, Reference Ellis1985), which is the identification of taxa to taxonomic levels higher than species, without considerable loss of information about community response, was found to be a convenient approach to reduce identification efforts. TS was initially used to identify effects of pollution on benthic communities (Heip et al., Reference Heip, Warwick, Carr, Herman, Huys, Smol and Van Holsbeke1988; Warwick, Reference Warwick1988a, Reference Warwickb; Ferraro & Cole, Reference Ferraro and Cole1990; Gray et al., Reference Gray, Clarke, Warwick and Hobbs1990; Warwick et al., Reference Warwick, Platt, Clarke, Agard and Gobin1990; Somerfield & Clarke, Reference Somerfield and Clarke1995; Wright et al., Reference Wright, Chessman, Fairweather and Benson1995; Mistri & Rossi, Reference Mistri and Rossi2001; Gesteira et al., Reference Gesteira, Dauvin and Fraga2003) and later was also found suitable to explain spatial patterns of benthic communities along natural environmental gradients (James et al, Reference James, Lincoln Smith and Fairweather1995; Chapman, Reference Chapman1998; De Biasi et al., Reference De Biasi, Bianchi and Morri2003; Lasiak, Reference Lasiak2003; Dethier & Schoch, Reference Dethier and Schoch2006; Sajan et al., Reference Sajan, Joydas and Damodaran2010). These studies analysed the costs and benefits when data from higher taxonomic levels are used. As identification moves progressively to species level, costs, in terms of the expertise and time needed also increase (Heip et al., Reference Heip, Warwick, Carr, Herman, Huys, Smol and Van Holsbeke1988). It is easier to train personnel to sort higher taxonomic levels than species, and the risk of potential taxonomic classification error is lower at a higher level of identification (Dauvin et al., Reference Dauvin, Gesteira and Fraga2003). However, to accept TS as a routine approach in benthic studies, it needs to be proved valid for various taxa and in geographically different water masses. The present study investigates the validity of TS for macrobenthic polychaetes by analysing an extensive data set based on samples collected from a wide geographical area covering a large depth gradient. For this study, samples were collected from every degree square of the western Indian continental shelf (7°–22°N latitudes) with representative samples from 30, 50, 100 and 200 m depths. Polychaetes were the dominant macrobenthic group, contributing 57% of the population, with 165 species belonging to 32 families, showing shifts in community structure in relation to depth (Joydas & Damodaran, Reference Joydas and Damodaran2009; Joydas et al., Reference Joydas, Jayalakshmi and Damodaran2009).
Within marine benthic samples, there is usually a great range of abundances (Olsgard et al., Reference Olsgard, Somerfield and Carr1997). Some taxa are dominant, while others are occasional or rare. In multivariate analyses, data transformation plays a role in defining the balance between contributions from common and rare species in the measure of similarity of two samples (Clarke & Warwick, Reference Clarke and Warwick2001). In this study, we use various transformed forms of polychaete data of three taxonomic levels and test which analyses can document the species-level depth-related pattern in the western Indian continental shelf.
Our previous study on the environmental correlates of polychaete distributions revealed that depth-related patterns are a function of variation in bottom water dissolved oxygen (DO) and temperature (Joydas & Damodaran, Reference Joydas and Damodaran2009). Sharp decreases in DO and temperature with increase in depth were evident and the DO values observed in the 200 m depth zone (0.0005–0.24 ml l−1) indicated that this area is lying within the oxygen minimum zone (OMZ: <0.5 ml l−1; Levin, Reference Levin2003).
The overall objectives of the study are: (i) to identify whether depth- and oxygen-related patterns of polychaetes at species level are conserved at reduced taxonomic levels in a natural environment; and (ii) to examine the effect of various data transformations on the community patterns of polychaetes.
MATERIALS AND METHODS
Sampling and laboratory analysis
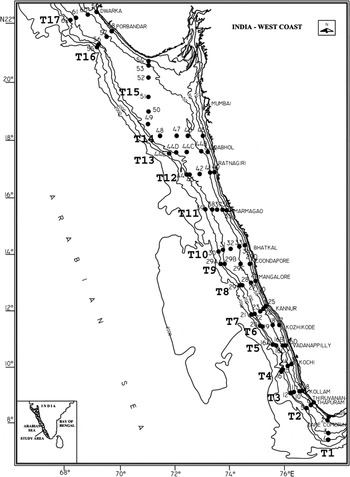
Macrobenthic samples for the present study were collected on-board the Indian Fishery and Oceanographic Research Vessel (FORV) ‘Sagar Sampada’. Data from two cruises (Cruise No. 162 conducted during February–March 2008 and Cruise No. 192A during February 2001) were used for this study. Seventy-five stations representing various depths, distributed along 17 transects (T) that were usually perpendicular to shore, were sampled; they extended from 07°10′22″ to 22°14′31″N and 67°57′41″ to 77°21′58″E (Figure 1). Sampling was conducted at depths of 30, 50, 100 and 200 m along each transect in order to study the change in fauna with depth.
Location of the sampling stations of the western Indian continental shelf.

Two grab samples were collected using a Kahlsico No. 214 WA 250 modified Smith–McIntyre grab (surface area: 0.1 m2) from each station. The sediment samples were sieved through a 0.5 mm mesh and fixed in 5% neutral formalin mixed with rose Bengal stain. Macrobenthic organisms were initially sorted to higher taxa levels and members of the dominant taxon, polychaetes, were identified to species level (Fauvel, Reference Fauvel and Seymour-Sewell1953; Day, Reference Day1967) followed by counting of individuals. The numerical abundance (as individuals) of polychaetes was expressed in individuals per m2 and was the average of the two grab samples per station.
Data treatment
To study the effects of TS, we performed regression analyses to identify species versus genera and species versus family relationships for richness and species diversity of polychaetes using Microsoft Excel. Prior to this, univariate (Shannon–Wiener diversity, H′ log2) and multivariate analyses were carried out using PRIMER (Plymouth Routines in Multivariate Ecological Research, version 6.1.5: Clarke & Warwick, Reference Clarke and Warwick2001) with the abundance matrices at the three levels of taxonomic resolution for 30, 50, 100 and 200 m depths. Resemblances (Bray–Curtis similarity index (Bray & Curtis, Reference Bray and Curtis1957)) among all the matrices were determined by the Spearman rank correlation coefficient (Clarke & Warwick, Reference Clarke and Warwick2001). To reveal the effect of transformations in the multivariate analyses in explaining the depth variation of polychaete taxa, each of the matrices obtained previously were none, square root, fourth root, log(x + 1) and presence/absence transformed, which resulted in 60 matrices. The rank ordered correlations were treated like a similarity matrix and inputted to a second-stage non–metric multi-dimensional scaling ordination (second-stage MDS: Somerfield & Clarke, Reference Somerfield and Clarke1995). This method is appropriate to examine the degree of resemblance among similarity matrices obtained with different aggregations and depths. One-way analysis of similarity (ANOSIM) of PRIMER was used to test differences found in the communities (with various transformations of data of species, genus and family levels) between selected depth bands.
We also studied the patterns with environmental gradients on the species, genus and family levels of polychaete taxa. The variables selected were depth, DO, temperature and sediment organic matter % (OM). Analysis of variance (ANOVA) indicated that only temperature and DO showed significant depth variations (P < 0.05) on the western continental shelf of India. OM was included as it had shown higher levels in the central region of 30–100 m depths compared to north and south (Joydas & Damodaran, Reference Joydas and Damodaran2009). Stations were categorized as south (s: T1–T6), central (c: T7–T12) and north (n: T13 – T17).
Detrended normal q–q plotting was carried out to obtain the gradient length of all the data. Since the gradient lengths were ≤1.0 SD, a canonical correspondence analysis (CCA: ter Braak & Verdonschot, Reference ter Braak and Verdonschot1995) was performed to identify relationships between polychaetes of species, genus and family level taxa and environmental gradients. For CCA, we used density data for 20 dominant species, 15 dominant genera and 10 dominant families and environmental variables. CCA included a Monte Carlo permutation test (with 999 unrestricted permutations) to determine the significance of taxa–environment relationships. We used the Statistical Package for the Social Sciences (SPSS) version 16.0 for Windows for detrended normal q–q plotting and XLStat software (Version 2009.6.01, Addinsoft) for CCA and ANOVA.
RESULTS
TS in polychaetes of the western continental shelf of India
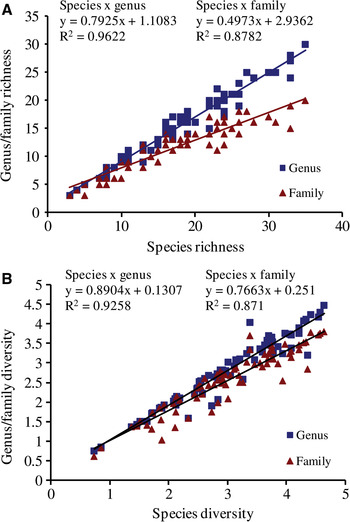
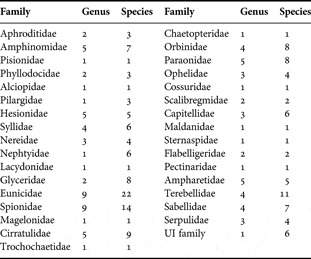
All polychaete families and their numbers of genera and species are presented in Table 1. Eunicidae (22 species), Spionidae (14 species) and Terebellidae (11 species) were the most speciose families. Many families were represented by only one species. Linear regression results showed strong (R2 > 0.87) relationships between the three levels of taxonomic resolution for taxa richness (Figure 2A) and diversity (Figure 2B). Species and genus showed stronger positive correlations than species and family for both richness and diversity.
Species versus genera versus family relationships for (A) richness and (B) diversity for the three levels of taxonomic resolution of polychaetes.

A summary of the families and the species and genus numbers in each family.

Testing depth-related patterns in polychaetes with TS and transformations
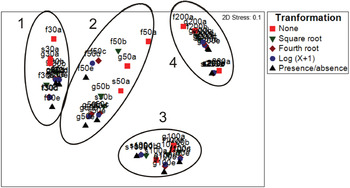
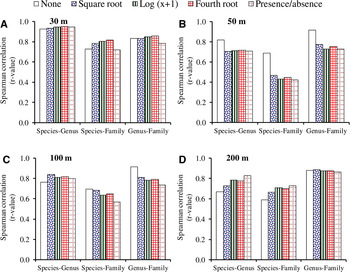
Community similarities for the three levels of taxonomic resolution at the selected depths were compared with a PRIMER second stage resemblance matrix. Each depth zone was distinctly plotted in the second stage MDS plot: within each depth zone, a vertical arrangement for different transformations was visible from none on the top to presence/absence on the bottom (Figure 3). The Spearman rank correlations obtained among the species similarity matrices and higher taxonomic levels of the five transformations were significant for all depths (P < 0.001) (Figure 4). Higher correlations were obtained for species–genus (R value range: 0.67–0.95) and genus–family (0.73–0.92) than species–family (0.42–0.82) similarity matrices. Considerably lower correlations (R < 0.5) were obtained for species–family matrices in the 50 m depth zone. In this depth zone, the highest number of taxa (122 species and 76 genera from 33 families) was observed and ten families had 6–15 species.
Second stage non-metric multidimensional scaling of three taxonomic levels of polychaetes of the four depths with various transformations. Prefixes ‘s’, ‘g’ and ‘f’ are species, genus and family respectively. Suffixes ‘a’, ‘b’, ‘c’, ‘d’ and ‘e’ are none, square root, fourth root, log (X + 1) and presence/absence transformations respectively. 1, 2, 3 and 4 represent clusters of 30 m, 50 m, 100 m and 200 m depth zones respectively.

Spearman rank correlations between data sets of species, genus and family and types of transformations in the four depth zones.

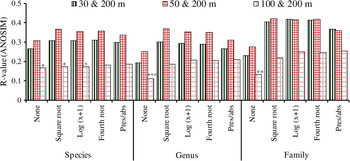
Polychaete community dissimilarity at various depths for each level of taxonomic resolution with various transformations was tested using one-way ANOSIM (Figure 5). Communities in the shallower waters (30 m and 50 m) showed significant differences (P < 0.001) from the deeper water (200 m) for all three taxonomic levels and five transformations. Evaluation of R values indicates that the community differences between shallow and deeper waters and between 100 m and 200 m depths were pronounced at family level. R values also revealed that the community differences between depths in species, genus and family levels were similarly expressed with square root, fourth root and log (x + 1) transformations. Generally, none and presence/absence transformations showed relatively lower R statistics.
Results of the analysis of similarity performed among depth zones using various taxonomic levels and types of transformations. *, P < 0.002; **, P < 0.004; ***, P < 0.007. Remaining community differences are at P < 0.001 significant level.

Links between faunal patterns and environmental variables
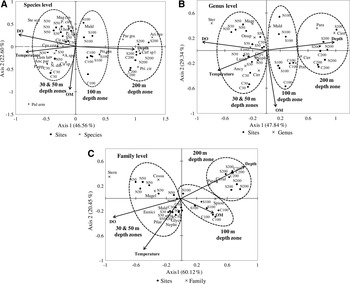
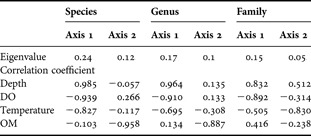
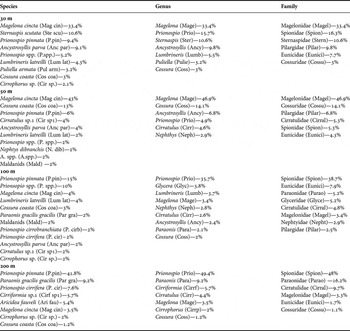
The CCAs demonstrated the relationship of DO and temperature to the depth-related patterns of polychaetes (Figure 6). The variables explained 69%, 77% and 81% of the variance of the first two CCA axes for species, genus and family levels respectively. Eigenvalues and the correlation coefficients of the variables for the three taxonomic resolutions are given in Table 2. The Monte Carlo permutation test (with forward selection) indicated that depth was positively correlated, whereas DO and temperature were negatively correlated with axis 1. OM exhibited a negative correlation with axis 2. Three clusters were distinct in these plots; the first cluster with stations belonging to 30 and 50 m, second cluster with stations from 100 m and third cluster with stations from 200 m depths. CCA plots indicated that in all three taxonomic levels, the first axis separated shallower stations (30 and 50 m) from deeper (100 and 200 m) stations. The second axis further divided 100 and 200 m depth zones in the family level plot. The DO and temperature were found to correlate strongly with depth variation in fauna, with DO having a primary role. The CCA plots revealed a latitudinal separation of stations which corresponded with the OM distribution. Generally, higher OM levels were recorded from the central (average 4.9%) than the southern (2.1%) and the northern (1.6%) latitude stations in 30 and 100 m depth zones. In the plots (Figure 6), the central latitude stations in these depth zones were positioned below the northern and southern stations. Such variation was not prominent in 50 and 200 m depth zones. The CCA also revealed relationships between dominant species (20), genera (15) and families (10) with the environmental variables. Species and genera belonging to the families Sternaspidae, Magelonidae, Cossuridae, Eunicidae, Pilargidae, Nephtydae and Glyceridae were typical of 30 and 50 m depths, while Maldanidae and Spionidae were typical of 100 m depths. Spionidae, Paraonidae and Cirratulidae were found to be typical of the OMZ.
Canonical correspondence analysis triplots showing scores of sites, the most abundant polychaete species/family and explanatory variables. DO, dissolved oxygen; OM, organic matter. Full taxa names are given in Table 3. A, species level; B, genus level; C, family level.

Eigenvalues and correlation coefficients for the first two axes.

DO, dissolved oxygen; OM, organic matter.
Dominant polychaete species, genus and family in each depth zone with its percentage abundance. Abbreviation used in the canonical correspondence analysis plots (Figure 6) is given within parentheses.

DISCUSSION
Depth-related patterns in polychaetes and TS
The present study with a large data set showed that depth-related community patterns of polychaetes are conserved at lower taxonomic resolutions on the western Indian continental shelf. The Spearman rank correlations obtained among the species similarity matrices and higher taxa were very high in most cases, although the R values decreased as it goes to family level. Our species level data exhibited a difference between shallow water and shelf edge communities and a similar variation was identified when generic and family levels data were tested. In this study, ANOSIM results revealed two types of community variations: (i) between stronger depth gradients (30 or 50 m and 200 m depth zones); and (ii) between weaker depth gradients (100 and 200 m depth zones). The former was visible at all three levels of taxonomic resolution, while, the latter was more evident in family level data. ANOSIM results indicate that community dissimilarity between 100 and 200 m depth zones increases from species level to family level (Figure 5).
Taxonomic sufficiency reduces the cost of identification up to 55% for family level identification versus species level (Ferraro & Cole, Reference Ferraro and Cole1995), although, the potential for saving time depends on other factors such as the number of taxonomically difficult families and the expertise available (Olsgard et al., Reference Olsgard, Somerfield and Carr1997). Generally, identification errors that are common at the species level can be avoided by opting for family level identification. At the same time, species level identification is considered to be a fundamental tool to understand the functioning of ecosystems and there are problems with TS particularly in the exclusion of rare species and loss of valuable ecological information (Maurer, Reference Maurer2000). Although such issues remain, the TS approach is very convenient in fast-track community assessment studies, and our results recommend its use in the Indian continental shelf waters.
Depth-related patterns in polychaetes and transformations
Transformations can affect the analyses of multivariate patterns (Olsgard et al., Reference Olsgard, Somerfield and Carr1998; Legendre & Gallagher, Reference Legendre and Gallagher2001; Stark et al., Reference Stark, Riddle and Simpson2003) by shifting the emphasis from the most abundant and dominant species or taxa (for untransformed data) to rare taxa (for presence/absence data) (Anderson et al., Reference Anderson, Connell, Gillanders, Diebel, Blom, Saunders and Landers2005). In this study, the type of transformations did not make major differences in the R values when species data were correlated to higher taxa data and community patterns were tested along the depth gradients (Figures 3–5). The absence of a transformation effect is likely due to both low dominance and even lower number of rare species in the study area. Generally, the average dominance index was <0.22 at 30, 50 and 100 m depth zones and was slightly higher (0.32) at 200 m (Joydas & Damodaran, Reference Joydas and Damodaran2009). Our species level results also showed that about 72% of the species occurred in all the depth zones and that contributed to about 98% of the total individuals (Joydas & Damodaran, Reference Joydas and Damodaran2009). Thus, rare species did not make a sizeable contribution, resulting in presence/absence data not exhibiting notable differences compared to other transformations.
Faunal patterns versus environmental variables
The CCA showed that stations cluster according to depth, DO and temperature. The effect of DO was more pronounced in the 200 m depth zone, which lies within the OMZ. Previous studies have reported that OMZs support benthic fauna that differ fundamentally from those in well-oxygenated environments (Levin et al., Reference Levin, Etter, Rex, Gooday, Smith, Pineda, Stuart, Hessler and Pawson2001; Levin, Reference Levin2003; Hughes et al., Reference Hughes, Levin, Lamont, Packer, Feeley and Gage2009; Ingole et al., Reference Ingole, Sautya, Sivadas, Singh and Nanajkar2009). This is because there are oxygen thresholds below which most taxa are excluded through physiological intolerance to hypoxia, and above which selected taxa are able to take advantage of an abundant food supply (Levin et al., Reference Levin, Whicraft, Mendoza, Gonzalez and Cowie2009). The macrobenthos in OMZs typically shows reduced diversity and high dominance, in comparison with non-OMZ environments (Levin et al., Reference Levin, Etter, Rex, Gooday, Smith, Pineda, Stuart, Hessler and Pawson2001). In the present study, Prionospio pinnata and P. cirrifera (family Spionidae), Paraonis gracilis gracilis and Aricidea fauveli (family Paraonidae), Cirriformia sp. 1 and Cirratulus dasylophius (family Cirratulidae) were found to dominate in the OMZ. Families such as Spionidae, Cirratulidae and Paraonidae were reported as the dominant species of OMZs in the Pakistan Margin (Hughes et al., Reference Hughes, Levin, Lamont, Packer, Feeley and Gage2009), Oman Margin (Levin et al., Reference Levin, Gage, Martin and Lamont2000) and central west coast of India (Ingole et al., Reference Ingole, Sautya, Sivadas, Singh and Nanajkar2009). Macrobenthic composition data from other low oxygen systems, for example, Southern California borderland basins and Scandinavian fjords, suggest that polychaetes, particularly spionids are the predominant taxa when oxygen values fall between 0.1 and 0.5 ml l−1 (Arntz et al., Reference Arntz, Tarazona, Gallardo, Fores, Salzwedel, Tyson and Pearson1991; Levin et al., Reference Levin, Huggett and Wishner1991; Diaz & Rosenberg, Reference Diaz and Rosenberg1995; Levin & Gage, Reference Levin and Gage1998). Although latitudinal variation in fauna was not a prominent feature in this study, OM variation occurs at 30 and 100 m depths between latitudinal zones. The CCA plots revealed an OM effect on polychaetes in a similar way at the three taxonomic resolutions.
CONCLUSION
Depth-related multivariate community patterns in polychaetes in the western Indian continental shelf are conserved at family level taxonomic resolution. The family level data were also sufficient to illustrate the effect of OMZ on polychaete communities. Hence, we propose the use of TS in macrobenthic studies in the western shelf waters of India. The type of transformation did not affect the multivariate patterns of species, genus or family level data, which is attributed to the low dominance and lower number of rare species in the study area.
ACKNOWLEDGEMENTS
This work was supported by the Department of Ocean Development, New Delhi, India (grant number DOD/10-MLR 10/97/OD-II dt. 17.11.1997). We thank CMLRE, Cochin, India for providing enough ship time for successfully completing the sampling. We acknowledge and give our sincere thanks to Mr V. Raveendranath and Dr V.N. Sanjeevan, CMLRE, DOD, Cochin, India for all the help rendered to us. Thanks are also due to the Department of Marine Biology, Microbiology and Biochemistry, School of Marine Sciences, Cochin University of Science and Technology, India for the facilities offered to carry out the work. T.V.J. thanks the Research Institute, King Fahd University of Petroleum and Minerals, Saudi Arabia for the necessary support. We highly appreciate the anonymous referees for their comments and suggestions to improve the quality of the manuscript.