


Introduction
Hormonal, nutritional and metabolic environment to which the fetus is exposed during gestation permanently alters many aspects of fetal development and subsequent expression of physiology during adulthood. This is exemplified by the fact that female rats are masculinized in utero by hormones emanating from male littermates sharing the same uterine horn.Reference Meisel and Ward1 Experimental manipulation of the prenatal steroid environment provides a powerful experimental tool for understanding mechanisms that underlie prenatal programing of the reproductive axis. Our studies using the sheep as an animal model reveal that prenatal exposure of the female to excess testosterone (T) from 30 to 90 days of gestation culminates in a suite of adult disruptions that include estradiol negative/positive and progesterone negative feedback defects, enhanced follicular recruitment and persistence all contributing toward the reproductive compromise evidenced in these animals.Reference Foster, Jackson and Padmanabhan2–Reference Padmanabhan and Veiga-Lopez5 Prenatal T-treated sheep show progressive loss of cyclicity with a large number of animals becoming anovulatory by year 2 of life.Reference Birch, Padmanabhan, Foster and Robinson6, Reference Manikkam, Steckler, Welch, Inskeep and Padmanabhan7 Even more importantly, postnatal overfeeding exaggerates the severity of reproductive phenotype with majority of animals becoming anovulatory during the first breeding season.Reference Steckler, Herkimer, Dumesic and Padmanabhan8 The underlying mechanisms mediating this progressive loss of cyclicity, amplification of severity of reproductive phenotype by postnatal overfeeding, and to what extent ovarian defects contribute toward cycle deterioration remains to be ascertained.
Developmental ontogeny studies found ovarian follicular reserve to be similar in control and prenatal T-treated females at fetal day 140.Reference Smith, Steckler, Veiga-Lopez and Padmanabhan9 However, a 72% depletion of follicular reserve was evident in prenatal T-treated females at 10 months of age (postpubertal) compared with only 35% in controls.Reference Smith, Steckler, Veiga-Lopez and Padmanabhan9 It is unclear whether this enhanced depletion is manifested during prepubertal life or puberty is the time point when accelerated depletion is initiated. A similar rate of depletion prepubertally as in postpubertal life will rule out involvement of pubertal hormonal changes in accelerating depletion. If the accelerated depletion seen in postpubertal animals continues, it would lead to early depletion of ovarian reserve thus providing a basis for early loss of cyclicity seen in prenatal T-treated females.Reference Birch, Padmanabhan, Foster and Robinson6, Reference Manikkam, Steckler, Welch, Inskeep and Padmanabhan7 If this premise holds true, one would expect near complete depletion of ovarian reserve in prenatal T-treated females by year 2 of life, when a large number of prenatal T-treated females are anovulatory.Reference Birch, Padmanabhan, Foster and Robinson6, Reference Manikkam, Steckler, Welch, Inskeep and Padmanabhan7 Similarly, if amplification of severity of reproductive phenotype in prenatal T-treated females by obesityReference Steckler, Herkimer, Dumesic and Padmanabhan8 involves early ovarian depletion, we would expect complete depletion of ovarian reserve in the obese prenatal T-treated females compared with regular-fed prenatal T-treated females.
The present study tested the following three hypotheses: (1) increased follicular depletion is evident during prepubertal life in prenatal T-treated females, (2) increased follicular recruitment and depletion continues at the same rate after the first breeding season in prenatal T-treated females culminating in near depletion of ovarian follicular reserve by the end of the second breeding season, when the majority of these animals are anovulatoryReference Birch, Padmanabhan, Foster and Robinson6, Reference Manikkam, Steckler, Welch, Inskeep and Padmanabhan7 and (3) postnatal obesity amplifies the rate of ovarian depletion in prenatal T-treated females leading to complete depletion of ovarian reserve.
Methods
Procedures used in this study were approved by the Institutional Animal Care and Use Committee of the University of Michigan and are consistent with the National Institutes of Health Guide for the Use and Care of Animals.
Animal breeding and maintenance
Adult Suffolk ewes purchased from local farmers were mated with Suffolk rams of proven fertility. Details of breeding and lambing have been described in detail earlier.Reference Manikkam, Crespi and Doop10 Gestational T treatment involved twice weekly injections of 100 mg T propionate (∼1.2 mg/kg; Sigma-Aldrich Corp., St. Louis, MO, USA) in cottonseed oil (2 ml) from days 30 to 90 of gestation (term: ∼147 day). The concentrations of T achieved in maternal circulation and fetal blood following T administration were reported to be in the range seen in adult male and male fetuses, respectively.Reference Veiga-Lopez, Steckler and Abbott11 After weaning (∼2 months), all lambs were maintained outdoors at the Sheep Research Facility (Ann Arbor, MI, USA; 42°, 18′N). Starting at 14 weeks of age, a subset of prenatal T-treated lambs were overfed. Details of overfeeding, growth, and cycle dynamics of regular-fed and overfed control and prenatal T-treated sheep have already been published.Reference Steckler, Herkimer, Dumesic and Padmanabhan8 Ovaries from following experimental groups were procured from (1) fetal day 90 control (C), (2) fetal day 140 control, (3) prepubertal control (5 months; puberty occurs at 7 months of age), (4) 10-month-old control (postpubertal), (5) 21-month-old (adult) control, (6) fetal day 90 prenatal T-treated, (7) fetal day 140 prenatal T-treated, (8) prepubertal prenatal T-treated, (9) 10-month-old prenatal T-treated, (10) 21-month-old prenatal T-treated and (11) 21-month-old overfed prenatal T-treated (T Ob). Details of ovarian morphometry from the fetal groups and 10-month-old animals (groups 1, 2, 4, 6, 7 and 9) have been already publishedReference Smith, Steckler, Veiga-Lopez and Padmanabhan9 and have set the stage for the questions posed in this investigation. Groups 5, 10 and 11 (21-month-old adults) from the same breeding cohort as in our earlier studyReference Smith, Steckler, Veiga-Lopez and Padmanabhan9 were used in this investigation to determine if ovarian follicular pool continues to be depleted at enhanced rate; a 72% decline in follicular pool was observed in prenatal T-treated animals compared with 35% in controls at 10 months of age.Reference Smith, Steckler, Veiga-Lopez and Padmanabhan9 Ovaries for prepubertal control and prenatal T-treated groups (groups 3 and 8) were obtained from a second set of breeding to address if enhanced follicular depletion is initiated prepubertally. Prenatal T treatment and dietary regimen were the same for both sets of breeding.
Feed was purchased in bulk to minimize batch-to-batch variability. From 6 weeks before the expected date of lambing until the time of delivery, pregnant ewes were group-fed 0.5 kg shelled corn, 2 kg alfalfa hay and 250 mg aureomycin crumbles (chlortetracycline)/ewe/day. Lactating ewes were provided a ration of 1 kg shelled corn and 2–2.5 kg of alfalfa hay/ewe/day. All lambs/ewes had ad libitum access to water and minerals. In addition, lambs were provided ad libitum access to commercial feed pellets (Shur-Gain, Elma, NY, USA; contains 18% crude protein) and alfalfa hay up to 3 months of age. They were all treated regularly with antihelminthics to minimize parasitic infection. The daily diet of the regular-fed females included 1.4 lbs corn, 1.4 lbs hay and 0.03 lbs of supplement (36% crude protein). The daily diet of overfed females included 1.7 lbs corn, 0.03 lbs of supplement and 1.6 lbs hay initially and then ad libitum. The diet for the overfed females was designed to achieve a body weight ∼25% above that of regular-fed females.Reference Steckler, Herkimer, Dumesic and Padmanabhan8
Histology and stereology
Prepubertal and adult ewes were euthanized by administration of a barbiturate overdose (Fatal Plus, Vortech Pharmaceuticals, Dearborn, MI, USA). As morphology is affected by stage of the estrous cycle the adult females were given two 20 mg injections of prostaglandin F2α (PGF2α, 5 mg/ml Lutalyse; Pfizer Animal Health, New York, USA), 11 days apart, to induce luteolysis and synchronize the initiation of the follicular phase in cycling females. Ewes were euthanized 28 h after second PGF2α injection and ovaries collected during the presumptive follicular phase. All ovaries were weighed before fixation for morphometry. One ovary from each animal was used for ovarian morphometry. At 5 months of age, ovaries from seven control and six prenatal T-treated females were studied and at 21 months of age, ovaries from four control, eight prenatal T-treated and six overfed prenatal T-treated females were studied.
The methods used for collection and processing of ovaries were identical to our previous study.Reference Smith, Steckler, Veiga-Lopez and Padmanabhan9 One ovary from each prepubertal lamb/21-month-old sheep was fixed in 4% paraformaldehyde in phosphate buffered saline, embedded in paraffin and serially sectioned at 5 μm. Ovarian, cortical (the outer rim of the ovary containing primordial follicles) and mesonephric remnant volumes were determined using the Cavailieri principle,Reference Gundersen and Jensen12 as detailed in our earlier study.Reference Smith, Steckler, Veiga-Lopez and Padmanabhan9 Briefly, the area of the tissue was estimated by point counting on every 50th section. Mesonephric remnant volumes were estimated on every 10th section at prepubertal but not adult age. A more rigorous sectioning regimen than employed in this study would be required in adult animals to provide accurate estimates of the small mesonephric remnant volumes.
Follicles were classified according to the criteria of Lundy et al. Reference Lundy, Smith, O'Connell, Hudson and McNatty13: (1) primordial (type 1) with one layer of flattened granulosa cells, (2) transitory (type 1a) with one layer of mixed flattened and cuboidal granulosa cells, (3) primary (type 2) with one to less than two layers of cuboidal granulosa cells, (4) small preantral (type 3) with two to four layers of granulosa cells, (5) large preantral follicles with greater than four layers of granulosa cells and no discernible antrum, (6) small antral follicles with developing antrum and ⩽1 mm in diameter and (7) large antral follicles with discernible antrum and >1 mm in diameter. All follicles from type 2 on were considered to be growing follicles. Primordial and transitory follicles were counted using the physical dissector approachReference Smith, O and Hudson14 using every 9th and 10th section pair. For follicles from primary stage and beyond, all follicles were counted in every 10th section using the oocyte as a marker. A follicle was classified as atretic if it contained more than three pyknotic granulosa cells, a misshapen oocyte or a discontinuous membrane, as per definition of Hay et al. Reference Hay, Cran and Moor15
The number of sections examined for volume estimates averaged 16 for prepubertal and 18 for adult ovaries, for follicle counts the number of sections examined was 77 for prepubertal and 90 adult ovaries.
Statistical analyses
All data from both ages were log transformed and subjected to Bartlett's test to confirm equal variances across treatment groups for each variable. Analysis of variance was then performed with treatment differences identified with Fisher's multiple range test using the Minitab statistical software package. Data are presented as means ± s.e.m. A P-value of <0.05 was considered significant.
Results
Ovarian follicular dynamics
Ovarian volume and number of follicles at different stages of follicular differentiation at 5 months of age are summarized in Table 1 and representative images are shown in Fig. 1 (top row). Ovarian volumes did not differ between prenatal T-treated and control lambs during the prepubertal period. When cortical volume was expressed as a percentage of the total ovarian volume, a significant increase was apparent in prenatal T-treated lambs, but only reached a tendency when expressed as a total cortical volume. Prenatal T-treated lambs had approximately half the number of primordial follicles when compared with controls. Conversely, prenatal T-treated lambs had significantly more growing follicles (Table 1) compared with control animals, with this difference being evident at the earliest recognized stage of follicle growth (type 1a), as well as during the preantral and antral stages of development. However, the proportion of healthy-to-atretic antral follicles remained the same between treatment groups, in spite of the increase in total number of antral follicles in the prenatal T-treated females (control: 63% healthy and 37% atretic, T: 57% healthy and 42% atretic; C v. T, P = 0.53).
Ovarian volumes and follicle numbers at 5 months of age
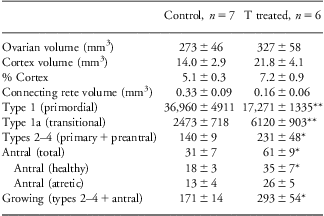
Asterisks indicate significant differences between control and prenatal T-treated 5-month-old lambs.
Ovarian morphology illustrating differences in antral follicle numbers. (a) Control at 5 months of age. (b) Prenatal T-treated at 5 months of age. (c) Control at 21 months of age. (d) Prenatal T-treated at 21 months of age. (e) Prenatal T-treated obese at 21 months of age.
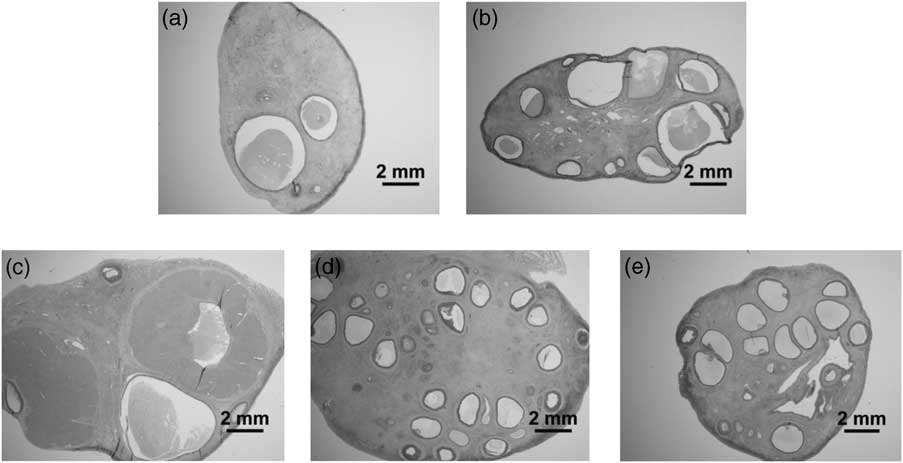
Ovarian volumes and number of follicles at different stages of follicular differentiation at 21 months of age are presented in Table 2 and representative images in Fig. 1 (bottom row). There was no effect of prenatal T treatment on either ovarian or cortical volume. Direction of changes in follicle numbers at 21 months of age followed a similar pattern as that observed at 5 months of age. Prenatal T-treated females had significantly fewer (approximately half) primordial follicles compared with control animals. In contrast, the number of growing follicles was significantly higher in prenatal T-treated animals (Table 2) and this difference was evident at the earliest stage of follicle growth (type 1a), as well as during the preantral and antral stages of development. Similar to the prepubertal age, the proportion of healthy-to-atretic antral follicles at 21 months of age remained the same between treatment groups, in spite of the increase in total number of antral follicles in the prenatal T-treated females (control: 82% healthy and 18% atretic, T: 74% healthy and 26% atretic; C v. T, P = 0.39).
Ovarian volumes and follicle numbers at 21 months of age
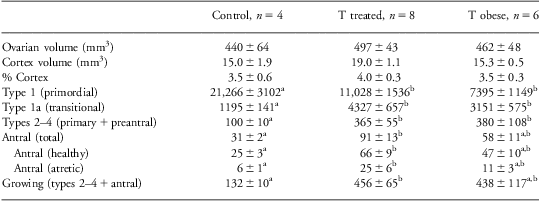
Differing superscripts indicate significant differences between treatment groups.
Ovarian and cortical volumes as well as follicle numbers, at all stages of development, were not different between prenatal T-treated and prenatal T-treated obese females (Table 2). The number of primordial follicles was significantly less and growing follicles significantly higher compared with control, but not prenatal T-treated animals.
Developmental changes in ovarian reserve and follicular dynamics across reproductive lifespan
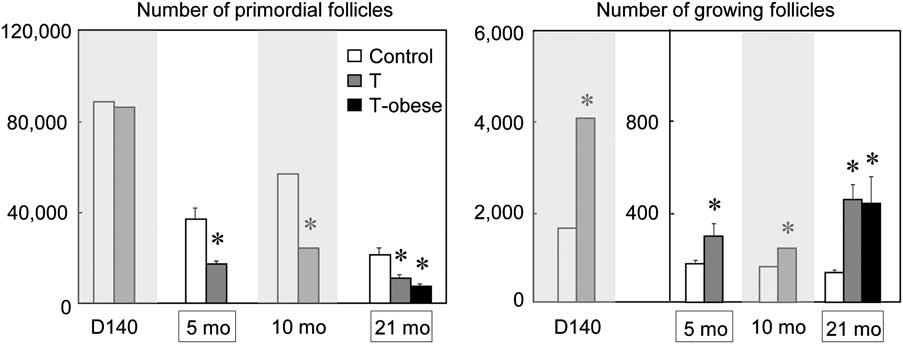
To gain an understanding of changes across the reproductive time span, composite of findings from 5 months and 21 months of age (this study) with our previously published results at fetal day 140 and 10 months of age (postpubertal) are summarized in Fig. 2. Note the fetal day 140, 10 months, and 21 months age groups were all generated as part of the same breeding cohort and 5-month group from a second set of breeding carried out 2 years later. As the stereology technique used to quantify follicle numbers were identical for all ages and carried out by the same personnel, and the effect of prenatal T seen at 5 months of age was similar to that seen at 10 months of age, the lower primordial pool of 5-month-old lambs (C 5 months: 36,960, C 10 months: 58,731, T 5 months: 17,271 and T 10 months: 24,250) most likely stem from body condition of breeding cohorts and/or environmental changes. Stereology of ovaries from 5-month-old lambs revealed a 46% reduction in proportion of primordial follicles in prenatal T-treated lambs compared with controls (Fig. 2, left panel). This proportion is similar to that reported earlier for ovaries from 10-month-old females (44%, previously reported). Interestingly, proportion of primordial follicles in prenatal T females at 21 months of age was also approximately half that seen in controls of similar age (51%, this study). At all ages, prenatal T-treated females had more growing follicles relative to age-matched controls, increasing from a minimum of 170% at 5 months of age to a maximum of 344% at 21 months of age (Fig. 2, right panel)
Number of primordial and growing (types 2–4) follicles in control, prenatal T-treated and prenatal T-treated obese (21 months of age) females across their reproductive lifespan. Data from fetal day 140 and 10 month of age (gray areas) were reported earlierReference Smith, Steckler, Veiga-Lopez and Padmanabhan9 and are included to gain a lifespan perspective. Asterisk indicates significant difference from control group at each time point. Note ovaries from fetal day 140, 10 and 21 months of age originated from same breeding cohort and the 5-month-old from subsequent breeding cohort 2 years later.
The rate of depletion of the ovarian reserve calculated relative to the reserve at day 140, when control and prenatal T-treated fetuses had similar reserve is summarized in Fig. 3. Note that this rate of decline was not calculated for the 5-month group as they originated from a different breeding cohort. From fetal day 140 until 10 months of age the rate of follicular depletion in prenatal T-treated animals is twice that of controls (C = 2989/month, T = 6196/month). Between 10 months of age and 21 months of age this trend is reversed with the rate of follicular depletion in prenatal T-treated animals being 1/3 that of control animals (C = 3405 and T = 1202/month).
Depletion rate of ovarian follicles from fetal day 140 to 10 months of age and 10 months of age to 21 months of age in control and prenatal T-treated ovaries. Note depletion rate from fetal day 140 to 5 months of age are not calculated as the ovaries from 5-month-old lambs originated from a different breeding cohort.

Ovarian morphology at 5 months of age (prepubertal)
Distinctive ovarian abnormalities were apparent in prenatal T-treated lambs. Figure 4 summarizes the morphological anomalies seen in ovaries prenatal T-treated lambs relative to control lambs. At this age, three of six prenatal T-treated animals had a corpus luteum (CL)-like structure (Fig. 4b). None of the controls had similar structures. These CL-like structures were considerably smaller than a regular CL. They were located within the ovary, failing to breach the ovarian surface as with a normal functional CL. These structures most likely represent a luteinized follicle. At the earliest stages of follicle growth (type 1a) some follicles contained highly enlarged oocytes, reaching a diameter of 110 μm compared with 30 μm in control animals (Fig. 4d). The proportion of follicles displaying this abnormal growth was low (<5%). The degree of oocyte enlargement varied, with five of six prenatal T-treated animals displaying at least one extreme example (oocyte diameter >100 μm). None of the control animals displayed any evidence of this abnormality.
Morphological abnormalities in prenatal T-treated ovaries at 5 months of age. (a) Ovarian section from control lamb, note absence of CL. (b) Ovarian section from prenatal T-treated lamb showing small luteinised follicle. (c) Ovarian section from control lamb showing primordial follicles with flattened granulosa cell layer; oocyte diameter ∼30 μm. (d) Ovarian section from prenatal T-treated lamb showing primordial follicle with flattened granulosa cell layer, note enlarged oocyte and oocyte diameter = 110 μm. (e) Ovarian section from control lamb showing normal antrum development. (f) Ovarian section from prenatal T-treated lamb showing abnormal antrum development, note single layer of granulosa cells separating antrum and basement membrane (arrow). (g) Antral follicle from control ovary showing normal vascularity of granulosa cell layer. (h) Antral follicle from prenatal T-treated lamb with relatively healthy granulosa cells, but the appearance of numerous blood cells within the granulosa layer (arrow). (i) Ovarian section from control lamb showing compact nature of connecting rete. (j) Ovarian section from prenatal T-treated lamb showing disbursed nature of connecting rete, tubules are isolated and contain a prominent lumen.

Abnormalities were also apparent from the time of antrum formation and are similar to those described previously in ovaries from 10-month-old animals.Reference Smith, Steckler, Veiga-Lopez and Padmanabhan9 In ∼10% of follicles, at the time of antrum formation, the development of the granulosa cell layer was disrupted such that the developing antrum was separated from the basement membrane by a single layer of granulosa cells rather than multiple concentric layers observed in normal developing follicles (Fig. 4f). The theca layer adjacent to the abnormal granulosa cells appeared thinner with the cells being more fibroblastic in appearance. Such abnormalities appeared in all prenatal T-treated but not control animals. From the time of antrum formation, all prenatal T-treated ovaries contained a number of hemorrhagic follicles, these were characterized by disruptions to the basement membrane resulting in the accumulation of blood cells within the granulosa cell layer (Fig. 4h). There was only one instance of this type of follicle in the control animals.
Connecting rete was present in all ovaries studied. In controls, the connecting rete was a discrete compact structure comprising of a number of epithelial lined tubules interspersed with a small amount of connective tissue (Fig. 4i). The structure was regular in shape and enclosed within a basement membrane. In prenatal T-treated animals, the tubules appeared to be separated from each other and often contained a significant lumen. The resultant structure had an irregular shape, contained considerably more connective tissue between the tubules, and was not enclosed within a continuous basement membrane and disbursed (Fig. 4j).
The ovarian cortex of prenatal T-treated animals was notably thicker than in control ovaries. In control ovaries, a clear delineation was observed between cortex and medulla, whereas in prenatal T-treated ovaries this delineation was less clear (Fig. 5).
Ovarian cortical morphology at 5 months of age. (a) Ovarian section from control lamb illustrating thin well-defined cortex. (b) Ovarian section from prenatal T-treated lamb illustrating comparatively thicker cortex and less definition between cortex and medulla.

Ovarian morphology in 21 months of age (adult females)
Morphological anomalies seen in ovaries of 21-month-old prenatal T-treated females are summarized in Fig. 6. At this age ovaries from five of eight prenatal T-treated and three of six T prenatal T-treated obese animals contained a CL-like structure. In four of the five T and two of three T Ob cases, the small size of the structure suggested that these represented some form of luteinized follicle (Fig. 6b and 6c). The highly enlarged oocytes and the anomalies seen in early follicular classes of 5-month-old prenatal T-treated lambs were no longer apparent in the 21-month-old prenatal T-treated and prenatal T-treated obese groups (Fig. 6d–6f). Seven of eight prenatal T-treated and five of six prenatal T-treated obese females displayed some distinctive hemorraghic follicles (Fig. 6k and 6l). Abnormal antrum formation was observed in four of eight prenatal T-treated and two of six of prenatal T-treated obese animals (Fig. 6h and 6i).
Morphological abnormalities in ovaries of prenatal T-treated and prenatal T-treated obese females at 21 months of age. (a) Ovarian section from control female showing large CL adjacent to ovarian surface. (b) Ovarian section from prenatal T-treated female showing small luteinised follicle. (c) Ovarian section from prenatal T-treated obese female showing moderate sized CL-like structure but remote from ovarian surface. (d) Ovarian section from control female showing normal primordial follicles. (e) Ovarian section from prenatal T-treated female showing primordial follicles of comparable size to control ovary. (f) Ovarian section from prenatal T-treated obese female showing primordial follicles of comparable size to control ovary. (g) Small antral follicle from control female showing normal antrum development. (h) Small antral follicle from prenatal T-treated female showing abnormal antrum development with a single layer of granulosa cells separating antrum and basement membrane. (i) Small antral follicle from prenatal T-treated obese female showing abnormal antrum development. (j) Antral follicle from control female showing presence of blood cells in theca layer but its absence from granulosa cell layer. (k) Antral follicle from prenatal T-treated female showing presence of blood cells within the granulosa cell layer. (l) Antral follicle from prenatal T-treated obese female showing presence of blood cells within the granulosa cell layer. (m) Ovarian section from control female showing small compact connecting rete, tubules have little or no lumen. (n) Ovarian section from prenatal T-treated female showing disbursed connecting rete and prominent lumen. (o) Ovarian section from prenatal T-treated obese female showing disbursed connecting rete and prominent lumen.

The ovarian cortex was similar among control, prenatal T-treated and prenatal T-treated obese animals at 21 months of age (not shown). In seven of eight prenatal T-treated and four of six prenatal T-treated obese animals the connecting rete was disbursed (Fig. 6n and 6o). In the 8th prenatal T-treated animal, the connecting rete was compact, although the tubules contained a prominent lumen. Two prenatal T-treated obese animals displayed a connecting rete, which was compact at one end and disbursed at the opposite end. In two of four control animals, the connecting rete was compact (Fig. 6m), whereas the remaining two animals displayed a disbursed connecting rete.
Discussion
The findings from this study, in concert with previously published findings,Reference Smith, Steckler, Veiga-Lopez and Padmanabhan9 provides evidence in support of a shift in follicle dynamics in prenatally T-treated sheep from increased rate of follicle recruitment during prepubertal life to follicular persistence and stockpiling of growing follicles during postpubertal life. The relevance of these findings and the morphological anomalies to the progressive cycle deterioration reported in these animals,Reference Birch, Padmanabhan, Foster and Robinson6, Reference Manikkam, Steckler, Welch, Inskeep and Padmanabhan7 the potential mechanisms likely to facilitate the shift in follicular dynamics, as well as the translational significance of these findings to polycystic ovary syndrome (PCOS), the reproductive phenotype of whom these animals recapitulates,Reference Padmanabhan, Manikkam, Recabarren and Foster3–Reference Padmanabhan and Veiga-Lopez5 are discussed below.
Follicular depletion/persistence
The nearly 50% reduction in follicle reserve and increase in growing follicles seen in prepubertal animals (5 months of age) is consistent with that reported previously in 10-month-old prenatal T-treated postpubertal females.Reference Smith, Steckler, Veiga-Lopez and Padmanabhan9 The findings of similar reduction in the follicular pool (46%) in prepubertal animals as postpubertal animals (44%)Reference Smith, Steckler, Veiga-Lopez and Padmanabhan9 suggests that enhanced decline in prenatal T-treated animals must have occurred before 5 months of age and is a developmentally reprogrammed event in response to exposure to excess T (Fig. 7). Consistent with this premise, evidence for enhanced recruitment is already evident in prenatal T animals at fetal day 140, a week before presumed time of birth.Reference Smith, Steckler, Veiga-Lopez and Padmanabhan9, Reference Steckler, Wang, Bartol, Roy and Padmanabhan16
Schematic showing prenatal T-treatment induced changes in recruitment rate and percentage of growing follicles across lifespan and the potential outcome.

The mechanisms controlling follicle recruitment remain an enigma. Although paracrine factors play an important role in early follicle growth,Reference McNatty, Reader, Smith, Heath and Juengel17 androgens have been implicated to play a role in enhanced follicle recruitment.Reference Vendola, Zhou and Wang18, Reference Qureshi, Nussey and Bano19 Clearly, increased androgen receptor expression is evident in ovaries of prenatal T-treated females, during fetal life, even after cessation of T treatment (T treatment spans fetal days 30–90).Reference Ortega, Salvetti and Padmanabhan20 A possibility to consider is that rete-derived prethecal cells, which have steroid producing capability,Reference Juengel, Sawyer and Smith21, Reference Quirke, Juengel and Tisdall22 may provide the means by which ovaries of prenatal T-treated females continue to get exposed to high androgen levels locally, thereby facilitating enhanced follicular recruitment.
The increased rate of recruitment before puberty is reinforced if one considers the number of follicles that leave the primordial pool and enter the growing pool of follicles across the reproductive lifespan. Between day 140 of gestation and 10 months of age (postpubertal) ∼3000 follicles per month appear to be recruited from the primordial pool in control animals, whereas in prenatal T-treated animals this number is doubled (Figs 4 and 7). Similar percentage of decline in non-growing follicles relative to controls at 5 months of age (prepubertal) and 10 months of age (postpubertal) indicate this enhanced rate of recruitment is present before 5 months of age. Between 10 months of ageReference Smith, Steckler, Veiga-Lopez and Padmanabhan9 and 21 months of age (this study), when most animals are oligo-/anovulatory,Reference Birch, Padmanabhan, Foster and Robinson6, Reference Manikkam, Steckler, Welch, Inskeep and Padmanabhan7 there is slowing of rate of depletion in prenatal T-treated females. Approximately, 3400 per month leave the primordial pool in control animals, as opposed to ∼1200 follicles in prenatal T-treated females (Fig. 3), a twofold decrease relative to controls of same age and a fivefold reduction from previous time period in prenatal T-treated females. This slowing conceivably contributed to the retention of nearly ∼13% of the ovarian reserve at 21 months of age in prenatal T-treated females as opposed to ∼26% in control females. As such, depleted ovarian reserve is not the cause of loss of cyclicity in 21-month-old females.Reference Birch, Padmanabhan, Foster and Robinson6, Reference Manikkam, Steckler, Welch, Inskeep and Padmanabhan7
The progressive increase in stockpiling of follicles across reproductive lifespan with maximum numbers evident in 21-month-old animals (Fig. 7) may relate to endocrine changes associated with progressive loss of cyclicityReference Birch, Padmanabhan, Foster and Robinson6, Reference Manikkam, Steckler, Welch, Inskeep and Padmanabhan7 these females undergo after pubertal onset. These hormonal changes include the increased exposure to continuous elevations in estradiol,Reference Veiga-Lopez, Ye and Phillips23 reduced exposure to progesteroneReference Manikkam, Steckler, Welch, Inskeep and Padmanabhan7, Reference Veiga-Lopez, Ye and Phillips23 and reduced insulin sensitivity.Reference Padmanabhan, Veiga-Lopez, Abbott, Recabarren and Herkimer24, Reference Recabarren, Padmanabhan and Codner25 The findings of increased number of growing follicles are consistent with ultrasonographic findings of follicular persistence in prenatal T-treated sheep.Reference Manikkam, Steckler, Welch, Inskeep and Padmanabhan7, Reference Steckler, Manikkam, Inskeep and Padmanabhan26 Increased estradiol seen in prenatal T femalesReference Veiga-Lopez, Ye and Phillips23 may be facilitory to growth of follicles. The absent or low progesterone milieuReference Manikkam, Steckler, Welch, Inskeep and Padmanabhan7, Reference Veiga-Lopez, Ye and Phillips23, Reference Steckler, Manikkam, Inskeep and Padmanabhan26 and hyperinsulinemic statusReference Padmanabhan, Veiga-Lopez, Abbott, Recabarren and Herkimer24, Reference Recabarren, Padmanabhan and Codner25 of these animals may contribute to the development of follicular persistence in prenatal T-treated sheep, the former contributing to increased luteinizing hormone (LH) release due to reduced negative feedback,Reference Veiga-Lopez, Ye and Phillips23, Reference Robinson, Forsdike and Taylor27 and later by increasing the responsiveness of follicles to LH.Reference Willis, Mason, Gilling-Smith and Franks28, Reference Poretsky, Cataldo, Rosenwaks and Giudice29 Although these mechanisms may explain stockpiling of follicles during later stages of follicle development, stockpiling of follicles is evident even during early stages of follicle growth. Given that LH receptor is not expressed in ovine follicles until the type 4 stage of development,Reference Logan, Juengel and McNatty30 it appears unlikely that changes in LH or sensitivity to LH can explain stockpiling of early growing follicles.
Alternatively, follicle persistence and/or follicle stockpiling in prenatal T-treated animals may reflect reduced rate of follicular atresia. The finding that proportion of healthy-to-atretic follicles are similar in control and T females fail to support reduced rate of atresia in the antral follicular class as the underlying cause, although this possibility cannot be ruled out with types 2, 3 and 4 follicle classes. Paradoxically, a decrease but not an increase in Bcl-2, an anti-apoptotic factor, is evidenced in granulosa cells of antral follicles from 10- and 21-month-old prenatal T-treated females.Reference Padmanabhan, Salvetti, Veiga-Lopez and Ortega31 A more detailed investigation focusing on pro- and anti-apoptotic factors and effector caspase are required to determine if reduced atresia in small follicles is a contributing factor. Interestingly, reduced atresia of small follicles has also been implicated as a factor in the increased numbers of growing follicles seen in PCOS ovaries.Reference Webber, Stubbs and Stark32 A decrease in apoptosis and the apoptotic effector caspase 3, and an increase in cellular inhibitor of apoptosis-2 has been found in ovarian follicles of these women.Reference Das, Djahanbakhch and Hacihanefioglu33 A third mechanism by which follicle stockpiling/persistence could be achieved is through slowing of growth rate, as suggested for follicle stockpiling in PCOS ovaries,Reference Maciel, Baracat and Benda34 with slower growth perhaps being driven by abnormal expression of oocyte growth differentiation factor 9 (GDF9).Reference Teixeira Filho, Baracat and Lee35
The increased percentage of growing follicles and reduced rate of follicular depletion evidenced with advancing age suggests that follicular persistence may be a contributing factor in the loss of cyclicity. To what extent the altered hormonal milieu of prenatal T-treated females contribute to this age-related shift in follicular dynamics remains to be determined. Previously, we found that the oligo-ovulatory prenatal T-treated females manifest increased follicular phase LH pulse frequency, delayed but increased preovulatory estradiol rise, tendency for an amplified secondary follicle-stimulating hormone (FSH) surge and a shift in the relative balance of FSH regulatory proteins inhibin, follistatin and activins.Reference Veiga-Lopez, Ye and Phillips23 The anovulatory prenatal T-treated animals had high-frequency LH and elevated estradiol concentrations.Reference Veiga-Lopez, Ye and Phillips23
The lack of difference in the ovarian reserve between prenatal T-treated and prenatal T-treated obese animals at 21 months of age suggests that obesity per se does not accelerate depletion of ovarian follicular reserve and hence it is not a contributing factor in amplification of the severity of reproductive phenotype seen in prenatal T-treated obese females (six out of seven studied were anovulatory during first breeding seasonReference Steckler, Herkimer, Dumesic and Padmanabhan8). This finding is consistent with the premise that rate of follicular depletion is programmed early during development. Similarly, the lack of increase in the rate of stockpiling of growing follicles in prenatal T and prenatal T-treated obese females is consistent with the lack of amplification of insulin resistance in prenatal T-treated females.Reference Padmanabhan, Veiga-Lopez, Abbott, Recabarren and Herkimer24
Morphological deviations
Appearance of luteinized follicles in prenatal T-treated females at 5 months of age is consistent with previous findings.Reference Steckler, Manikkam, Inskeep and Padmanabhan26 As we only sectioned one of two ovaries, it is conceivable that the majority of prenatal T-treated females manifest this feature. Appearance of these luteinized structures in prenatal T-treated animals may be a function of increased LH secretion reported in prenatal T-treated females.Reference Sarma, Manikkam and Herkimer36, Reference Manikkam, Thompson and Herkimer37 The appearance of enlarged oocytes at the earliest stage of follicle growth in 5-month-old animals parallel what was reported at fetal day 140.Reference Steckler, Wang, Bartol, Roy and Padmanabhan16 Extreme cases of this were readily apparent in prenatal T-treated animals during prepubertal life. Interestingly, enlarged oocytes is also a feature of Inverdale sheep, which contain a mutation on the BMP15 geneReference Braw-Tal, McNatty and Smith38 and also the Thoka sheep, which contain a mutation on the GDF9 gene.Reference Nicol, Bishop and Pong-Wong39 Absence of significant changes in oocyte diameter in 10-month- (previous study) and 21-month-olds (this study) suggests that pubertal events may have contributed toward the normalization of oocyte size, or, alternatively, given the natural variation in primordial follicle oocyte diameter,Reference Lundy, Smith, O'Connell, Hudson and McNatty13 subtle variations in oocyte diameter may be missed.
The appearance of hemorraghic follicles and abnormal early antrum formation in prenatal T-treated animals at 5 months as well as 21 months of age support their presence throughout reproductive lifespan and is consistent with what has been reported previously at 10 months of age.Reference Smith, Steckler, Veiga-Lopez and Padmanabhan9 Conceivably, disrupted estrogen signaling seen in prenatal T-treated femalesReference Ortega, Salvetti and Padmanabhan20 may underlie the presence of hemorrhagic follicles. Hemorrhagic follicles are features of transgenic models involving chronic LH hypersecretion or disrupted estrogen signaling.Reference Korach, Emmen and Walker40, Reference Nilson, Abbud, Keri and Quirk41 The differences in the morphology of the connecting rete at 5 months as well as 21 months of age, are also consistent with what was seen at 10 months of age.Reference Smith, Steckler, Veiga-Lopez and Padmanabhan9 Although a function for the rete in postnatal animals remains to be established, it is believed that the rete contributes to the differentiation and development of the ovarian cortex,Reference Wartenburg42 the source of follicular thecal cells. The rete has previously been suggested as a source of thecal cells.Reference Sawyer, Smith and Heath43 Although most consider a fully differentiated theca layer is not present in ovarian follicles until well after growth has been initiated, some argue the presence of thecal cells from very early in the growth processReference Hirshfield44 and others have demonstrated the presence of steroid producing cells in the ovarian cortex.Reference Forsdike, Hardy and Bull45 The concept of differences in rete development leading to differences in a population of prethecal cells in prenatal T-treated animals is an exciting possibility given the reported differences in thecal cell function in ovaries of PCOS women.Reference Gilling-Smith, Willis, Beard and Franks46
Translational significance
Considering that the reproductive phenotype of prenatal T-treated females mimic that seen in women with PCOS,Reference Padmanabhan, Sarma, Savabieasfahani, Steckler and Veiga-Lopez4, Reference Padmanabhan and Veiga-Lopez5 and polycystic ovarian morphology is a feature of Rotterdam diagnostic criteria,47 the findings are likely to be of translational relevance. As puberty is a time point when PCOS diagnosis is made, the finding of switch to stockpiling of follicles later in reproductive life of prenatal T-treated females is also of interest. It should be recognized that findings of follicular recruitment and stockpiling of follicles discussed in women with PCOSReference Maciel, Baracat and Benda34 are surmised from follicular distribution based on single time point assessment as opposed to multiple time points during the reproductive lifespan of prenatal T-treated sheep. Should a similar shift occur in women with PCOS, it could explain the different conclusions reached in previous studies, some reporting increased follicle recruitment, whereas others not.Reference Maciel, Baracat and Benda34, Reference Webber, Stubbs and Stark48–Reference Hughesdon50
In summary, this study shows a shift in follicular dynamics in prenatally T-treated sheep from one that favors increased follicular recruitment to stockpiling of follicles during later life, a feature predicted in women with PCOS.
Acknowledgments
We are grateful to Mr Douglas Doop for help with breeding, lambing and providing quality care and maintenance of animals used in this study; Mr James Lee, Mr Vince Pagano, Ms Carol Herkimer for help during collection of ovaries and Dr Teresa Steckler for help sectioning ovaries. These studies were funded through the NIH P01 HD44232 grant.



