INTRODUCTION
The nitrogen (N) concentration of shoots and leaves is a widely used indicator for N nutrition status (Lemaire et al. Reference Lemaire, Cruz, Gosse and Chartier1985). The plant N concentration (cN) in field crops has been related to shoot biomass/m2, because studies have indicated that cN decreases with increasing biomass (Justes et al. Reference Justes, Mary, Meynard, Machet and Thelier-Huche1994). The underlying functional reasons for this N dilution are: (i) mutual shading of leaves (Rawson et al. Reference Rawson, Gardner and Long1987); (ii) change in leaf : stem ratio, which generally decreases as crop biomass increases; and (iii) change in proportion of non-structural carbohydrates in stems (Gastal & Lemaire Reference Gastal and Lemaire2002). However, Justes et al. (Reference Justes, Mary, Meynard, Machet and Thelier-Huche1994) defined the critical N concentration as the minimum cN in above-ground biomass necessary to achieve maximum amount of dry matter. It was described as a negative power function of biomass. The ratio of actual and critical cN then gives the N nutrition index (NNI, Justes et al. Reference Justes, Mary, Meynard, Machet and Thelier-Huche1994) as an indicator for plant N status up to the flowering stage of wheat. Based on the NNI concept, some diagnostic tools have been established aiming to improve N management practices (Prost & Jeuffroy Reference Prost and Jeuffroy2007).
The concept of critical N concentration is also used in several wheat crop simulators (Ritchie & Otter Reference Ritchie, Otter and Willis1985; Hansen et al. Reference Hansen, Jensen, Nielsen and Svendsen1991; Porter Reference Porter1993; Keating et al. Reference Keating, Carberry, Hammer, Probert, Robertson, Holzworth, Huth, Hargreaves, Meinke, Hochman, McLean, Verburg, Snow, Dimes, Silburn, Wang, Brown, Bristow, Asseng, Chapman, McCown, Freebairn and Smith2003) to calculate wheat N demand as well as factors for N-limited growth or leaf expansion. Biomass-based critical N concentrations are used in some models (Brisson et al. Reference Brisson, Mary, Ripoche, Jeuffroy, Ruget, Nicoullaud, Gate, Devienne-Barret, Antonioletti, Durr, Richard, Beaudoin, Recous, Tayot, Plenet, Cellier, Machet, Meynard and Delecolle1998), while other wheat simulators such as CERES-Wheat and APSIM (Ritchie & Otter Reference Ritchie, Otter and Willis1985; Keating et al. Reference Keating, Carberry, Hammer, Probert, Robertson, Holzworth, Huth, Hargreaves, Meinke, Hochman, McLean, Verburg, Snow, Dimes, Silburn, Wang, Brown, Bristow, Asseng, Chapman, McCown, Freebairn and Smith2003) use threshold N concentrations which are based exclusively on stage-dependent functions.
In addition, biomass- or development-based maximum and minimum curves are defined in some crop simulators for calculation of N demand, but have to be distinct from the critical N concentration used for calculation of light use efficiency (LUE) reduction factors (relative LUE (rLUE)). Indeed, biomass-based dilution curves often also correlate with phenological development, especially if each biomass level corresponds to a relatively restricted range of developmental stages (Justes et al. Reference Justes, Mary, Meynard, Machet and Thelier-Huche1994).
The N dynamics between leaves, stems and generative organs is not only a function of phenology, but also affected by environmental factors such as intensity of incident solar radiation (Bertheloot et al. Reference Bertheloot, Andrieu, Fournier and Martre2008). However, since a critical N concentration for shoot biomass does not differentiate between plant organs it is also not sensitive to N translocation from leaves to growing grains. Therefore a biomass-related critical N concentration can be problematic, because there is a risk that the impact of year-specific growth conditions on sink–source interaction between vegetative and generative organs is underestimated.
It has previously been shown for a range of crops that specific leaf nitrogen content (SLN, g N/m2) affects photosynthetic capacity and therefore LUE (Sinclair & Horie Reference Sinclair and Horie1989). However, leaf-N related indicators for rLUE are sensitive to N translocation processes, which is an advantage compared with indicators related to shoot N concentration. Meinke et al. (Reference Meinke, Hammer, van Keulen and Rabbinge1998) defined a SLN threshold value below which a linear LUE reduction is applied. However, canopy leaves N (Dreccer et al. Reference Dreccer, van Oijen, Schapendonk, Pot and Rabbinge2000) as well as specific leaf area (Ratjen & Kage Reference Ratjen and Kage2013) are influenced by the light gradient within the canopy. Thus, for determination of SLN thresholds, mutual shading within the canopy should be taken into account.
One application of wheat crop simulators is to evaluate the crop growth response to N, but as far as we know a comparison of different model approaches for calculation of rLUE has not yet been published with recent experimental data. Model approaches are often evaluated within a dynamic crop model, but in this case the predictive quality of the approach also depends on the quality of involved explanatory variables simulated by the crop model where the approach is implemented in.
The first aim of the present paper was to develop and test an SLN-based indicator for prediction of rLUE, suitable for wheat crop simulators. In this context, the goal was to improve assessment by comparing this indicator with other approaches: biomass- and development-based critical shoot N concentrations. The second aim was therefore to develop a method to allow the comparison of different predictive approaches for rLUE estimation, ensuring a close link to experimental field data, thereby avoiding dependencies of an underlying crop model. The third aim was to investigate the relationship between rLUE and indicator values, which is often assumed to be linear and proportional.
MATERIALS AND METHODS
Site conditions
Experiments were conducted at the Hohenschulen experimental farm of the University of Kiel, located in Northwest Germany (54°19′3 N, 9°58′37 E); characterized by a total annual rainfall average of c. 750 mm, of which c. 400 mm is received during April to September (main growing season) and c. 350 mm during October to March. The soil type is pseudogleyic luvisol (characterized according to BGR 2005), with a soil texture varying from sandy loam to clayey loam.
Field trials and experimental design
The daily mean air temperature (°C) and the solar radiation (MJ/m2/d) were measured on site. The photosynthetically active radiation (PAR) was calculated as half of total solar radiation, measured with a Kipp & Zonen SP-Lite Silicon Pyranometer. Crop development was characterized using the BBCH code, which is equivalent to the Zadoks scale (Zadoks et al. Reference Zadoks, Chang and Konzak1974; Lancashire et al. Reference Lancashire, Bleiholder, van den Boom, Langelüddecke, Stauss, Weber and Witzenberger1991; Harrell et al. Reference Harrell, Wilhelm and McMaster1998). The wheat was fertilized at three dates: the beginning of the vegetative period in spring, the beginning of shoot elongation (BBCH 30) and the booting stage (BBCH 50/51). The plot size was 3 × 12 m2. In 2004, the treatment contained four N levels: 0, 120 kg N/ha (40/40/40), 192 kg N/ha (30/50/72/40) and 320 kg N/ha (120/120/80) with cultivar Ritmo. At the 192 kg N/ha level, the third application was split (pre- and post-booting stage). In 2005 and 2006, four cultivars were grown (2005: Cubus, Ritmo, Hybred and Dekan; 2006: Cubus, Ritmo, Tommi and Dekan) with sowing dates between 15 September and 6 October and four (mineral) N levels: 0, 80 kg N/ha (40/40/0), 160 kg N/ha (80/40/40) and 240 kg N/ha (80/80/80). In 2012, N treatments were identical to 2005 and 2006, but with only two cultivars (Batis, Ethos), sown on 5 October. Sowing densities were 240, 220, 300, 320 seed/m2 in 2003/04, 2004/05, 2005/06 and 2011/12, respectively. In all years, a completely randomized arrangement was used for plots (no split plots).
Measured variables and sampling dates
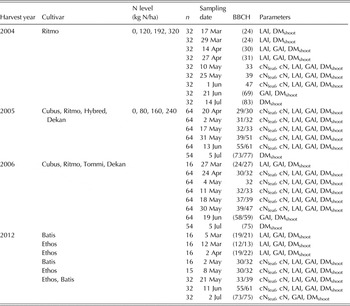
Measured crop parameters were shoot dry matter (DMshoot, g/m2), total shoot N concentration (cN, %), total N concentration in leaves (cNleaf, %), SLN (g/m2), leaf area index (LAI) and green area index (GAI). Sampling dates are shown in Table 1: 0·25/m2 of each plot was harvested at each sampling date. Each data point represents an average of eight replications harvested in 2004, and four in 2005 and 2006. To avoid boundary effects, sampling areas within a plot were not adjacent to each other. The plants were separated into leaf blades, stems and spikes. After drying and weighing separately, the fractions were analysed for cN using near-infrared spectroscopy (NIRS) analysis (NIRS Systems 5000 scanning monochromator: FOSS GmbH, Rellingen, Germany; WINISI software package: Infrasoft International, Port Matilda, PA, USA). Total above-ground dry matter and total N were calculated by summing the fractions.
Experimental treatments, range of observed development stages (BBCH), N fertilized, cultivars and number of samplings (n)

Measured parameters are: leaf area index (LAI), green area index (GAI), shoot dry matter (DMshoot, g/m2), leaf N concentration (cNleaf, %) shoot N concentration (cN, %). If BBCH stands in brackets, the sampling was used as additionally data point for robust curve fitting (DMshoot, GAI), but not for calculation of indicators.
The leaf area (L) was measured using LI 3100c leaf area meter (LiCor; Lincoln, USA). All leaves were pooled and dried at 80°C to constant weight before weighing. The GAI is the ratio of green area to the area of ground on which the crop is growing and was measured with a Li-Cor® LAI2000 weekly during sampling period. Light use efficiency was calculated focusing on the phase between the beginning of stem elongation and the end of flowering, for two reasons: the first reason concerns the significance of N limitation at stem elongation for under-fertilized treatments, where most leaf area is developed. Secondly, the LAI2000 method does not distinguish between green and senescent plant tissue. In order to prevent any overestimation in calculated light interception only measurements before the grain filling period (where senescence is negligible) were included.
Interpolation of field data
For each treatment, logistic growth curves were fitted to the observed DMshoot and GAI values using the sum of temperatures since sowing as an independent variable. For the phase before the booting stage, GAI and destructively measured LAI values were pooled after transforming LAI into GAI, in order to maintain the most robust GAI estimation. The transformation was based on an empirical GAI/LAI relation for the phase before ear emergence (GAI = LAI/0·957, data not shown). The derived daily GAI was used for calculation of the PAR interception.
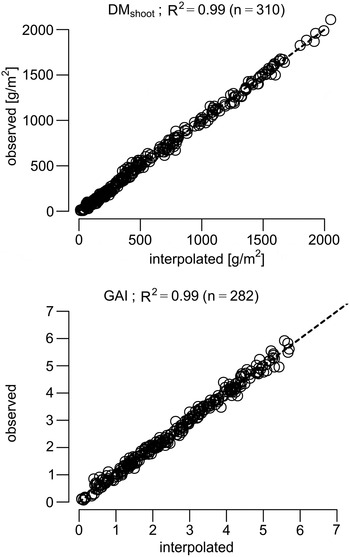
Initial GAI growth in thermal time is exponential, followed by a linear phase and is then capped at a maximum level at anthesis (Lawless et al. Reference Lawless, Semenov and Jamieson2005). From a formal point of view, the logistic growth curve cannot reproduce a true linear phase, but an almost linear interpolation is possible, which explains close conformity between measured and interpolated values: plotting interpolated and observed data points (mean of replications) reveals an R 2 of 0·99 for GAI and DMshoot (Fig. 1). The curve fitting was performed via non-linear least square optimization using the ‘nls’ function for the quadratic and self-starting nls logistic model ‘SSlogis’ for the logistic interpolation from the ‘stats’ package of the R language (R Development Core Team 2012).
1:1 plot of observed v. interpolated shoot dry matter (DMshoot) and green area index (GAI). Each data point represents the average of the respective replications.

Light use efficiency and Light use efficiency reduction factor
The shoot growth rate (g/m2/d) of a particular measurement day was derived from the differential equation of the logistic growth curve for each treatment:
 $$\displaystyle{{{\rm dD}{{\rm M}_{{\rm shoot}}}} \over {{\rm d}t}}(t) = r \times {\rm D}{{\rm M}_{{\rm shoot}}}(t) \times \left( {1 - \displaystyle{{{\rm D}{{\rm M}_{{\rm shoot}}}(t)} \over K}} \right)$$
where r and K are parameters of the logistic fit, while t is the thermal time of the measurement day cumulated since sowing day with a base temperature of 0 °C. The intercepted PAR radiation (Q, MJ/m2) was calculated according to the Lambert–Beer's law:
 $$Q = {Q_0} \times (1 - {{\rm e}^{( - k {\cdot} {\rm GAI})}})$$
where Q 0 is the incident radiation above canopy and the extinction coefficient k was assumed to be 0·7 according to Bertheloot et al. (Reference Bertheloot, Andrieu, Fournier and Martre2008).
In order to dampen any short-term, diurnal variations in temperature and PAR, the cumulative Q (QSUM, daily values) was interpolated against thermal time using a quadratic function:
 $${\rm QSUM}(t) = a + b \times t + c \times {t^2}$$
This interpolation (Eqns (2) and (3)) was also highly convergent (R 2 > 0·99; not shown). For each measurement day, the effective LUE of the respective treatment was gained from the ratio of shoot growth rate and change rate of cumulative Q:
 $${\rm LUE}{\rm} (t) = \displaystyle{{{\rm dD}{{\rm M}_{{\rm shoot}}}} \over {{\rm d}t}}(t) \times \displaystyle{{{\rm d}t} \over {{\rm dQSUM}}}(t)$$
Optimum N supply was defined by comparing the biomass of different N treatments (Table 1). For each measurement date (from the beginning of stem elongation until flowering, Table 1), the average LUE off all sufficiently N-fertilized treatments (LUEopt(t), N supply > 190 kg N) was defined as optimum for the particular day. The rLUE of an individual treatment was defined as:
 $${\rm rLUE}(t) = {\rm LUE}(t)/{\overline {{\rm LUE}} _{{\rm opt}}}(t).$$
Examined indicators for nitrogen nutrition status
Development-based indicator (nitrogen factor, according to CERES-Wheat)
Within the CERES-Wheat model, the critical shoot N concentration (tops critical N percentage, TCNP) is calculated as a function of developmental stage (DC, Zadoks et al. Reference Zadoks, Chang and Konzak1974). Different equations are used for winter and summer wheat. The function for winter wheat (http://nowlin.css.msu.edu/wheat_book/CHAPTER4.html) was used in the present study:
 $${\rm TCNP}{\rm} = - 5 {\cdot} 0112{\rm} - {\rm} 6 {\cdot} 3507{\rm} \times {\rm DC} + 14 {\cdot} 9578{\rm} \times {\rm} \sqrt {{\rm DC}} {\rm} + {\rm} 0 {\cdot} 2238{\rm} \times {\rm D}{{\rm C}^2}$$
The nitrogen factor (NFAC), which is the primary mechanism used within the model to determine the effect of N on plant growth, was calculated as follows:
 $${\rm NFAC}{\rm} = {\rm} 1 {\cdot} 0 - {\rm} \displaystyle{{({\rm TCNP} - {\rm} cN)} \over {({\rm TCNP} - {\rm TMNC})}}$$
where TMNC is the assumed minimum shoot N concentration:
 $${\rm TMNC}{\rm} = {\rm} 2 {\cdot} 97{\rm} - {\rm} 0 {\cdot} 455{\rm} \times {\rm DC}$$
A fractional growth stage was used to determine an approximate value (floating decimal number) for the corresponding DC stage.
For the evaluation, the observed BBCH stages were converted to DC according to Harrell et al. (Reference Harrell, Wilhelm and McMaster1998). At some sampling dates, development stages differed slightly between replications (see Table 1). In these cases, the critical N concentrations necessary for the NFAC calculation (Eqns (6)–(8)), were calculated separately for both development stages and averaged afterwards.
Nitrogen Nutrition Index
The NNI was calculated as the ratio between current cN and the critical N concentration as percentage of DMshoot (Ncrit, %). Critical N concentration was determined by the equation proposed by Justes et al. (Reference Justes, Mary, Meynard, Machet and Thelier-Huche1994), which is based on a biomass dilution curve.
Specific Leaf Nitrogen Index
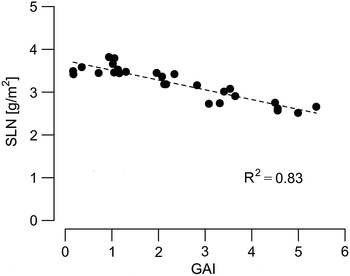
Since the vertical canopy gradient of leaf N is an adaptation to the light gradient (Dreccer et al. Reference Dreccer, van Oijen, Schapendonk, Pot and Rabbinge2000), the (overall canopy) SLN decreases with increasing GAI even under optimum N supply. Thus, for the estimation of SLN under optimal N supply, the influence of mutual shading has to be taken into account. Observed SLN values were plotted against GAI before generating a frequency table by breaking SLN observations into GAI class intervals (0–1, 1–2,…, 5–6). The data set contains N levels up to 320 kg fertilized N/ha. In order to measure the impact of GAI on maximum SLN (SLNmax) and avoiding the impact of outliers, the upper 10% percentile of all the SLN observations of a respective interval was defined as the SLN threshold. Observations of SLN above or equal to these thresholds were plotted against their corresponding GAI values. A highly significant linear relation between SLNmax and GAI was found (SLNmax = −0·228 × GAI + 3·74, P-value of slope: P < 0·001, Fig. 2). The SLNI, was then defined as:
 $${\rm SLNI} = {\rm SLN}/{\rm SL}{{\rm N}_{\max}} $$
Relationship between maximum overall specific leaf nitrogen (SLN: upper 10% quantile of green area index (GAI) class intervals) and GAI. Intercept: 3·74 (P < 0·001); slope: –0·228 (P < 0·001).

Comparison of indicators
The SLN-based SLNI was compared with two other indicators (NNI and NFAC) as a reference. The performance of all three indicators was tested using the same data set containing different modern bread wheat cultivars and N levels (see Table 1).
In order to investigate the relationship between rLUE and indicators, rLUE observations were plotted against corresponding indicators. Van Delden (Reference Van Delden2001) found a non-linear relationship between NNI and rLUE for potato and used an exponential function to describe this relationship. In the present paper, a quadratic with plateau curve was used to describe the relationship between rLUE and the respective indicators (NFAC, NNI, SLNI). The plateau was defined as the maximum of the quadratic equation:
 $$y(x) = \left\{ {\matrix{ {a + bx + c{x^2}} & { \vert x{\rm \mathbin{\lower.3ex\hbox{$\buildrel<\over {\smash\;{\scriptstyle=}\;\vphantom{_x}}$}}} {x_{\max}}} \cr {a + b{x_{\max}} + cx_{\max} ^2} & { \vert x \gt {x_{\max}}} \cr}} \right.$$
where x max = –b/2c.
In Eqn (10), the respective minimum index value necessary to reach the maximum rLUE represents the critical threshold, below which LUE drops. These thresholds and the specific rLUE responses are important for crop simulators.
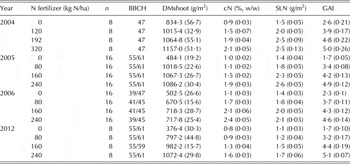
The present study focussed on the general applicability of indicators, rather than a cultivar-specific calibration. In order to minimize the influence of genotype as well as measurement errors, values (indicators, rLUE) of the same N treatment and sampling date were averaged across cultivars. The statistical evaluation included mean absolute error (MAE, Wallach et al. Reference Wallach, Makowski and Jones2006) and coefficient of determination (R 2). Statistical parameters as well as the significance of fit parameters were calculated by statistical software R (R Development Core Team 2012). Plant parameters observed at the end of the investigated period are shown in Table 2.
Means of shoot dry matter (DMshoot), shoot N concentration (cN), specific leaf nitrogen (SLN) and green area index (GAI) for different treatments and years at the end of the investigation period (s.e. in brackets)

RESULTS
For all years, both cN and SLN increased with increasing N supply. Significant differences were found between N levels (for biomass P < 0·001 for all years), while the influence of cultivar was mostly not significant (not shown). The comparison was performed on an annual basis, because sampling periods differed from year to year (see BBCH column of Table 2). Averaged over genotypes and years, the lowest LUE was observed for the unfertilized treatments.
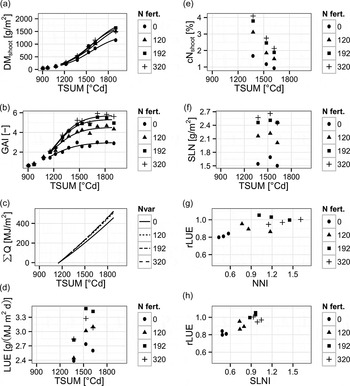
The N supply tended to increase LUE, but with the exception of 2012 the highest LUE was already observed at N levels below maximum N supply (this is illustrated as an example for the year 2004 in Fig. 3). Despite the fact that LUE was not enhanced by additional N supply, the highest amount of DMshoot and GAI were observed at the highest N levels with the exception of 2005, where DMshoot at 240 kg N/ha was very similar to that at the 160 kg N/ha level. In 2004 DMshoot was highest at the 320 kg N/ha N level, in accordance with NNI and SLNI, while NFAC showed the second lowest index value compared with other high fertilized treatments (not shown). The highest NFAC was found in 2006.
Calculation of LUE (d), rLUE (g, h) and plant indicators for N status N nutrition index (NNI), specific leaf nitrogen index (SLNI) from field measurements (a, b, e, f) illustrated for the year 2004 (each point represents the average over eight replications). Shoot dry matter (DMshoot) and green area index (GAI) are interpolated against thermal time since sowing (a, b; Eqn (1)). The photosynthetically active radiation (PAR) interception, Q, was then calculated according to Eqn (2). Cumulative Q (c), was interpolated in order to dampen short-term variations (Eqn (3)). The absolute radiation use efficiency (LUE: d) of the sampling dates was calculated according to Eqn (4). The relative LUE (rLUE: g, h) expresses the LUE relatively to the LUE observed under optimum N supply (Eqn (5)). The NNI was calculated as a function of DMshoot (a) and cN (e), while SLNI was derived from SLN (F) and GAI (b) according to Eqn (9). Field measurements are plotted against thermal time (TSUM) since sowing, while rLUE was plotted against indicators (NNI, SLNI).

The accuracy of all indices (NFAC, NNI, SLNI; Fig. 4) was tested on the same database. For NFAC and SLNI, the maximum rLUE was reached at an index value below 0·9 (NFAC: 0·88, SLNI: 0·87), while this threshold was closer to one for NNI (0·95). Most observations are above the 1 : 1 line, which applies for all three indices. The rLUE v. index relationships seem to be non-linear for all three indices. Regarding coefficients of determination and MAE, SLNI and NNI showed comparable accuracy (Fig. 4). In contrast, there was only a weak correlation between rLUE and NFAC. The SLNI seems to be less variable compared with NFAC and NNI. Regarding the index v. rLUE relationships, levels of all plateaus are close to one (see dashed lines of Fig. 4), which indicates that treatments assumed as being optimally N supplied were in fact suitable for the rLUE calculation.
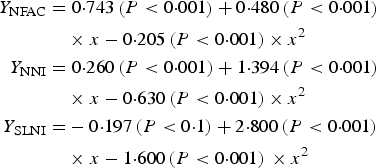
Relationship between relative radiation use efficiency (LUE/LUEopt) and indicator values (index). Values are averaged across cultivars (n = 68). Statistical parameters are mean absolute error (MAE) and coefficient of determination (R 2). The maximum of the quadratic plateau is indicated by the soft dashed lines (1:1 = black dashed line). Coefficients of the quadratic plateau regression (Eqn (10), black line) are:
 $$\eqalign{{Y_{{\rm NFAC}}} = & \;0 {\cdot} 743\left( {P \lt 0 {\cdot} 001} \right) + 0 {\cdot} 480\left( {P \lt 0 {\cdot} 001} \right) \cr & \times x - 0 {\cdot} 205\left( {P \lt 0 {\cdot} 001} \right) \times {x^2} \cr {Y_{{\rm NNI}}} = & \;0 {\cdot} 260\left( {P \lt 0 {\cdot} 001} \right) + 1 {\cdot} 394\left( {P \lt 0 {\cdot} 001} \right) \cr & \times x - 0 {\cdot} 630\left( {P \lt 0 {\cdot} 001} \right) \times {x^2} \cr {Y_{{\rm SLNI}}} = & - 0 {\cdot} 197\left( {P \lt 0 {\cdot} 1} \right) + 2 {\cdot} 800\left( {P \lt 0 {\cdot} 001} \right){\rm} \cr &\times x - 1 {\cdot} 600\left( {P \lt 0 {\cdot} 001} \right){\rm} \times {x^2}} $$

The relationship between rLUE and index was weak for NFAC, but similar for NNI and SLNI. The MAE was highest for NFAC (MAE = 0·073), followed by SLNI (MAE = 0·0535) and NNI (MAE = 0·0498). The coefficient of determination was highest for SLNI (R 2 = 0·74), followed by NNI (R 2 = 0·73) and NFAC (R 2 = 0·40). The regression for NNI and SLNI showed an intercept near zero (0·26; −0·20), while the intercept of the NFAC regression was at 0·74. Most observations with index values <1 are above the 1 : 1 line, suggesting a non-linear relationship.
DISCUSSION
Method
In crop simulators, Beer's law is being used extensively to estimate the amount of light intercepted by a plant at the canopy level (Ritchie & Otter Reference Ritchie, Otter and Willis1985; Porter Reference Porter1993; Keating et al. Reference Keating, Carberry, Hammer, Probert, Robertson, Holzworth, Huth, Hargreaves, Meinke, Hochman, McLean, Verburg, Snow, Dimes, Silburn, Wang, Brown, Bristow, Asseng, Chapman, McCown, Freebairn and Smith2003). In the present study, the extinction coefficient was assumed as 0·7, which is a common value for wheat (Bertheloot et al. Reference Bertheloot, Andrieu, Fournier and Martre2008). According to Archontoulis et al. (Reference Archontoulis, Vos, Yin, Bastiaans, Danalatos and Struik2011), an average extinction coefficient value is justified, as long as intense drought stress can be excluded.
The parameterization of crop models can be influenced by compensating errors (Heuvelink Reference Heuvelink1999), especially if the data used are at a higher system level than the process for which parameters are adopted. It therefore seems advisable to parameterize and compare different algorithms independently from the uncertainties of the dynamic crop model they are dedicated for (Ratjen et al. Reference Ratjen, Böttcher and Kage2012). The approach presented in the present paper meets this aim: logistic growth curves were used for interpolation of DMshoot and GAI, while cumulative PAR was interpolated with a quadratic function. For the LUE calculation the first derivative (slope) of the interpolations for cumulative intercepted PAR and DMshoot was used instead of using the increase in dry matter and PAR accumulation between two sampling dates. This method provides two benefits: (i) the calculated LUE corresponds to the measurement day at which the explanatory indicator was measured, instead of an average growth rate between two sampling dates; and (ii) the influence of measurement errors is damped, because the growth curve is influenced by multiple data points and is therefore more robust and consistent compared with the difference between two subsequent measurements. The data from 2004 were used to illustrate the method, simply because it was the first year of the data set. The relationship between rLUE and indicators (NNI, SLNI) shows the same characteristic as in Fig. 4, where all 4 years were pooled. The consistency between years and treatments points towards the general value of the method.
The plateau of rLUE is close to one, which indicates that the treatments assumed to be at optimum N fertilization are indeed supplied optimally. For NNI the plateau of rLUE was reached at almost one (0·95), while for SLNI the maximum LUE was achieved at 0·87. This difference originates from the differences in definitions: the underlying critical N concentration of NNI was defined as the minimum concentration to achieve maximum growth (Justes et al. Reference Justes, Mary, Meynard, Machet and Thelier-Huche1994). In contrast, SLNmax was defined as the maximum SLN that can be expected for a specific GAI level. The observed response of LUE on N supply is in accordance with the results of Green (Reference Green1987), who observed that conversion efficiency of absorbed radiation into biomass is positively correlated with N supply for wheat. Regarding the rLUE v. NNI plot, the resulting non-linear regression line is very similar to that observed by van Delden (Reference Van Delden2001) for potato under varying organic N supply. In contrast to the results for potato, van Delden found no significant impact of NNI on LUE for wheat. Regarding averages of treatments, the NNI observed for wheat never fell below 0·64, even for low-fertilized treatments, within van Delden's data set. Compared with those results, the current data set showed a larger variation in NNI and LUE: the LUE ranged between 1·41 and 3·24, while NNI varied between 0·35 and 1·37. Similarly to the results that van Delden found for potato, the impact of NNI on LUE was poor until NNI fell below 0·65. Thus, it is very likely that the N deficit within van Delden's data was too weak to reveal any significant impact of NNI on LUE for wheat.
Both GAI and DMshoot were maximized at the highest N levels, whereas LUE was highest with lower N rates in most cases. The current results, therefore, are in agreement with those of van Delden (Reference Van Delden2001), who found that N shortage affected leaf area development and light interception early, while LUE stayed stable under moderate N shortage (Gastal & Belanger Reference Gastal and Belanger1993).
For treatments with high N supply, the observed mean LUE was slightly above the results of van Delden (Reference Van Delden2001), but in accordance with Fischer (Reference Fischer1983) who reported an average LUE of 3 g/MJ intercepted PAR for cereals. Since van Delden worked with organic N sources, the differences may be attributed to the fact that mineral N supply from organic N sources is sometimes limited. This is also evident by the relatively low NNI van Delden (Reference Van Delden2001) observed at high fertilized treatments (0·79–0·89).
The effective LUE is influenced by many factors such as temperature, intensity of solar radiation, fraction of diffuse light, drought stress and nutritional status. It is therefore not a function of NNI only. The occurrence of drought and LUE limiting temperatures is low at the experimental site used in the present study, with climate influenced by the North and Baltic seas (see earlier). The period analysed was up to grain filling (see Table 1), while drought stress usually increases during summer. Thus, the LUE in the current data is less affected by drought compared with what the average LUE over the whole vegetative period would have been.
The expected absolute LUE is also influenced by scaling issues: experimental plots usually don't have tramlines or headlands, while the occurrence of diseases, pests and weed abundance is reduced compared with the field scale. The potential biomass accumulation and resulting grain yields are therefore usually higher in experimental plots compared with the field or regional scale (Ratjen & Kage Reference Ratjen and Kage2015). Crop simulators, therefore often operate with reduced LUE values if adjusted to the yield observations of a specific field, or to aggregated yield observations on a regional scale. However, the present paper is about indicators for crop N status and their suitability as explanatory variables for rLUE reduction. The rLUE was obtained by comparison of absolute LUE values at the same environment and time. This is why the year-specific impact of weather on rLUE is not significant.
The SLNmax parameterization was based on the current data, while the critical N concentration used for the NFAC and NNI calculation were taken from literature. The SLNmax accounts for the impact of GAI on SLN under sufficient N supply, but in contrast to the critical N concentration of the other two approaches, the SLNmax parameterization has no direct link to LUE or rLUE. Thus, the SLNmax parameterization should not distort the comparison. On the other hand, SLN as a composite value is more affected by measurement errors. Thus, the fact that the observed performance of SLNI was similar to NNI may indicate stronger functional correlation between SLNI and rLUE. Across years and bread wheat cultivars, SLNI showed a great explanatory power on rLUE. This indicates that SLNmax, as defined in the present study, has a general value at least for modern European bread wheat cultivars.
Does the critical nitrogen concentration correspond to specific development stages?
Dilution curves were not adapted to the current data. Instead, the functions from CERES-Wheat and from Justes et al. (Reference Justes, Mary, Meynard, Machet and Thelier-Huche1994) were used to calculate Ncrit and derived LUE reduction factors (NFAC, NNI). However, the good explanatory power of NNI indicates that Ncrit as defined by Justes et al. (Reference Justes, Mary, Meynard, Machet and Thelier-Huche1994) matches the bread wheat cultivars of the current data set.
Some crop simulators use phenological development as a reference variable for the calculation of critical N concentration, thus LUE reduction factors, as discussed. In CERES-Wheat (Ritchie & Otter Reference Ritchie, Otter and Willis1985) a defined critical N concentration dependent on developmental stages is calculated for the shoot, while in APSIM development-based critical concentrations are defined on the organ scale (Zhao et al. Reference Zhao, Wang, Wang, Zang, Liu and Angus2014). The present paper tested the development-based NFAC reduction factor from the CERES-Wheat model. Within CERES-Wheat, NFAC is the LUE reduction factor for N limitation, thus identical to rLUE. This is not in accordance with the observations of the present work. The measured LUE is hardly affected by NFAC, evidenced by the fact that most rLUE observations are above the 1 : 1 line. Moreover, the correlation between NFAC and rLUE is poor compared with NNI and SLNI.
A recent study (Zhao et al. Reference Zhao, Wang, Wang, Zang, Liu and Angus2014) claims that the biomass N dilution curves for Ncrit change with genotype and across regions and a stage-dependent relationship tends to unify these curves. There is an apparent contradiction between the poor explanatory power of NFAC and the stage-dependent relationship of Ncrit found by Zhao et al. (Reference Zhao, Wang, Wang, Zang, Liu and Angus2014). However, Zhao et al. (Reference Zhao, Wang, Wang, Zang, Liu and Angus2014) used different methods to derive the critical N concentrations for wheat: Ncrit was defined by data from selected treatments of the experiments where the N rates were considered to be optimal, i.e. below which reduction in either biomass at the time of measurement or final grain yield occurred (Zhao et al. Reference Zhao, Wang, Wang, Zang, Liu and Angus2014). If Ncrit is defined by the shoot N concentration of treatment with maximum yield, there is a risk that Ncrit is overestimated, especially after N applications since higher amounts of unreduced N can occur in plant tissue (Justes et al. Reference Justes, Mary, Meynard, Machet and Thelier-Huche1994). In contrast, Ncrit as defined by Justes et al. (Reference Justes, Mary, Meynard, Machet and Thelier-Huche1994) is the minimum N concentration observed at a given date among all N treatments that produce the maximum amount of dry matter up to that date. Zhao et al. (Reference Zhao, Wang, Wang, Zang, Liu and Angus2014) pooled Ncrit values derived from alternative methods with the data published by Justes et al. (Reference Justes, Mary, Meynard, Machet and Thelier-Huche1994). Feekes stages (Large Reference Large1954) were recorded and transferred into a Decimal Code (Zadoks et al. Reference Zadoks, Chang and Konzak1974); afterwards a high correlation between Ncrit and DC was found. In our view, analysing the impact of development on Ncrit, by pooling different methods for Ncrit derivations as Zhao et al. (Reference Zhao, Wang, Wang, Zang, Liu and Angus2014) did, is problematic.
Biomass accumulation and therefore N dilution are dominated by radiation, at least in the absence of growth-limiting stress, while phenological development is driven by temperature and day length (Johnen et al. Reference Johnen, Boettcher and Kage2012). However, temporal and spatial growth conditions are variable not only in terms of N availability but also due to other factors. In this regard, biomass-based critical N concentrations (and indicators) have a close link to plant density and the resulting impact on mutual shading. This in turn has an impact on specific leaf area (Ratjen & Kage Reference Ratjen and Kage2013) and leaf N concentration (Mae et al. Reference Mae, Thomas, Gay, Makino and Hidema1993). However, since under normal growth conditions each biomass level corresponds to a relatively restricted range of stages, it is partly true that development can be an indicator for shoot biomass (Justes et al. Reference Justes, Mary, Meynard, Machet and Thelier-Huche1994). This may explain why fairly good correlation between development stages and critical N concentration was found for some data sets.
Within the current data, year-specific variability in DMshoot is particularly obvious between 2004 and 2006. If Ncrit is calculated as a function of biomass, the dilution law causes a variability of Ncrit for the same development stage. Regarding treatments at the three node stage (BBCH 33), with N supply ≧240 kg N/ha, Ncrit is 2·5 and 3·0% in 2004 and 2006, respectively. According to the dilution law, a comparatively low cN will result in flowering, if growth during the vegetative stage is boosted by particularly favourable weather conditions. However, a stage-driven critical N concentration would detect N deficit, while an index with a biomass-based critical N concentration would not. Such tendencies can also be found in the current data: in 2004 at the 320 kg N/ha level very high averages for DMshoot, LUE and GAI were found. A comparatively high N status is indicated by NNI (1·37), but the corresponding NFAC is lower (0·92; not shown).
It can therefore be concluded that the lower explanatory power of NFAC results from the fact that development stages alone are not suitable for the characterization of critical N concentrations.
Implications for crop modelling
Developmental-based indicators may work within some simulators, but there is no clear evidence for an underlying physiological relationship. For NFAC, the weakness in physiological cause is also indicated by the fact that different functions for critical N concentrations are needed for winter and summer wheat. The current data confirm that NNI correlates well with rLUE, thus biomass seems to be a more promising approach for calculation of critical shoot N concentration than development.
Although all cells in the green parts of wheat have chloroplasts, most of the photosynthetic activity takes places in leaves. Since the potential photosynthesis rate of leaf tissue is strongly affected by leaf N (Sinclair & Horie Reference Sinclair and Horie1989; Mae et al. Reference Mae, Thomas, Gay, Makino and Hidema1993), biomass-related critical N concentrations also account indirectly for leaf N status. Therefore, all the advantages that biomass-related critical N concentrations may have over development-related ones also apply for leaf-associated indicators.
However, if LUE reduction factors are targeted then leaf-related indicators may be preferable since, irrespective of the fact that NNI worked well with the current data, NNI does not differentiate between different organs. Recently, mechanistic approaches for N dynamics with respect to sink–source interaction between leaves and grains have become a focus for crop modelling (Bertheloot et al. Reference Bertheloot, Andrieu, Fournier and Martre2008). Thus, at least during the generative phase where N translocation from leaves to the grains takes place, an indicator related to leaf N has the potential to improve the simulation of dry matter production.
This work was funded by the ‘Deutsche Bundesstiftung Umwelt’ (DBU). We are grateful to the unknown reviewer for their critical editorial remarks.