Introduction
Within temperate regions, climatic conditions allow perennial ryegrass (Lolium perenne L., PRG) swards to produce large quantities of high quality, digestible feed at a low cost relative to alternative feedstuffs (Finneran et al., Reference Finneran, Crosson, O'Kiely, Shalloo, Forristal and Wallace2012). Intensive grass-based production systems, such as those operated in Ireland and New Zealand, aim to incorporate large quantities of grazed pasture in the diet of dairy cows (Horan and Roche, Reference Horan and Roche2020). This differs fundamentally from those milk-producing nations where cows are housed indoors and forage is delivered to the animals either fresh or conserved (O'Donovan et al., Reference O'Donovan, Hennessy and Creighton2018). Such high utilization of grazed pasture gives grazing-based systems a competitive advantage over confined systems, as they operate at a lower cost base leading to increased profitability (Dillon et al., Reference Dillon, Roche, Shalloo and Horan2005) and less vulnerability to the market fluctuations (Macdonald et al., Reference Macdonald, Penno, Lancaster and Roche2008).
Maximizing the amount of grass utilized on the farm is key to optimizing profit in grazing-based enterprises (Ramsbottom et al., Reference Ramsbottom, Horan, Berry and Roche2015). Utilization is a function of herbage grown and grazing management employed (Hanrahan et al., Reference Hanrahan, McHugh, Hennessy, Moran, Kearney, Wallace and Shalloo2018). Perennial ryegrass variety selection when reseeding can have a large effect on both parameters. Perennial ryegrass varieties exhibit specific traits that confer different strengths and weaknesses to swards (O'Donovan et al., Reference O'Donovan, McHugh, McEvoy, Grogan and Shalloo2016). Since the start of the 20th century, plant breeders have focused on improving herbage yields as this has been the main selection criteria used by farmers when selecting new varieties to sow. It is estimated that over the last 40 years, average herbage yields have increased by 0.35% per annum under simulated grazing (Sampoux et al., Reference Sampoux, Baudouin, Bayle, Béguier, Bourdon, Chosson, Deneufbourg, Galbrun, Ghesquière and Noël2011; McDonagh et al., Reference McDonagh, O'Donovan, McEvoy and Gilliland2016). Regular reseeding using superior varieties allows for increased amounts of herbage to be grown but in the absence of a simple means of assessing grazing potential, extra grass may not always translate into an equivalent improvement in utilization. Varietal traits are known to influence utilization of herbage on farm (Byrne et al., Reference Byrne, Gilliland, Delaby, Cummins and O'Donovan2018). These traits influence plant structure and chemical composition which in turn affect the foraging behaviour of ruminants and digestion within the rumen (Forbes, Reference Forbes1988). Grazing efficiency is defined as the proportion of herbage ingested by grazing animals relative to that presented (Tubritt et al., Reference Tubritt, Delaby, Gilliland and O'Donovan2020) and is used to describe how suitable a variety is for grazing. Varieties of high-grazing efficiency can be consistently grazed to low post-grazing sward heights whereas varieties of poorer grazing efficiency are more difficult to graze out, leaving a residual of unutilized herbage. McCarthy et al. (Reference McCarthy, Pierce, Delaby, Brennan, Fleming and Horan2013) identified that grazing to low post-grazing sward heights (≤4 cm) optimizes the amount of herbage utilized and conditions the sward to produce increased proportions of leaf in subsequent rotations (Tuñon et al., Reference Tuñon, Kennedy, Horan, Hennessy, Lopez-Villalobos, Kemp, Brennan and O'Donovan2014). Laxly grazed swards incur negative carry-over effects, such as increased proportions of the stem, sheath and dead leaf with a corresponding reduction in leaf proportion (Mayne et al., Reference Mayne, Newberry, Woodcock and Wilkins1987). These morphological changes frequently lead to poor graze-outs (i.e. high post-grazing sward heights) in subsequent rotations (Hunt and Brougham, Reference Hunt and Brougham1967). Farmers, recognizing the differences in grazing efficiency between varieties, now demand varieties with optimum grazing traits. The workload and cost of assessing large numbers of varieties under animal grazing are prohibitively high and so there is a need to devise a more streamlined method of assessing grazing efficiency that ryegrass breeders and evaluators could adopt in small plot trialling systems.
Breeding for increased grazing efficiency has predominantly focused on traits linked to increasing voluntary feed intake (VFI). Reducing lignin and improving cell wall digestibility within forages can increase VFI and milk yield of dairy cows (Jung and Allen, Reference Jung and Allen1995; Oba and Allen, Reference Oba and Allen1999). As the different tissue fractions of PRG are not digestible in equal measure (Beecher et al., Reference Beecher, Hennessy, Boland, McEvoy, O'Donovan and Lewis2015), producing varieties with greater amounts of highly nutritious proportions (e.g. leaf) at the expense of others is a worthwhile grazing efficiency breeding goal. Sward structural traits, such as reduced sheath height (Wims et al., Reference Wims, McEvoy, Delaby, Boland and O'Donovan2013), have been shown to strongly influence bite mass and rate, which in turn affects VFI. Studying the relationship between sward structural traits and grazing behaviour could provide important additional proxy measures of grazing efficiency differences between varieties.
Most previous studies in the area of grazing efficiency have involved in vitro experiments or did not evaluate animal foraging activity. The objective of this study was to identify morphological and nutritive quality traits that could be used for initial germplasm selection and subsequent variety of assessment traits for improved PRG grazing efficiency. The hypothesis was that there are measurable trait differences between perennial ryegrass varieties that may become proxy metrics for grazing efficiency and that these could be adopted by plant breeders and evaluators to develop and promote new, high-grazing efficiency varieties.
Materials and methods
Experimental design
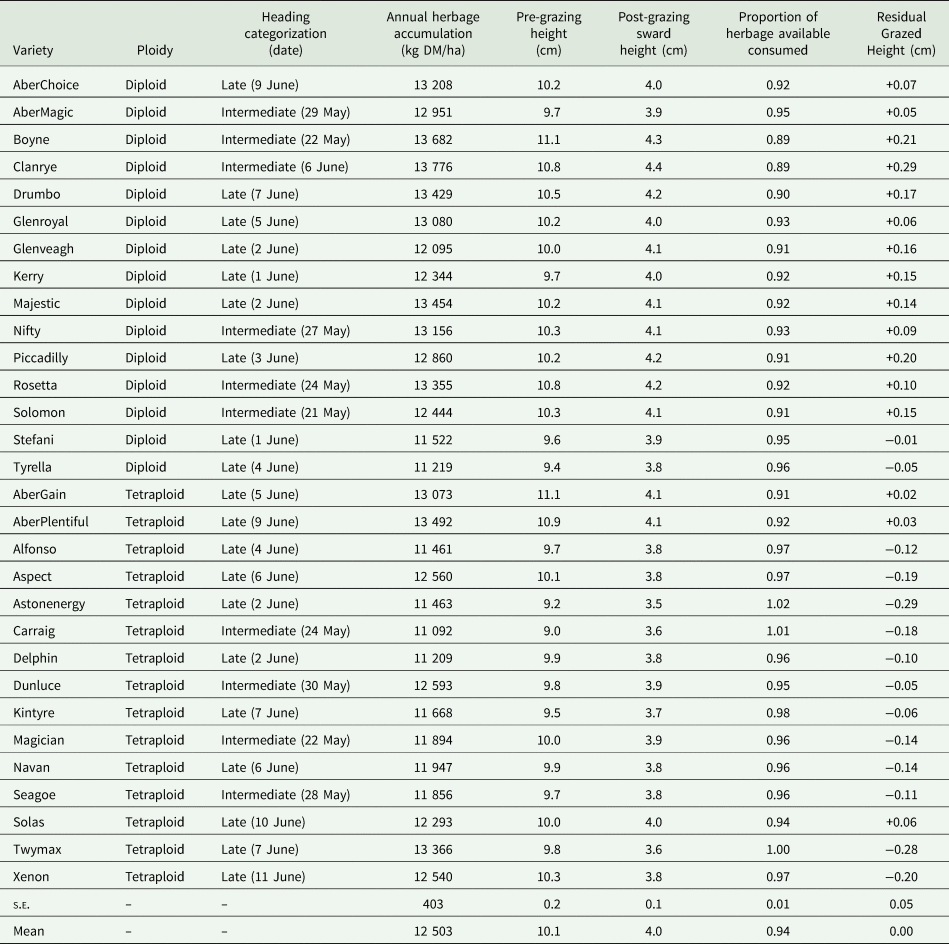
The study was conducted as part of a wider study developing a methodology for the routine assessment of grazing efficiency differences between perennial ryegrass varieties. Tubritt et al. (Reference Tubritt, Delaby, Gilliland and O'Donovan2020) described the 2-year results of this assessment. The objective of the current study was to assess how varietal traits influenced the grazing efficiency of perennial ryegrass varieties. An additional experimental year was conducted and is described in the current paper (3 years of data). The study was conducted at Teagasc, Animal & Grassland Research and Innovation Centre, Moorepark, Fermoy, Co. Cork, Ireland (lat. 50°07′N, long. 08°16′W, 40 m asl). Soil type was a free-draining acid brown earth soil of sandy loam texture as described in Tubritt et al. (Reference Tubritt, Delaby, Gilliland and O'Donovan2020). In contrast to Tubritt et al. (Reference Tubritt, Delaby, Gilliland and O'Donovan2020), an additional year of data recording was conducted, although minimal re-ranking of varieties was recorded for all traits common to both studies. In addition, nutritive quality and morphological traits were assessed in the current study. The experiment took place over three grazing seasons, 2017, 2018 and 2019. Thirty varieties of PRG (Table 1) from the Republic of Ireland's 2016 National/Recommended List were sown in a randomized complete block design in three replicates (90 plots, each 8 m × 4.5 m). Soil preparation and sowing of varieties are described in Tubritt et al. (Reference Tubritt, Delaby, Gilliland and O'Donovan2020).
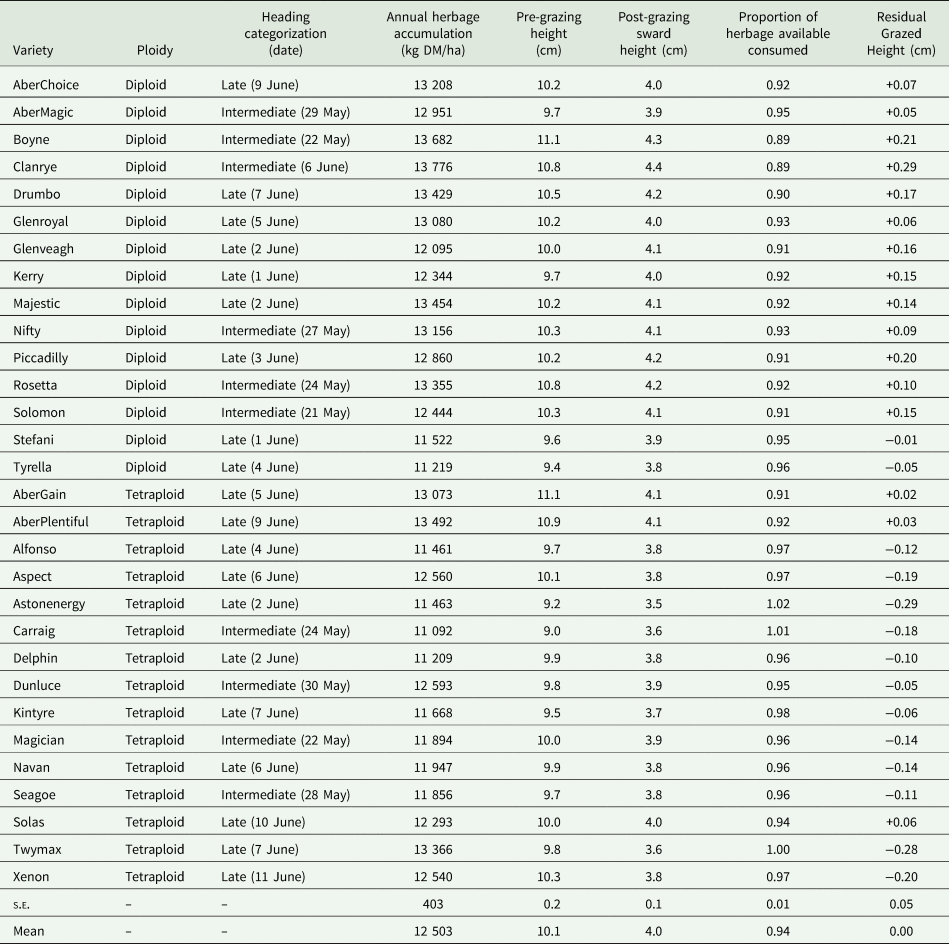
Grass varieties examined and their ploidy, heading categorization/dates and 3-year mean production and grazing efficiency values (2017–2019)
Grazing management
Full details of grazing management and measurement of varietal traits have been previously described in Tubritt et al. (Reference Tubritt, Delaby, Gilliland and O'Donovan2020). Briefly, plots were rotationally grazed by block, when the average herbage mass across all plots was visually estimated to be 1400 kg/ha of dry matter (DM) above cutting height (3.5 cm), as described by O'Donovan et al. (Reference O'Donovan, Connolly, Dillon, Rath and Stakelum2002). Cows remained within their allocation until the average post-grazing sward height across the allocated area was 4 cm (visually assessed). On average, 60 spring calving cows grazed the plots throughout the year. Dung pats were manually removed after each grazing and fertilizer was applied to the plots post-grazing. Annual fertilizer application rates were 310 kg N/ha, 30 kg P/ha, 40 kg P/ha and 20 kgS/ha.
Production measurements
Pre-grazing herbage yield was determined by cutting a subsection (1.2 m × 5 m) of each plot with an Etesia motor harvester (Etesia Hydro 124D; Etesia UK Ltd, Warwick, UK) to a height of 3.5 cm. The cut area was rotated for each grazing across three non-overlapping areas of each plot. Mown herbage (fresh) was weighed and a 0.1 kg sample dried at 90°C for 16 h to determine DM content. Pre-grazing sward height was measured ten times on each plot using a Jenquip rising plate meter (Jenquip Rising Plate Pasture Metres, New Zealand; diameter 355 mm and 3.2 kg/m2) and post-grazing sward height was measured in the same manner (Castle, Reference Castle1976). Post-grazing sward height was not recorded from the cut area. Height consumed (1), herbage density (2) and proportion of available herbage consumed (measure of grazing efficiency; (3)) were calculated as
1. Height consumed = pre-grazing sward height − post-grazing sward height.
2. Herbage density = pre-grazing herbage mass/pre-grazing sward height − 3.5 cm (cut height) (Tuñon et al., Reference Tuñon, Kennedy, Horan, Hennessy, Lopez-Villalobos, Kemp, Brennan and O'Donovan2014).
3. Proportion of available herbage consumed = height consumed/(pre-grazing sward height − 3.5 cm).
As varieties were grazed to different post-grazing sward heights, different amounts of un-grazed DM were carried into the following rotation. To avoid herbage accumulation being accounted in two rotations, the ungrazed DM within each plot from grazing event ‘n’, above 3.5 cm (cutting height), was subtracted from herbage mass of the same plot in grazing event ‘n + 1’, as measured by the Etesia cut (Delaby et al., Reference Delaby, Peyraud, Bouttier and Peccatte1998).
Nutritive quality measurements
At each grazing, a second sub-sample was taken from the mown herbage of each plot, freeze-dried at −50°C for 72 h, milled through a 0.1 mm sieve and scanned under near infra-red spectrometry. An equation derived from Burns et al. (Reference Burns, Gilliland, Grogan, Watson and O'Kiely2012) was used to measure neutral detergent cellulase digestibility (NDCD), crude protein (CP), acid detergent fibre (ADF), neutral detergent fibre (NDF) and ash (mineral) content. Organic matter digestibility (OMD) was derived from the equation: 0.540 × NDCD + 0.348, as developed by Garry et al. (Reference Garry, O'Donovan, Beecher, Delaby, Fleming, Baumont and Lewis2018).
Morphological measurements
Prior to each grazing (except for the first and last in each grazing season) 20 individual tillers were harvested at the ground level from each plot. Each tiller was measured for extended tiller height (ETH), length from base to highest leaf, and extended sheath height (ESH), length from base to highest leaf ligule. Free leaf lamina (FLL) was measured as ETH minus ESH (Gilliland et al., Reference Gilliland, Barrett, Mann, Agnew and Fearon2002). Each tiller was cut at 3.5 cm (cutting horizon) and divided into its relative leaf, pseudo-stem, true stem and dead proportions. These proportions were dried at 90°C for 16 h to measure each proportion on a DM basis.
Tiller density was determined once the paddock had been closed for the winter period in November in each year. Three 100 cm2 sods were obtained from each plot. The number of PRG tillers, weed grass tillers and dicotyledon species present was counted by a destructive analysis (Jewiss, Reference Jewiss1993). Ground scores of each plot were also measured during the closed winter period by visual assessment using a scale of 0–9 where, 0 = 0–0.1 PRG and 9 = 0.9–1.0 PRG (Camlin and Stewart, Reference Camlin and Stewart1976).
Statistical analysis
The statistical package SAS (SAS Inst. Inc., Cary, NC) was used for statistical analysis using the PROC MIXED procedure. Differences in pre-grazing sward height were shown to have a significant positive relationship (P < 0.001) with post-grazing sward height (R 2 = 0.72). Comparisons of the grazing efficiency of varieties based solely on post-grazing sward height would be biased towards varieties with lower pre-grazing sward heights. To accurately account for this anomaly and measure grazing efficiency, the following mixed model was created:

where Aijklmno is the observation, μ is the mean, Yi is the year effect (i = 1,…, 3), Pj is the ploidy effect (j = 1,…, 2), Bk is the block effect (k = 1,…, 3), Hl is the heading date effect (l = 1,…, 2), C(PH)mjl is the variety within (ploidy × heading date) effect (m = 1,…, 30), G(Y)ni is the rotation within (year) effect (n = 1,…, 11), PreGH is the pre-grazing sward height (Yi × Pj) = year × ploidy interaction, (Yi × Hl) is the year × heading date interaction, (Pj × Hl) is the ploidy × heading date interaction, (Gn × Pj) is the rotation (within year) × ploidy interaction, (Gn × Hl) is the rotation (within year) × heading date interaction and eijklmno is the residual error term.
This model was used to predict the post-grazing sward height of each variety. This was then subtracted from the actual post-grazing sward height achieved on the plot. The resulting figure is termed the ‘residual grazed height’ (RGH). Negative values for RGH are indicative of increased grazing efficiency. Higher positive RGH values were indicative of poorer grazing efficiency.
Another PROC MIXED procedure was used to analyse differences between varieties, ploidy and heading date for the dependent variables: pre-grazing herbage mass, pre-grazing sward height, post-grazing sward height, proportion of available herbage consumed, RGH, OMD, CP, ADF, NDF, ash, leaf proportion, pseudo-stem proportion, true stem proportion, dead leaf proportion, ETH, ESH, FLL, tiller density and ground score. Block was used as a random variable in the model. The equation used for the model was identical to the first model above with the omission of pre-grazing sward height as a covariate.
Following this, a PROC GLM procedure was conducted to examine the relationship between RGH and each of the dependent variables previously examined in the MIXED model. Varietal heading categorization did not show significant differences, therefore, the analysis was conducted between ploidy groups. The model used was

where RGH is the residual grazing height, Yi is the year effect (i = 1,…, 3), Pj is the ploidy effect (j = 1,…, 2) and Xij is the trait effect.
In addition, multiple regression analysis of RGH upon the other variables was carried out using the forward model-selection method of the stepwise procedure of SAS. The aim of the multiple regression analysis was to identify the most important variables responsible for variation in RGH to identify the strongest combination of plant traits that breeders could select for increased grazing efficiency.
Results
Meteorological
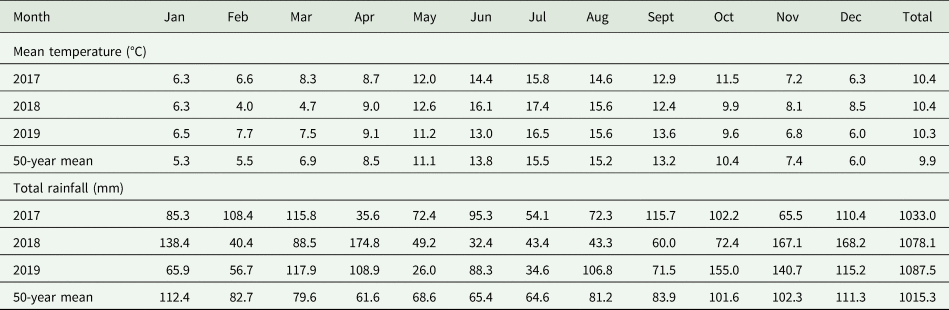
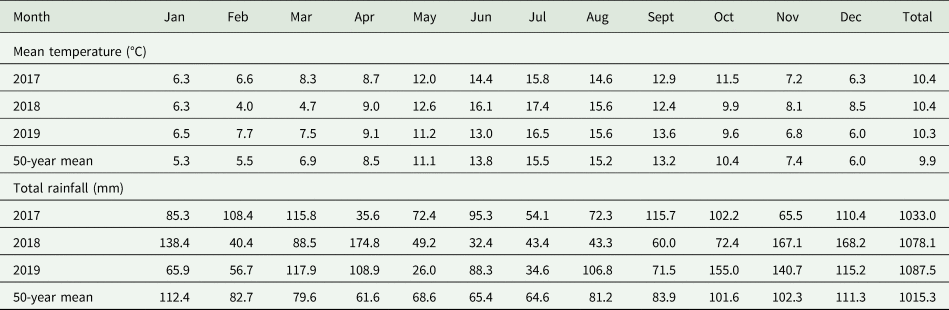
Rainfall and temperature results experienced during the first 2 years of assessment have been described in Tubritt et al. (Reference Tubritt, Delaby, Gilliland and O'Donovan2020). Table 2 displays the monthly rainfall and temperatures experienced during the 3 years of experimentation. Reduced levels of rainfall during the summer of 2018 resulted in reduced grass growth potential, lowering annual DM yield. Weather conditions in 2019 were closer to the average climate and resulted in a typical grass growing season.
Meteorological data recorded at Teagasc Moorepark (Fermoy, Co. Cork, Ireland)
Production traits
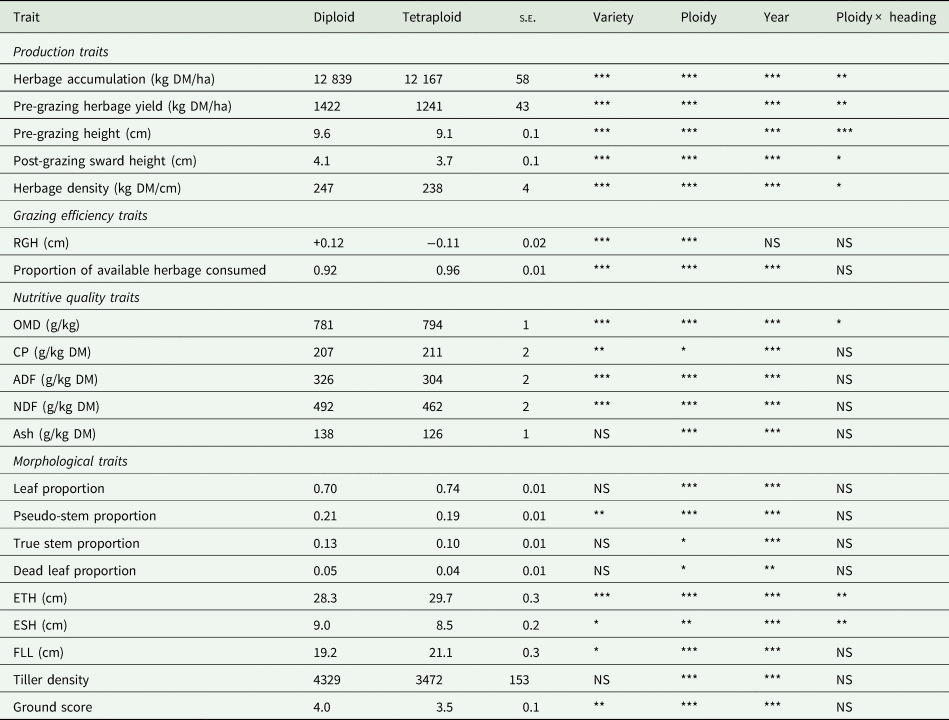
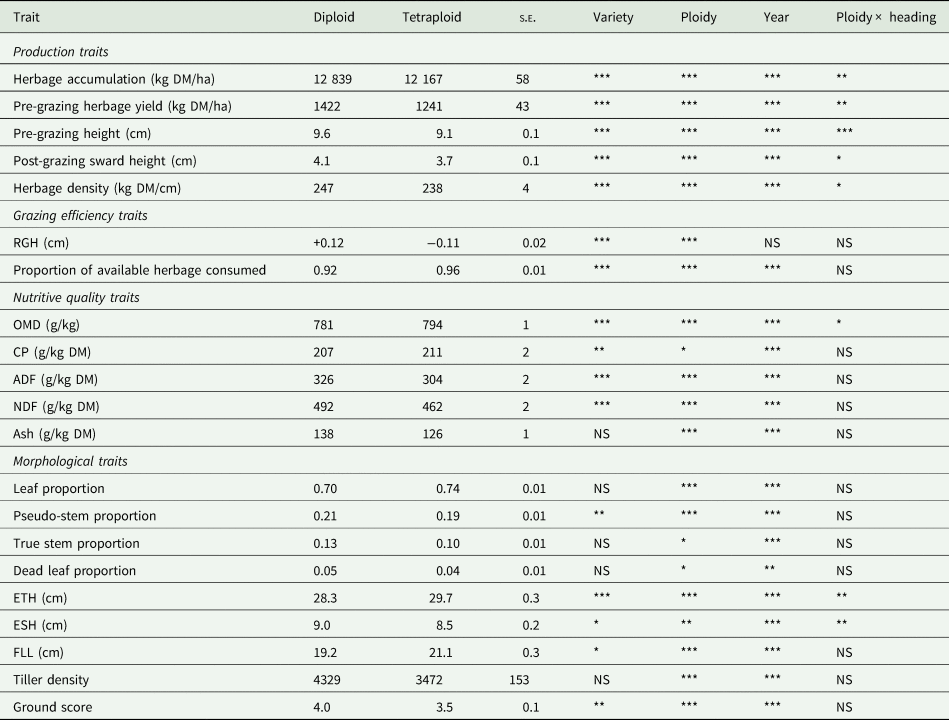
There were significant differences in annual herbage accumulation between varieties, ploidy and years (P < 0.001), but no significant differences between heading dates (Table 3). This was despite a significant (P < 0.01) ploidy × heading date interaction, as some varieties did not perform true to their type. Mean herbage accumulation was 14 173 kg DM/ha in 2017, 10318 kg DM/ha in 2018 and 14987 kg DM/ha in 2019. Clanrye had the highest mean herbage accumulation of all varieties (13 776 kg DM/ha) whilst Carraig had the lowest (11 092 kg DM/ha) (Table 1). Higher herbage accumulation was recorded for diploids (12 839 kg DM/ha) than tetraploids (−672 kg DM/ha) (Table 3). The difference between late and intermediate varieties was 9 kg DM/ha (12 497 kg DM/ha v. 12 488 kg DM/ha, respectively). Intermediate diploids yielded 13 118 kg DM/ha whilst intermediate tetraploids yielded 11 859 kg DM/ha (+1259 kg DM/ha). Late diploids recorded a mean herbage accumulation of 12 699 kg DM/ha which was 404 kg DM/ha greater than late tetraploids.
Performance of varieties grouped by ploidy for the various DM production, grazing efficiency, morphological and biological traits examined and the statistical differences between varieties, ploidy, years and ploidy × heading date interactions (heading date insignificant for all traits except for ESH)
Levels of significance: NS = P > 0.05; * = P < 0.05; ** = P < 0.01; *** = P < 0.001.
The mean pre-grazing herbage yield for all years and rotations was 1332 kg DM/ha (Table 1). Pre-grazing herbage yield differed significantly between variety, ploidy and year (P < 0.001), but not between heading dates. There was a significant (P < 0.01) ploidy × heading date interaction where individual variety variations departed from the overall pattern of diploids having greater pre-grazing herbage yields than tetraploids at 1422 and 1241 kg DM/ha, respectively. Intermediate and late diploids had greater pre-grazing herbage yields than intermediate and late tetraploids, with values of 1453, 1390, 1217 and 1264 kg DM/ha, respectively. Mean pre-grazing herbage yields for 2017, 2018 and 2019 were 1400, 1116 and 1478 kg DM/ha, respectively.
Mean varietal pre-grazing sward height was 10.1 cm (Table 1). Pre-grazing sward height differed significantly between variety, ploidy and year (P < 0.001) and the interaction between ploidy and heading date was significant (P < 0.01), driven by underlying varietal variation. Varietal pre-grazing sward height ranged from 9.0 cm (Carraig) to 11.1 cm (Boyne and AberGain). Diploids had greater pre-grazing sward heights than tetraploids with average values of 9.6 and 9.1 cm, respectively. Late heading diploid and tetraploid varieties had pre-grazing sward heights of 9.4 and 9.3 cm, respectively, while a greater difference was observed between intermediate diploids and tetraploid varieties at 9.8 and 9.0 cm, respectively. Pre-grazing sward height in 2017 (10.6 cm) was greater than 2018 (8.2 cm) and 2019 (9.3 cm).
Significant differences were recorded in post-grazing sward height and again this was between varieties, ploidy and years (P < 0.001) but not heading date. The significant (P < 0.01) ploidy × heading date interaction was repeated and again driven by varietal variation. There was a 0.9 cm difference between varieties for mean post-grazing sward height (Clanrye 4.4 cm and Astonenergy 3.5 cm). Mean varietal post-grazing sward height was 4 cm. Mean post-grazing sward height for diploid and tetraploids was 4.1 and 3.7 cm, respectively (Table 3). Intermediate and late tetraploids did not differ significantly (3.7 and 3.8 cm, respectively; s.e. = 0.1) but intermediate and late diploids did (4.1 and 4.0 cm, respectively; s.e. = 0.05). Post-grazing sward height was highest in 2017 (4.2 cm), followed by 2018 (3.8 cm) and 2019 (3.7 cm).
The herbage density results were broadly similar to the previous traits as it was significantly affected by variety, ploidy and year comparisons (P < 0.001), and again the absence of differences between heading date was repeated with the ploidy × heading date interaction reoccurring (P < 0.05) and driven by the same underlying varietal variation. Majestic had the highest mean herbage density of all varieties at 268 kg DM/cm while Delphin had the lowest at 220 kg DM/cm. Overall diploids had higher herbage density than tetraploids (247 v. 238 kg DM/cm; Table 3) which was still apparent despite the underlying varietal variation causing some tetraploids to have a higher herbage density than some diploids. Intermediate and late heading groups differed by 8 kg DM/cm (242 v. 234 kg DM/ha, respectively) for tetraploids and by 5 kg DM/cm for diploids (245 and 250 kg DM/cm, respectively) but in the opposite rank order. Herbage density was lowest in 2017 (206 kg DM/cm) but did not differ significantly between 2018 and 2019 (260 and 262 kg DM/cm, respectively).
Chemical composition traits
The pattern of results showing significant (P < 0.001) differences between varieties, ploidy and years, but not between heading date and ploidy × heading date interactions was again recorded for CP, ADF and NDF. Ploidy × heading date interactions were significant for OMD.
For OMD, varietal differences ranged from 775 (Boyne) to 807 g/kg (Astonenergy). Mean varietal OMD was 788 g/kg. Tetraploids had significantly higher OMD content than diploids (794 v. 781 g/kg). OMD values for intermediate and late diploids and intermediate and late tetraploids were 779, 783, 794 and 793 g/kg, respectively. Mean OMD content rose significantly (P < 0.05) from 2017 to 2018 to 2019 with values of 769, 788 and 806 g/kg, respectively. The over-year mean OMD values for spring, summer and autumn were 788, 792 and 782 g/kg, respectively (P < 0.001). For ADF, varietal differences ranged from 293 g/kg DM (Astonenergy) to 339 g/kg DM (Boyne). Mean varietal ADF was 315 g/kg DM. Mean ADF for diploids was 22 g/kg DM higher than tetraploids (326 v. 304 g/kg DM; Table 3). Mean ADF content for 2017, 2018 and 2019 was 340, 313 and 293 g/kg DM. The mean varietal NDF content was 477 g/kg DM, which ranged from 442 g/kg DM (Astonenergy) to 514 g/kg DM (Boyne). The NDF content of diploids was greater than tetraploids with values of 492 and 463, respectively. The mean NDF content for 2017, 2018 and 2019 was 463, 487 and 482 g/kg DM, respectively.
When CP was examined, the same rankings as before were observed, though at different levels of significance (variety P < 0.01; ploidy P < 0.05; year P < 0.001), with still no differences associated with heading date and the ploidy × heading date interaction. Mean varietal CP was 209 g/kg DM, with Abermagic (196 g/kg DM) the lowest and Delphin (222 g/kg DM) the highest of all varieties. Tetraploids had a mean CP content of 211 g/kg DM, which was 4 units higher than diploids at 207 g/kg DM and the annual differences were 248, 188 and 191 g/kg DM for 2017, 2018 and 2019, respectively.
Ash content differed significantly between ploidy and years (P < 0.001) but not between varieties or heading date and there was no ploidy × heading date interaction. Diploid mean ash values were 12 g/kg DM greater than tetraploids (138 v. 126 g/kg DM) and the annual differences for 2017, 2018 and 2019 were 139, 145 and 111 g/kg DM, respectively.
Morphology traits
When the morphological traits were examined, the pattern of differences observed in the production and chemical composition traits were not as consistently repeated as before (Table 3). While there were significant differences between ploidy groups and between years in all nine morphological characters, only two produced significant ploidy × heading date interactions (ETH and ESH). This occurred due to differential variety of responses between these two factors. While there were significant differences between varieties in pseudo-stem proportion, ETH, ESH, FLL and ground-score, no significant varietal differences were found in leaf proportion, true stem proportion or tiller density.
The magnitude of the notable values recorded across these parameters was as follows. The mean proportion of leaf for diploids at 0.70 was 0.04 less than tetraploids. Leaf proportion increased from 2017 to 2018 to 2019 with values of 0.65, 0.71 and 0.80, respectively, with a significant seasonal (P < 0.001) difference of the highest in spring followed by summer and then autumn at 0.80, 0.70 and 0.65, respectively. For pseudo-stem proportion, Boyne (0.23) was the highest and Astonenergy (0.15) lowest around a variety mean of 0.19, with the diploid group 0.02 higher than the tetraploids (0.21 v. 0.19, respectively). The annual differences for 2017, 2018 and 2019 were 0.25, 0.16, and 0.17, respectively, with pseudo-stem proportion rising from 0.13 in spring to 0.20 in summer and finally to 0.26 in autumn (P < 0.001). Diploid varieties had a higher true stem proportion than tetraploids (0.13 v. 0.10) and the annual differences were 0.25, 0.16 and 0.17 for 2017–2019, respectively. The proportion of dead material was slightly higher in diploids (0.05) than tetraploids (0.04) and the annual 2017–2019 differences were 0.05, 0.04 and 0.05, respectively, which when combined gave a seasonal pattern of 0.04 in spring, 0.06 in summer and 0.04 in autumn (P < 0.05). The mean varietal ETH ranged from 32.4 cm (AberPlentiful) to 26.6 cm (Glenveagh) with the diploids (at 28.3 cm) being 1.4 cm lower than tetraploids (at 29.7 cm) and with late varieties averaging 27.7 and intermediates 28.8 cm. The annual differences were 30.8, 27.1 and 29.0 cm for 2017, 2018 and 2019, respectively. Boyne had the highest ESH of 10.2 cm, with Aspect and Drumbo the lowest at 7.7 cm. Diploid ESH (9.0 cm) was 0.5 cm greater than tetraploid ESH, while the intermediate ESH (8.9 cm) was 0.4 cm lower than late (9.3 cm, P < 0.01). In 2017, the mean ESH was 9.8 cm, which was higher than 2018 (−1.4 cm) and 2019 (−1.9 cm). AberGain had the highest FLL at 22.9 cm while Kerry and Stefani had the lowest (18.0 cm). The tetraploids (21.1 cm) were 1.9 cm greater than diploids. However, this was not consistently maintained within maturity groups as the intermediate and late diploids had FLL values of 19.6 and 18.9 cm and the intermediate and late tetraploids 20.8 and 21.4 cm, respectively. The annual differences were 20.9 cm in 2017, 18.6 cm in 2018 and 21.0 cm in 2019. The mean diploid tiller density was greater than tetraploid tiller density (4329 v. 3472 tillers/m2) and varied between years by 1294 tillers/m2 (2017: 4087 tillers/m2; 2018: 4455 tillers/m2; 2019: 3161 tillers/m2). AberGain had the greatest mean ground-score of all varieties examined (4.8) while Astonenergy had the lowest at 3.3. The diploids averaged 4.0, which was 0.5 unit greater than the tetraploids (3.5), and this was consistent within maturity groups as the intermediate and late diploids had mean ground-scores of 4.2 and 4.1 and the intermediate and late tetraploids had scores of 3.5 and 3.9, respectively. Mean ground-score reduced from 2017 to 2019 with values of 4.1, 3.7 and 3.5 for the 3 years, respectively.
Grazing efficiency
Grazing efficiency was evaluated using RGH and proportion of available herbage consumed. It was found that RGH differed significantly (P < 0.001) between varieties and ploidy with no significant interactions with other traits. Variety RGH ranged from the lowest grazing efficient variety Clanrye at +0.29 to the most grazing efficient Astonenergy at −0.29 (Table 1). The tetraploids had a lower mean RGH than the diploids, with values of −0.11 and +0.12, respectively, indicating that tetraploids had greater grazing efficiency (Table 3). The proportion of available herbage consumed differed significantly between varieties, ploidy and year (P < 0.001), with no significant interactions with other traits. Astonenergy had the highest proportion of its available herbage consumed (1.02) while Clanrye and Boyne had the lowest (0.89). Similar to RGH, tetraploids had a higher proportion of available herbage consumed than diploids with mean values of 0.96 and 0.92, respectively.
Relationship of PRG traits to grazing efficiency
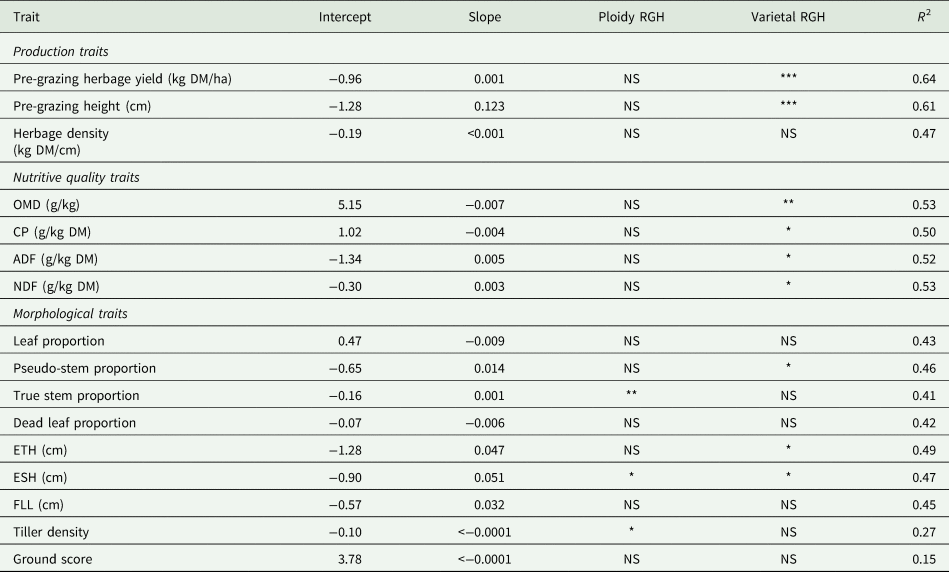
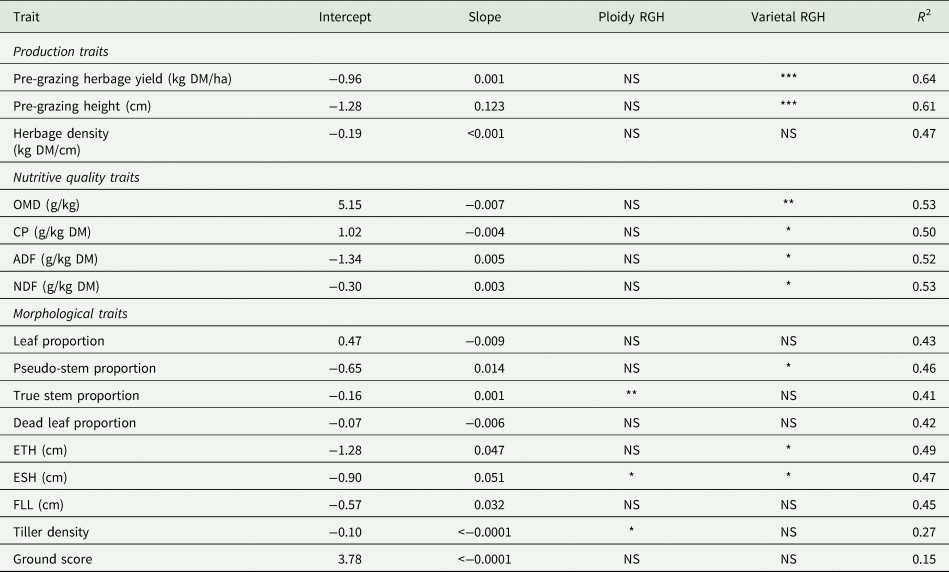
Table 4 displays the relationship between the measured traits and RGH. Ploidy differences for production and chemical composition traits had no effect on RGH (P > 0.05). Both pre-grazing herbage yield and pre-grazing sward height had a significant relationship with RGH (P < 0.001), with an increase of 0.001 RGH/kg DM increase in pre-grazing herbage yield and an increase of 0.123 RGH/cm increase in pre-grazing sward height.
Association between grass variety traits and RGH differences and comparison between ploidy groups
Levels of significance: NS = P > 0.05; * = P < 0.05; ** = P < 0.01; *** = P < 0.001.
OMD, organic matter digestibility; ADF, acid detergent fibre; NDF, neutral detergent fibre; ETH, extended tiller height; ESH, extended sheath height; FLL, free leaf lamina.
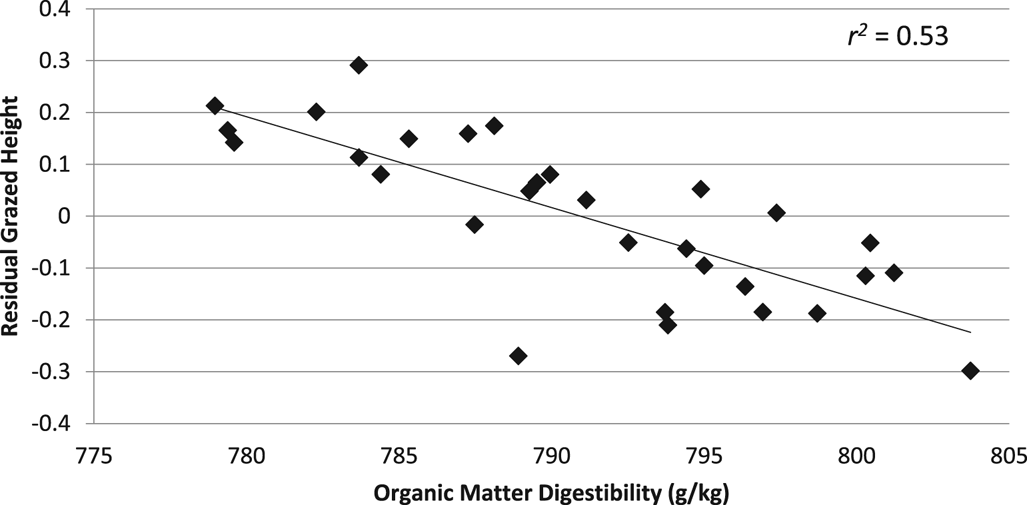
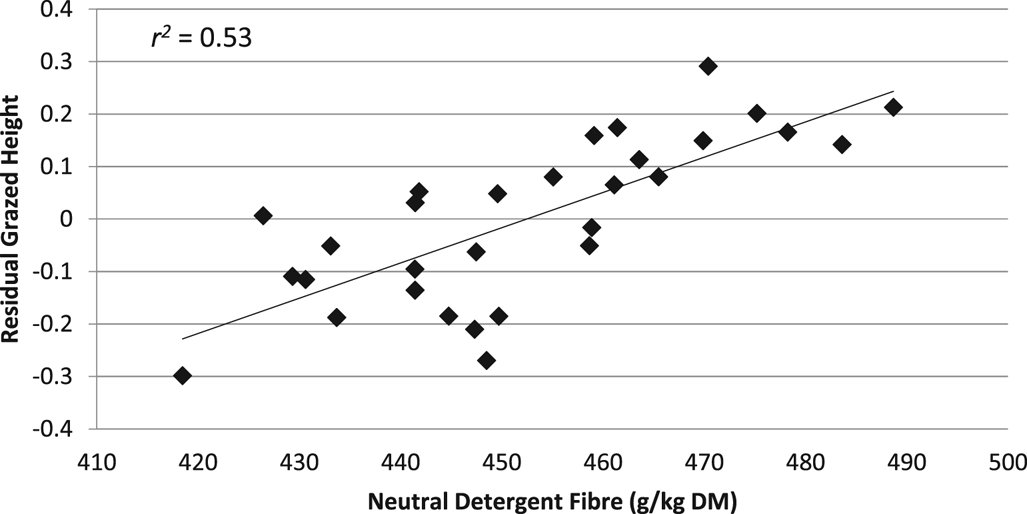
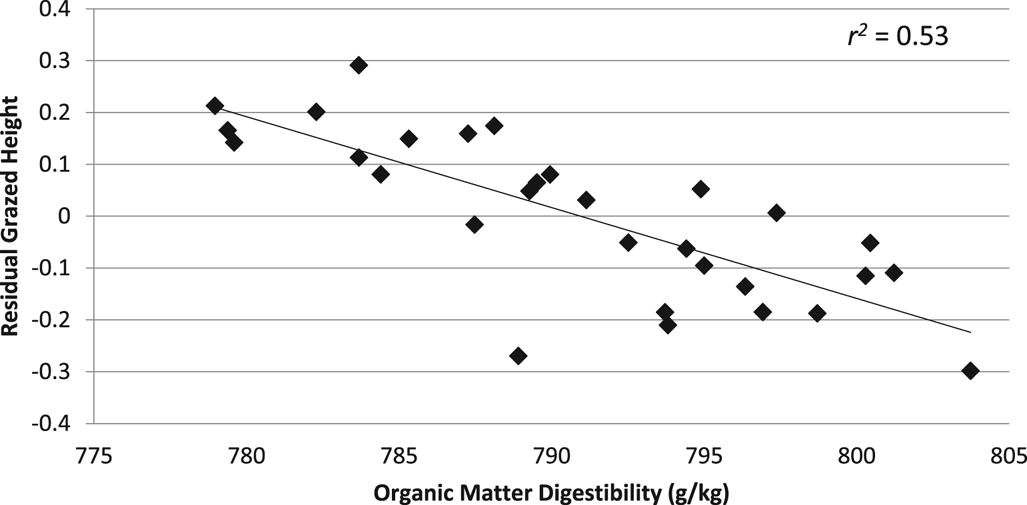
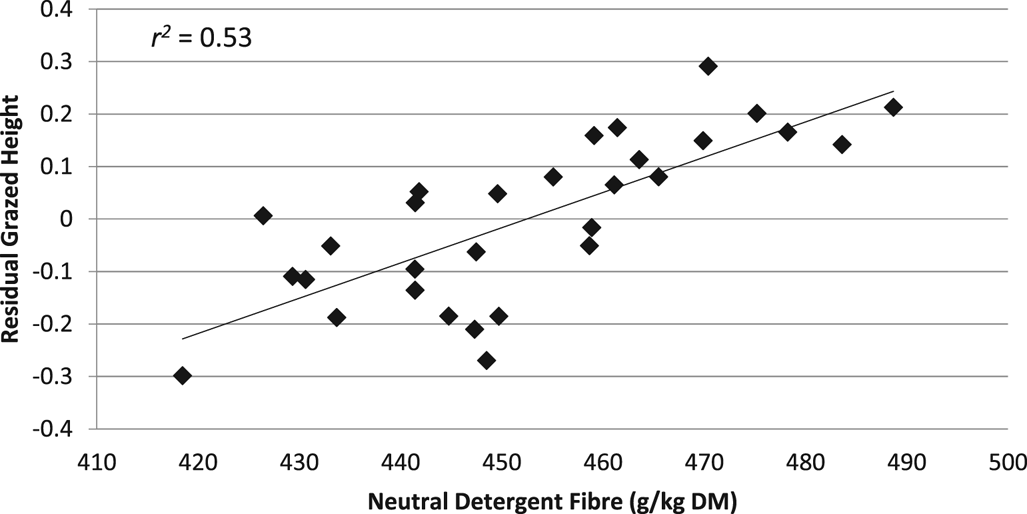
All nutritive quality traits were significantly correlated with RGH (P < 0.05) except for ash content (P > 0.05). Figure 1 displays the inverse relationship between OMD and RGH and Fig. 2 displays the positive relationship between NDF and RGH. Increases in OMD and CP impacted RGH to reduce by 0.007 and 0.004 for each g/kg (DM) increase, respectively. ADF and NDF had a positive relationship with RGH with each g/kg DM increase in ADF and NDF causing a 0.005 and 0.003 increase in RGH, respectively. The correlation between all nutritive quality traits as measured by R 2 was 0.52 (ranging from 0.50 to 0.53).
The relationship between grass variety RGHs and their OMD.
Relationship between grass variety RGHs and their NDF.
Leaf and pseudo-stem proportions were also strongly correlated with RGH (Table 4). Increasing leaf proportion by one unit decreased RGH by 0.009 while increasing pseudo-stem by one unit increased RGH by 0.014. ETH and ESH also had a significant correlation with RGH. By increasing ETH by 1 cm, RGH increased by 0.05 while a 1 cm increase in ESH was estimated to increase RGH by 0.05. Neither tiller density nor ground-score was shown to have any effective correlation with grazing efficiency.
Of all the traits included, four were selected in the regression model to best explain the variation in RGH. The first trait selected was ploidy, which explained 0.47 of the total variation. The second was pre-grazing sward height, which together with ploidy explained 0.54 of the variation in RGH. The third was CP, which raised the representation to 0.63 of RGH variation. Finally, with the fourth and last trait, pseudo-stem proportion, included in the model the representation of the RGH variation increased to 0.70.
Discussion
The omission of animal value traits in PRG variety evaluation systems is a severe limitation given that the ultimate benefit of a variety is derived from the increase in animal production it supports (Wilkins and Humphreys, Reference Wilkins and Humphreys2003). Such traits impact the profitability of grazing-based enterprises. This absence of direct animal value evaluations is largely due to a cost impediment as national and recommended list trials operate under limited resources (Gilliland et al., Reference Gilliland, Annicchiarico, Julier and Ghesquière2019). The current study has shown that a number of relatively easily measured traits exist that could provide such an assessment, by proxy.
In this study, similar to that of Byrne et al. (Reference Byrne, Gilliland, Delaby, Cummins and O'Donovan2018), clear grazing efficiency differences between perennial ryegrass varieties were observed. The findings that tetraploids permitted livestock to consume a higher proportion of the available herbage than diploids, along with associated morphological differences, indicated that their sward structure was more utilizable. This provides additional understanding of the mechanisms involved in previous reports of increased utilization potential of tetraploid varieties (Balocchi and López, Reference Balocchi and López2009; McDonagh et al., Reference McDonagh, McEvoy, Gilliland and O’ Donovan2015; Cashman et al., Reference Cashman, McEvoy, Gilliland and O'Donovan2016). Diploid varieties had higher herbage accumulation than tetraploids, which differs from the published performance of those varieties in Recommended List evaluations (i.e. minimal ploidy effects on herbage yield are observed within Recommended List evaluations; DAFM (2016)). The lower post-grazing sward heights of tetraploid varieties in the current study (relative to diploid varieties grazed concurrently) most probably had a negative effect on subsequent pasture regrowth, resulting in lower herbage DM accumulation, as reported by Tubritt et al. (Reference Tubritt, Delaby, Gilliland and O'Donovan2020). Higher post-grazing sward height increases the amount of residual leaf present, which can photosynthesize directly post-grazing (Grant et al., Reference Grant, Barthram and Torvell1981). Lower grazed swards must use internal carbohydrate reserves to produce the first leaf before photosynthesis can commence.
Comparing total herbage utilized based on proportion consumed and total herbage accumulation would indicate that diploid varieties utilized greater amounts of herbage within the study. Proportion consumed does not take into account pre-grazing differences between varieties and therefore, RGH is a more accurate measure of grazing efficiency (as it accounts for pre-grazing sward height). RGH values of tetraploids indicate that they are more utilizable. Furthermore, if varieties performed as their Recommended List performance indicates for herbage yield, and proportion consumed remained constant, then tetraploid varieties would utilize more herbage. Grazing efficiency evaluation between varieties at similar pre-grazing herbage yields and different grazing intensities should be investigated. Wims et al. (Reference Wims, McEvoy, Delaby, Boland and O'Donovan2013) and McDonagh (Reference McDonagh2017) reported similar annual herbage production for the tetraploid and diploid varieties examined but superior herbage intake displayed by the cows grazing tetraploid varieties led to improved milk production. Within the current study, where tetraploid and diploid varieties achieved similar herbage yields, tetraploid varieties displayed greater grazing efficiency as measured by RGH (Tubritt et al., Reference Tubritt, Delaby, Gilliland and O'Donovan2020).
Heading date differences did not affect grazing efficiency, which is not surprising as sward management was precisely controlled to maintain leafy swards. Previous studies found that later heading varieties develop reduced stem, later in the growing season, which leads to greater grazing efficiency (O'Donovan and Delaby, Reference O'Donovan and Delaby2005), but despite such differences in seasonal morphology being recorded in this study, it did not affect grazing performance significantly. This raises the possibility that the high emphasis placed on variety heading date in the industry needs to change, to an industry that focuses on the various characteristics that support more efficient grazing. This response appears to be consistent as the Pearson Rank correlations between years were strong (r = 0.70) indicating that re-ranking of varieties for grazing efficiency was minimal.
Pre-grazing production traits were strongly correlated with grazing efficiency which highlights the importance of consistent grassland management as these traits are largely governed by grazing management rather than inherent varietal characteristics. Achieving target pre-grazing covers and correct post-grazing residuals at each grazing are critical to optimizing milk production from the pasture (Macdonald et al., Reference Macdonald, Glassey and Rawnsley2010). Forbes (Reference Forbes1988) identified a positive correlation between pre-grazing sward height and grazing efficiency and likewise, a similar relationship between grazing efficiency and pre-grazing sward height was found by (Byrne et al., Reference Byrne, Gilliland, McHugh, Delaby, Geoghegan and O'Donovan2017) where a 1 cm increase in pre-grazing sward height resulted in a post-grazing sward height increase of 0.12 cm. The current finding that a 1 kg DM/ha increase in pre-grazing yield resulted in a +0.001 increase in RGH aligns with previous research also. Curran et al. (Reference Curran, Delaby, Kennedy, Murphy, Boland and O'Donovan2010) investigated the effect of cows grazing swards of different herbage masses. Where daily pasture allowance was restricted (15 kg DM/cow/day), cows grazing low (1600 kg DM/ha) and high herbage mass swards (2400 kg DM/ha) had similar post-grazing sward heights and similar levels of utilization. As herbage allowance increased, post-grazing sward height increased and grass utilization reduced. Milk yield was lower for the restricted treatment groups in that study (Curran et al., Reference Curran, Delaby, Kennedy, Murphy, Boland and O'Donovan2010) indicating that while grazing to low post-grazing sward heights is an important target, an optimum balance exists between post-grazing sward height and daily herbage intake. Employment of high-grazing efficiency varieties may optimize this relationship increasing herbage intake whilst improving post-grazing sward height.
It is well known that varietal morphology differs greatly both within ploidy groups and between heading date groups (Griffiths et al., Reference Griffiths, Matthew, Lee and Chapman2017). The current study shows that these morphological (as well as nutritive quality) traits provide an opportunity for breeders to produce new varieties that increase the willingness of ruminants to graze to low post-grazing sward heights. Many of these traits are closely linked, as was evident in the highly similar responses and pattern of significant differences presented in the results section. As expected, increasing OMD had a positive correlation with grazing efficiency and previous research has found similar responses within both plot and farm systems studies (Stilmant et al., Reference Stilmant, Limbourg and Lecomte2005; Balocchi and López, Reference Balocchi and López2009). Higher OMD content and lower stem proportion of tetraploid v. diploid varieties were cited as the driver of differences in herbage utilization and milk production within the study by Wims et al. (Reference Wims, McEvoy, Delaby, Boland and O'Donovan2013). Similarly, grass DM intake increased by 0.2 kg DM for every 1% increase in OMD in the study by Peyraud et al. (Reference Peyraud, Comeron, Wade and Lemaire1996). Elevating water-soluble carbohydrates within PRG has been shown to increase digestibility with corresponding increases in milk yield (Miller et al., Reference Miller, Moorby, Davies, Humphreys, Scollan, MacRae and Theodorou2001). Such breeding successes have led to the commercialization of ‘high sugar’ PRG varieties (Francis et al., Reference Francis, Chapman, Doyle and Leury2006). By applying positive selection pressures for some traits such as OMD, and negative pressures on other characters as indicated by the current results, breeders can expect to achieve a progressive improvement in the grazing efficiency of future varieties.
This breeding opportunity does not necessarily apply to all the measured traits. For example, CP was positively correlated with grazing efficiency and Byrne et al. (Reference Byrne, Gilliland, Delaby, Cummins and O'Donovan2018) also found a similar relationship between CP and post-grazing sward height. Its influence was not as pronounced as OMD and given the unbalanced supply of protein in ruminant diets, it is arguable that plant breeders should be seeking to decrease CP and support efforts that are being made to reduce nitrate leaching from ruminants (Parsons et al., Reference Parsons, Edwards, Newton, Chapman, Caradus, Rasmussen and Rowarth2011).
Breeders have developed superior varieties with corresponding improvements in animal performance by modifying certain digestibility and other chemical traits (Casler and Vogel, Reference Casler and Vogel1999) and this was evident from the results of the current study. Such an example is the varietal variation found for NDF and ADF content and its negative correlation with grazing efficiency. The increased fibre content in the diet is associated with increased forage retention time in the rumen (Thornton and Minson, Reference Thornton and Minson1972), which lowers the rate of digestion that occurs (Buxton and Redfearn, Reference Buxton and Redfearn1997). Such decreases in the rate of digestion depress VFI and with it grazing efficiency. Breeders recognizing these negative effects of ADF and NDF on VFI have focused on reducing lignin content to reduce cell wall digestion because it has a high heritability (Casler et al., Reference Casler, Jung and Coblentz2008). Breeders have altered the growth structure of the plant to increase the production of the more nutritious proportions (Wims et al., Reference Wims, Ludemann, Phillips and Chapman2017), which was also evident in the results of the current study. The inverse relationship between leaf proportion and RGH showed that a higher leaf content within the sward increases grazing efficiency. This is consistent with the known differences in digestibility between leaf and pseudo-stem proportions compared to true stem and dead leaf (Beecher et al., Reference Beecher, Hennessy, Boland, McEvoy, O'Donovan and Lewis2015). This also indicated that a higher proportion of tetraploids in swards would be advantageous and this is supported by Gilliland et al. (Reference Gilliland, Barrett, Mann, Agnew and Fearon2002) who showed that tetraploids have higher proportions of leaf than diploids. Despite these breeding achievements, translating them into quantifiable estimates of potential animal performance improvements has been limited by the absence of a measure of their impact on grazing efficiency. While measures of digestion and their metabolic responses were possible, translating this into projected animal performance uplifts when grazing, required a measure of the grazing efficiency changes. The current study now provides this key information.
Some caution is needed, however, when applying the findings of the current study to developing estimates of grazing efficiency. For example, the pseudo-stem proportion was positively correlated with RGH, indicating that selection against pseudo-stem would increase grazing efficiency. Unfortunately, the published literature is conflicted as to the effect pseudo-stem has on grazing. Mitchell (Reference Mitchell1995) found that developed pseudo-stem is avoided by grazing animals and Barthram and Grant (Reference Barthram and Grant1984) found that sheep avoided grazing pseudo-stem. Contrary to this Flores et al. (Reference Flores, Laca, Griggs and Demment1993) found that grazing cattle readily consumed the pseudo-stem fractions of PRG. McDonagh (Reference McDonagh2017) cited increased true stem as a possible factor increasing rumination time and lowering VFI and, therefore, it might be expected that selecting for increased pseudo-stem at the expense of true stem would increase grazing efficiency as pseudo-stem is far more digestible than true stem (Beecher et al., Reference Beecher, Hennessy, Boland, McEvoy, O'Donovan and Lewis2015), but no significant relationship was found between true stem and grazing efficiency within this study. This may be explained by the precise grazing regime implemented that permitted only low proportions of the true stem to develop, even during the main heading period in summer. A positive correlation was found between dead leaf proportion and increased grazing efficiency in the current study. This disagrees with findings in other studies where the dead leaf is less digestible than leaf and pseudo-stem proportions and thus rejected by ruminants (Beecher et al., Reference Beecher, Hennessy, Boland, McEvoy, O'Donovan and Lewis2015). It is likely that development of dead leaf proportion was depressed in this study due to the precise grazing management imposed and that these low proportions failed to express fully the true correlation with grazing efficiency. In the current study, ETH, ESH and FLL were all positively correlated with RGH, indicating that increases in these traits would have negative effects on grazing efficiency. This is contrary to previous studies, such as McDonagh (Reference McDonagh2017), where larger ETH and FLL values correlated with increasing grazing efficiency. Likewise, Byrne et al. (Reference Byrne, Gilliland, Delaby, Cummins and O'Donovan2018) found that increasing FLL decreased post-grazing sward height with a correlation of −0.41. This is further corroborated by Gilliland et al. (Reference Gilliland, Barrett, Mann, Agnew and Fearon2002) and Barrett et al. (Reference Barrett, McGilloway, Laidlaw and Mayne2003) who both reported a similar effect of sward morphology characters on VFI and grazing efficiency in a range of different PRG varieties. Greater ESH length has been cited as a possible trait that has negative effects on DM intake as it indicates increased stem proportion within the sward, which acts as a physical barrier to grazing animals (Wade et al., Reference Wade, Peyraud, Lemaire and Comeron1989; Kennedy et al., Reference Kennedy, O'Donovan, Murphy, Delaby and O'Mara2007).
A possible factor in these disparities is that tiller measurements in the current study were made throughout the grazing season (except for the first and last grazing events of each year) whereas Byrne et al. (Reference Byrne, Gilliland, Delaby, Cummins and O'Donovan2018) measured FLL once, in both the reproductive and vegetative stages. It is also likely that the precise grazing management imposed in the current study greatly curtailed the level of variation recorded between the variety swards. Nonetheless, until the causes underlying these different conflicts are better understood, a degree of uncertainty must be applied to the magnitude of response and relationship between these traits and grazing efficiency. The identified proxy characters could be used to derive an RGH index for assessing a variety of grazing efficiencies. This has the potential to identify superior varieties for grazing systems, demanded by farmers and while further investigations may be required to fully quantify these benefits commercially, this should not impede testers from developing suitable test procedures to evaluate grazing efficiency.
Conclusion
The current study used PRG characters that are routinely assessed in a variety of trials (e.g. digestibility) combined with additional morphological characters to evaluate PRG grazing efficiency, by proxy, thereby avoiding the prohibitively high costs of direct animal assessments. If implemented, the inclusion of proxy grazing efficiency measures into routine variety evaluation could incentivize breeders to select for improvements in these proxy traits. This would require plant breeders to incorporate these traits into their breeding programmes but should enhance their ability to achieve advances in animal grazing performance. In time, this could offer similar progressive improvement to that already achieved in traits such as DM yield, persistency and digestibility and so deliver quantifiable production and sustainability benefits to grazing enterprises.
Acknowledgements
The authors wish to acknowledge the technical assistance of A. McGrath, M. Liddane, T. Casey and J.P. Murphy.
Financial support
This research was funded by Dairy Research Ireland – Irish Dairy Farmers levy funding.
Conflicts of interest
All authors declare no conflicts of interest with the subject matter or materials discussed in this manuscript.
Ethical standards
Not applicable. No animal measurements were taken during this research.