Introduction
Researchers have devoted major efforts to analyze standards of living because they bear on determining the pace of economic development and economic leadership before and after the Industrial Revolution (Allen Reference Allen2001). In the last two decades, a couple of discussions have generated a wave of works focused on living standards in the preindustrial era, along with an expansion of the geographic approach.
A first debate deals with the so-called great divergence between Europe and Asia (Pomeranz Reference Pomeranz2000). According to the classical economists and many modern scholars, European living standards surpassed those in Asia long before the Industrial Revolution. Revisionists have distrusted this traditional view, suggesting that Asian living conditions were comparable to those of Europe in the eighteenth century. Yet, the evidence that has led to this ongoing controversy remains fragile.
A second discussion approaches the forces that led to the beginning of a long-lasting little divergence between northwestern and southern European economies (Broadberry Reference Broadberry2013). Substantial economic disparities have been observed among countries, especially between 1500 and 1750 (Allen Reference Allen2001). In recent years, quantitative studies have shed new light on the timing, determinants, and effects of this process through series of real wages, urbanization rates, GDP,Footnote 1 and energy consumption (Malanima Reference Malanima2016). However, explanations on why some southern economies such as Spain fell behind remain unknown (Álvarez-Nogal et al. Reference Álvarez-Nogal, de la Escosura and Santiago-Caballero2016).
Examining differences in material conditions is feasible using Spanish primary sources. In this regard, the evolution of prices and wages sheds light on patterns of change throughout the preindustrial era. Long-term series of wages and prices allow scholars to enlarge their knowledge about real incomes in modern Europe, as well as to undertake comparisons among several economies (Clark Reference Clark2007).Footnote 2
This article presents a general price index for Toledo, one of the most relevant and populated cities in early modern Spain, between 1521 and 1650. To that end, I gather information on prices for up to 54 different goods, whose main sources are (1) Hamilton’s price series for New Castile (Hamilton Reference Hamilton1934); and (2) new values collected from Toledo’s civil and ecclesiastical institutions. These new sources provide long series of missing items in Hamilton’s work, cover gaps in the series already known, and allow for the contrast of prices from alternative sources. They also provide information on eating habits and consumption patterns of the Toledans in the sixteenth and seventeenth centuries.Footnote 3
The new index offers two key improvements: (1) the inclusion of housing, an item often absent from the standard consumer basket,Footnote 4 and manufactured goods; and (2) the use of three different consumption baskets over time (1521–50, 1551–1600, and 1601–50), which reflect changes in the consumption patterns of the low-income families. These improvementes are determined by purchasing power trends, energy requirements, and literature on the European history of consumption.Footnote 5
Section 2 provides a brief foray into the economic and demographic context of Toledo in the sixteenth and seventeenth centuries. In Section 3, I review the literature on living standards and price indices in the modern age. Section 4 describes the sources and methodology used to construct the new price index. Section 5 teases out the main trends of the Toledan prices and its contrast with other Spanish and European indices. The conclusions are offered in Section 6.
Toledo in the Sixteenth and Seveteenth Centuries
During the sixteenth and seventeenth centuries, Toledo and its province took part in Castile’s economic and demographic performance, which underwent two different and long-lasting transitions: (1) an expansion that culminated about the 1580s; and (2) a decline that marked its nadir between 1630 and 1680 (García Sanz Reference García Sanz1985; González Agudo Reference González Agudo2017a; Marcos Martín Reference Marcos Martín2000; Sebastián Amarilla Reference Sebastián Amarilla, Llopis and Maluquer2013).
By the mid-sixteenth century, Toledo was the second most populated city in Castile, only surpassed by Seville. Prior to the establishment of Madrid as a permanent seat of the crown (1561), the monarchs used to spend long periods in Toledo, which also hosted many of the Cortes, the representative assemblies of the Castilian cities. Also, since the eleventh century, Toledo was considered as the religious center of Spain, whose archbishop held the primacy of all the Spanish kingdoms. This supremacy led the Toledan archbishopric to become one of the wealthiest and most influential dioceses in Christendom (Villaluenga Reference Villaluenga2005). The presence of a powerful clergy, nobles, merchants, craftsmen, artisans, and officials of the crown reinforced Toledo’s urban character (Martínez Gil Reference Martínez Gil and De La Cruz Muñoz2010; Martz Reference Martz1983).
Despite several agricultural and demographic crisis in the first three decades, the political rise of sixteenth-century Toledo was accompanied by a demographic and economic boom (Pérez Moreda Reference Pérez Moreda1980: 248–49). Some sources point to a major urban growth in the second third of the century. According to the 1528–30 census, Toledo had 5,898 hearths. This figure doubled in little more than 40 years: in 1571 the city population reached to 12,412 hearths, the equivalent to roughly 47,000 inhabitants.Footnote 6 Meanwhile, baptisms in 13 urban parishes registered a large increase between 1535 and 1560; and rose briefly in the eighties, despite the fact of being hit by a hard subsistence crisis (1580) and a plague episode (1583).Footnote 7 Several features reflect Toledo’s splendor: urban transformations, a strong immigration, the establishment of many religious institutions, the development of textile manufacturing based mainly on cloths and silks, the constitution of powerful guilds, and a “land-hunger” in the region (Vassberg Reference Vassberg1983).Footnote 8
Toledo’s decline began in the first decade of the seventeenth century, once the royal court was permanently settled in Madrid (1606). The plague of 1599, the subsistence crisis of 1606–7, the expulsion of the moriscos in 1609, and, above all, emigration to Madrid marked the beginning of a significant demographic loss. Parish city records indicate a gradual fall in population of about 30 percent between 1590 and 1607, and a sharp drop that lasted from 1605 to 1636 (Martz Reference Martz1983; Montemayor Reference Montemayor1996). By 1645, half of Toledo’s population had been lost in a dramatic process of deurbanization and depopulation that affected New Castile (Pérez Moreda and Reher Reference Pérez Moreda, Reher and Fortea Pérez1997). Some related facts have been given: a drop in agricultural production, technological backwardness, decapitalization, lack of raw materials, and an increasing tax burden imposed by the crown, especially severe in 1575 and 1591 (Ruiz Martín Reference Ruiz Martín1998). This also entailed a deep decline in the city’s textile and commercial sectors.
Price Indices and Living Standards in the Modern Age
Scholars have faced several constraints related to the composition of price indices in the modern period, including the noninclusion of certain products in the representative basket (e.g., housing, baked bread, goods from the New World); an undervaluation of other components (e.g., services, luxury goods, labor-intensive goods, retail goods, or nontraded goods) as a result of asymmetrical information (Llopis et al. Reference Llopis, García-Hiernaux, García Montero, González Mariscal, Hernández and García2009); and the assumption that consumption patterns did not change over the centuries (Van Zanden Reference Van Zanden, Allen, Bengtsson and Dribe2005).
In an attempt to offer a second generation of price indices, methodological contributions are relevant in terms of calculating welfare ratios or including rent and bread prices in the baskets. Yet, estimates on living standards in preindustrial Europe and Asia are not beyond criticism. For instance, the use of the same representative basket to study the evolution of prices over a long period implies that low-income families shared similar and fixed consumption patterns.Footnote 9 Recent studies have also questioned Allen’s share of housing rent on the total familiar income (5 percent) for all the modern period (Allen Reference Allen2001). In Spain, some recent works give significantly higher percentages than Allen’s, urban rent being one of the most influential items on the price indices’ trend throughout the sixteenth and seventeenth centuries (Drelichman and González Agudo Reference Drelichman and González Agudo2014; González Agudo Reference González Agudo2017b; González Mariscal Reference González Mariscal2015). As for comparative analysis, an explicit identification of each product composing the basket is needed, given the diversity and quality of goods lying behind a certain item (López Losa and Piquero Zarauz Reference López Losa and Piquero Zarauz2016).
Other disagreements deal with family size, the contribution of its members to the household income, and working time (García Zúñiga Reference García Zúñiga2011, Reference García Zúñiga, Maitte and Terrier2014; Garrido-González Reference Garrido-González2016; González Mariscal Reference González Mariscal2013; Humphries Reference Humphries2013; Llopis and García Montero Reference Llopis and García Montero2011; Sarasúa Reference Sarasúa and Borrás2013). Recent studies on Spain have highlighted the relevance of child and female labor in sustaining living standards of families (Humphries and Sarasúa Reference Humphries and Sarasúa2012). Besides, an upward bias in the cost of the basket’s goods is possible due to taxes and excise duties.Footnote 10 Lastly, it is important to consider the information gaps. The lack of data could be solved by using alternative primary sources such as notarial or municipal registers. Gathering rural prices and wages is a feasible option for the purpose of comparison with those of urban areas (González Mariscal Reference González Mariscal2015).
Few studies are available on the price evolution in early modern Spain. Most research is based on Earl J. Hamilton’s price series for Andalusia, Aragon, Old and New Castile, Leon, Navarre, and Valencia (Hamilton Reference Hamilton1934, Reference Hamilton1936, Reference Hamilton1947, Reference Hamilton1983).Footnote 11 Javier Moreno provided new prices and wages series for Palencia between 1751 and 1851 (Moreno Lázaro Reference Moreno Lázaro2001, Reference Moreno Lázaro and Martínez Carrión2002). Thereafter, Llopis et al. (Reference Llopis, García-Hiernaux, García Montero, González Mariscal, Hernández and García2009) compared price indices between 1680 and 1800 in Madrid, Seville, and Palencia.Footnote 12 More recently, price and wage indices have been composed for eighteenth-century Madrid using registers from several charitable institutions (Andrés Ucendo and Lanza García Reference Andrés Ucendo and Lanza García2014). Also, remarkable efforts have been made gathering new price series and constructing price indices for early modern Seville and Toledo (González Agudo Reference González Agudo2017a, Reference González Agudo2017b; González Mariscal Reference González Mariscal2015). In Catalonia, Gaspar Feliú studied prices in the sixteenth and seventeenth centuries and approached the cost of living in Barcelona between 1501 and 1807 (Feliú Reference Feliú1991a, Reference Feliú1991b, Reference Feliú1995, Reference Feliú and Fontana2004). There is, therefore, an open field for future research in Spain.
Sources and Methodology
The construction of a price index first requires the composition of consumption baskets. I first gather price series of up to 54 different products: 45 series are taken from Hamilton’s book, whose prices were obtained from Toledo and Alcalá de Henares (Madrid). Most of prices come from the daily expenses of Tavera, one of Toledo’s main hospitals, with available data since 1540. For previous decades, Hamilton offers few prices for 12 different goods in New Castile.Footnote 13 Some problems have already been identified by scholars (Allen Reference Allen2001; Feliú Reference Feliú1991a; Llopis Reference Llopis, Thompson and Yun1994; López Losa Reference López Losa2013; López Losa and Piquero Zarauz Reference López Losa and Piquero Zarauz2016; Nieto Reference Nieto2006). In the case of agricultural prices (wheat, barley, olive oil, etc.), Hamilton noted just the first three purchases of each trimester, regardless of the remaining transactions by the hospital.Footnote 14 Then, he determined the yearly price by calculating an arithmetic mean. This procedure gives the same relevance to both seedtime prices and harvest prices.
A patient search in the Toledan archives yielded 20 new and alternative price series for the period 1521–1650. The Cathedral ledgers offer prices for food (wheat, barley, hens, olive oil, and vinegar), clothing and footwear (linen, cotton, esparto, and shoes), housing and its conservation (urban rent, bricks, and tiles), fuel and lighting (charcoal, olive oil, and yellow wax), kitchenware and other (linen, esparto, hemp, and paper). Meanwhile, the city council ledgers provide information on wine prices.Footnote 15 The new series offer information on prices of nine products absent in Hamilton’s work (linen, cotton, esparto, shoes, housing rent, bricks, tiles, charcoal, and hemp) which are available for the first half of the sixteenth century.Footnote 16 This makes it possible to contrast between two alternative series for a given product, and fill in information gaps in the old series.
Unlike Hamilton’s data, the new prices consider the total annual purchases, weighted by the quantities purchased. However, this exercise does not always guarantee the preference for the new sources because they may contain some drawbacks. For instance, intervened wheat and barley prices seem to be more abundant in the Cathedral ledgers than in Hamilton’s series. This led me to discard the latter in favor of Hamilton’s wheat prices. Even so, there is no information on the grain prices that the lowest-income Toledans really faced.
Up to this point, it has not been possible to find records that offer solid and continuous bread prices in early modern Toledo.Footnote 17 The prices of bread were determined by the grain quotations as well as the elaboration cost (Nef Reference Nef1937). An alternative would have been Allen’s calculation of bread prices through a regression on grain prices, dummy variables for some European cities, and the mason’s wage rate: a stand-in for the baker’s income (Allen Reference Allen2001). Yet, because mason laborers’ wages are only available for the period 1551–1600 in Toledo (Hamilton Reference Hamilton1934) and require a critical analysis, conversion of wheat prices into bread ones is not feasible for the whole period 1521–1650. For the purposes of calculating an index for 1521 onward, I use wheat prices. As the construction of the index only relies on variations in prices rather than their levels, if bread prices have a reasonably strong correlation with wheat prices, this should not introduce a significant bias. Nonetheless, a new search for both wages and bread prices in the city is on its way.
Together with wheat/bread, wine was one of the most consumed products in southern Europe during the Old Regime. In Castile, this beverage became relevant for three main reasons: (1) wine covers a significant share of the daily human caloric needs; (2) grapevine productivity was higher than that of cereals; and (3) unlike grain, wine prices were not constrained by public intervention, thus its marketing possibilities were also stronger (Bernardos Reference Bernardos2014). Yet, wine prices are very controversial because they depended on several factors such as type, quality, measurement units, or consumption taxes (Allen Reference Allen2001; Andrés Ucendo and Lanza García Reference Andrés Ucendo and Lanza García2014; Feliú Reference Feliú1991b; Llopis Reference Llopis, Thompson and Yun1994; López Losa Reference López Losa2013). In this regard, Hamilton’s series for New Castile contains wholesale prices (expressed in arrobas) that only refer to “new” (seasonal) wine, without any other distinctions on types or qualities.Footnote 18
The alternative is municipal prices, available since 1565. The wine values used to be set by the Toledan council, together with some wine dealers representatives in the city (called Herederos del Vino). Two or three annual statements (posturas) on the public retail prices were made through a meticulous procedure based on rural prices. Each year, several city delegates were sent across the Toledan countryside, within 45 km from Toledo, to gather testimonies on the price at which wine was sold at public taverns. The depositions give information on the price of white, ordinary, and new (seasonal) wine, and sometimes on its quality, which used to be reasonable, good, very good, select, or “as good as what is shipped to Toledo.” Most of the posturas refer to the term vino de yema, which stands for delicate wine made from slightly crushed grapes. The monetary cost of wine in the city was, on average, slightly more expensive (seven maravedis) than that established in the countryside. Wine prices in Toledo include transportation costs and a possible profit margin for urban retailers, and they seem to be before consumption taxes. It has been argued that wine was one of the most taxed products in seventeenth-century Castile. Fraud was also frequent in terms of quality, measurement, and distribution (Andrés Ucendo Reference Andrés Ucendo2010). Thus, these reasons lead me to interpret the new data carefully.
Since food consumption covers human basic nutritional needs, I convert food prices into decimal metric units, and then into calories. In recent years, some accurate calculations have established the basic energy requirements for an average English person in the eighteenth and nineteenth centuries. These requirements would equal 76 percent of the average caloric needs of a male adult (Allen Reference Allen2013; Floud et al. Reference Floud, Fogel, Harris and Hong2011). Hence, the energy needs of three male adults would correspond to those of four individuals, including women and children. In Spain, the energy requirements of a low-income family of four members in modern Seville (7,400 calories) corresponded to 2.7 times those of a male family head (González Mariscal Reference González Mariscal2013).
The next step is calculating the relative cost of acquiring 1,000 calories of food products with respect to the daily income earned by the family of a Toledan low-skilled worker (e.g., a mason laborer).Footnote 19 Then I set the budget constraint considering the average wage of a full-time Toledan mason laborer in 1520 and 1650, plus an additional 20 percent corresponding to complementary earnings (wages in kind, tips, proportional incentives, retributions from child and female labor, etc.).Footnote 20 This addition allows me to determine the household’s consumption possibilites for each good.
Nonfood prices have also been converted into decimal metric units. As for housing rent, yearly data are taken from a sample of 49 urban properties belonging to the Cathedral chapter in the Toledan “poor neighborhoods”: Arrabal, San Lorenzo, Santa Leocadia, San Marcos, San Miguel el Alto, and San Soles. For each property, I calculate the annual rent per square meter and I multiply the median value by 14.78, the average consumption area per inhabitant in the late sixteenth century (Drelichman and González Agudo Reference Drelichman and González Agudo2014). Assuming that an urban hearth was composed, on average, of 3.5 individuals in early modern Toledo, rent would represent 7.35 and 8.75 percent of the family income in 1520 and 1650, respectively.Footnote 21 These shares are close to those recently calculated in Toledo by Drelichman and González Agudo (9.5 percent, on average, between 1489 and 1650) and Seville (between 6.8 and 17.4 percent in the sixteenth century; González Mariscal Reference González Mariscal2015). Also, they are significantly higher than those given by other scholars (an upper bound of 5 percent) for the early modern period (Allen Reference Allen2001; Horrell Reference Horrell1996; López Losa and Piquero Zarauz Reference López Losa and Piquero Zarauz2016).
In short, the consumer basket composition of a low-income Toledan family from 1521 to 1650 turns out to be determined by (1) basic energy requirements of a four-member family (≈ 7,400 calories); (2) the family’s budget constraint; (3) the consumption possibilities for each good; and (4) data on consumption expenditures, collected from several charitable and religious institutions in Toledo, and scattered references from the literature on the history of consumption in southern Europe.
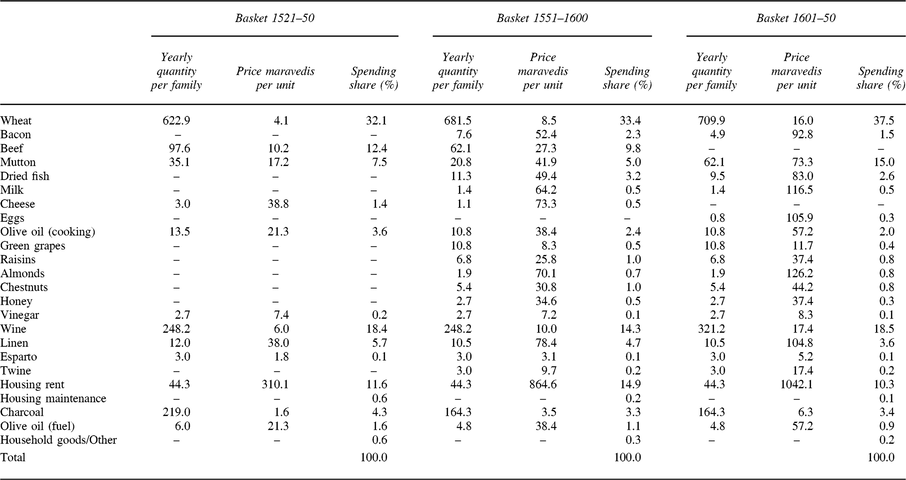
Table 1 displays three different consumption baskets over time, each reflecting changes in the consumption patterns. Using time-varying baskets can result in lower calculated increases of the consumer price index, and hence in lower decreases in real wages and living standards. Nonetheless, this method is considered a more precise way of calculating a Consumer Price Index (CPI), is widely adopted by statistical agencies, and produces a more accurate picture of real wages and living standards. An index calculated with a single basket risks keeping products that consumers might have substituted away from long before, thus overstating the increase in the CPI.
Consumption baskets in Toledo for 1521–50, 1551–1600, and 1601–50

Sources: ABCT, Obra y Fábrica, Libros de la Obra, 796–908; AMT, Caja de Vino, 2405–9; and Hamilton (Reference Hamilton1983).
Note: Wheat (2,940 kcal/kg), bacon (6,550 kcal/kg), beef (2,140 kcal/kg), mutton (2,125 kcal/kg), dried fish (3,220 kcal/kg), cheese (3,330 kcal/kg), eggs (1,570 kcal/kg), green grapes (681.4 kcal/kg), raisins (2,750 kcal/kg), almonds (6,100 kcal/kg), chesnuts (1,700 kcal/kg), honey (2,880 kcal/kg), lime, plaster, and charcoal are expressed in kilograms. Milk (620 kcal/kg), olive oil (9,000 kcal/kg), vinegar (40 kcal/kg), and wine (650 kcal/kg) are expressed in liters. Linen, esparto, and hemp are expressed in meters. Twine is expressed in hectograms. Bricks and tiles are expressed in units. Housing consumption is expressed in squared meters. Paper is expressed in hands.The basket for 1521–50 contains 17 different products, gathered into 12 items (see appendix, notes on consumer baskets). The budget constraint for that period is 8,025 maravedis, that is the daily salary of a Toledan mason laborer in 1520 (26.8 maravedis) multiplied by 250 working days (= 6,687.5 maravedis), plus an additional 20 percent corresponding to complementary earnings. Regarding prices, for each period I consider the average quotations of the central decade (1530–40).
The amount of available goods is greater in the basket for 1551–1600, comprising up to 26 different price series arranged into 21 items. This basket also reflects changes in the consumption patterns of the Toledan low-income families. The international literature points to an overall decline in Europe’s urban real wages during the second half of the sixteenth century (Allen Reference Allen2001; Andrés Ucendo and Lanza García Reference Andrés Ucendo and Lanza García2014). Given their alleged loss of purchasing power, families might have responded (1) by increasing their additional income (earnings from child and female labor, agricultural income, etc.); and (2) by modifying their consumption patterns (i.e., acquiring more relatively cheaper products in caloric terms, and consuming fewer nonfood items). Thus, the quantity of wheat has increased, whereas those related to beef, mutton, cheese, olive oil, linen, and fuels has reduced. This basket provides 2,728.5 calories for an adult male laborer—and more than 7,000 calories for the whole family.
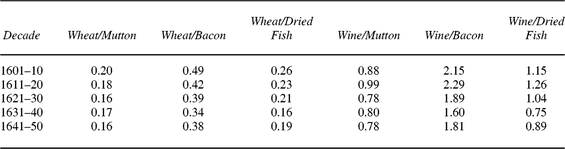
Finally, the slightly different composition of the 1601–50 basket is justified two ways: (1) a possible deterioration of real wages and the purchasing power of the Toledan low-income families in the two first decades of the seventeenth century (Allen Reference Allen2001; Andrés Ucendo and Lanza García Reference Andrés Ucendo and Lanza García2014; Cipolla Reference Cipolla1967; González Mariscal Reference González Mariscal2013; Hernández Andreu Reference Hernández Andreu1996); and (2) the lack of price series for certain products belonging to the previous basket, such as beef and cheese. This time, the share of the cheapest food items in caloric terms (wheat and wine) has increased. This change responds to a declining trend in the relative price of this type of goods (see Table 2). Besides, the share of the most expensive items in caloric terms (meat, dried fish, and dairy) has decreased. The basket provides 2,806 calories for an adult male laborer.
Relative price ratios for wheat and wine in Toledo, 1601–50 (maravedis/1,000 kcal)

Source: AMT, Caja de Vino, 2405–9; and Hamilton (Reference Hamilton1983).
Price Evolution
Once defined the three consumption baskets, their respective indices have been assembled by a chain index method.Footnote 22 This methodology first requires some sensitivity tests. The average differences between the Toledo Price Index (TPI) and its alternatives based only on the first (1521–50) or the second basket (1551–1600) are 0.01 percent and 2 percent, respectively. The findings are remarkably robust to variations in the consumption basket. Therefore, the distinct trends of the new TPI are driven in the new price series, rather than in any assumptions regarding the specific choice of weights.
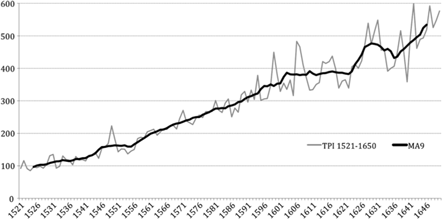
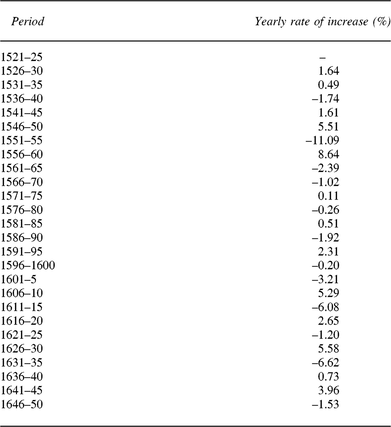
Figure 1 shows that prices in Toledo multiplied by a factor of 5.5 between 1521–29 and 1642–50. There was a substantial increase in prices in the first half of the sixteenth century (63 percent between 1521–29 and 1542–50), whereas the TPI doubled in the second half, with a growth of 116.8 percent between 1551–59 and 1592–1600. The latter stage apparently coincides with the arrival of the American precious metals (Drelichman Reference Drelichman2005; Hamilton Reference Hamilton1983; Martz Reference Martz1983). However, the greatest inflationary pressures in the city took place by 1561 (see yearly rates at Table 3), some decades before any significant amounts of American silver had reached Spain.Footnote 23
Toledo Price Index (TPI), 1521–1650. Base 100 = 1521–30 average. Index numbers and nine-year moving averages.

Yearly rates of increase of the Toledo Price Index, 1521–1650 (%)

Source: ABCT, Obra y Fábrica, Libros de la Obra, 796–908, AMT, Caja de Vino, 2405–9; and Hamilton (Reference Hamilton1983).
This evidence seems to fit better with Toledo’s demographic boom in the second third of the century, and with Jordi Nadal’s assertions on the price revolution in Spain: inflation rates started to slow in 1560–65 (Nadal Reference Nadal1959). This research holds that the demographic increase contributed to Spain’s growth in prices during the sixteenth century, as it did regarding the decline in real wages.
By offering a perspective based on a monetary approach to the balance of payments, Flynn (Reference Flynn1978) contends that the lack of synchronicity between treasure flows and intervals of price inflation in various European countries does not invalidate the monetary explanation of the price revolution. Still, years later, Munro (Reference Munro2007) gathered several works to reconcile both the monetary and the demographic explanations. He stressed that population growth might have influenced the potential velocity of money, another feature of the price revolution. In such an approach, urban growth would have played a relevant role in the expansion of urban markets and the use of credit instruments. After all, Flynn demonstrates that fiscal, financial, and banking developments in sixteenth-century Spain were, in part, responsible for driving out specie.
Recent work on early modern Madrid shows that indirect taxes raised price levels by 15 to 20 percent (Andrés Ucendo and Lanza García Reference Andrés Ucendo and Lanza García2014). In Toledo, some signs point to a growing and severe tax burden during the sixteenth century.Footnote 24 Yet, further research is required to fully comprehend this phenomenon in the city.
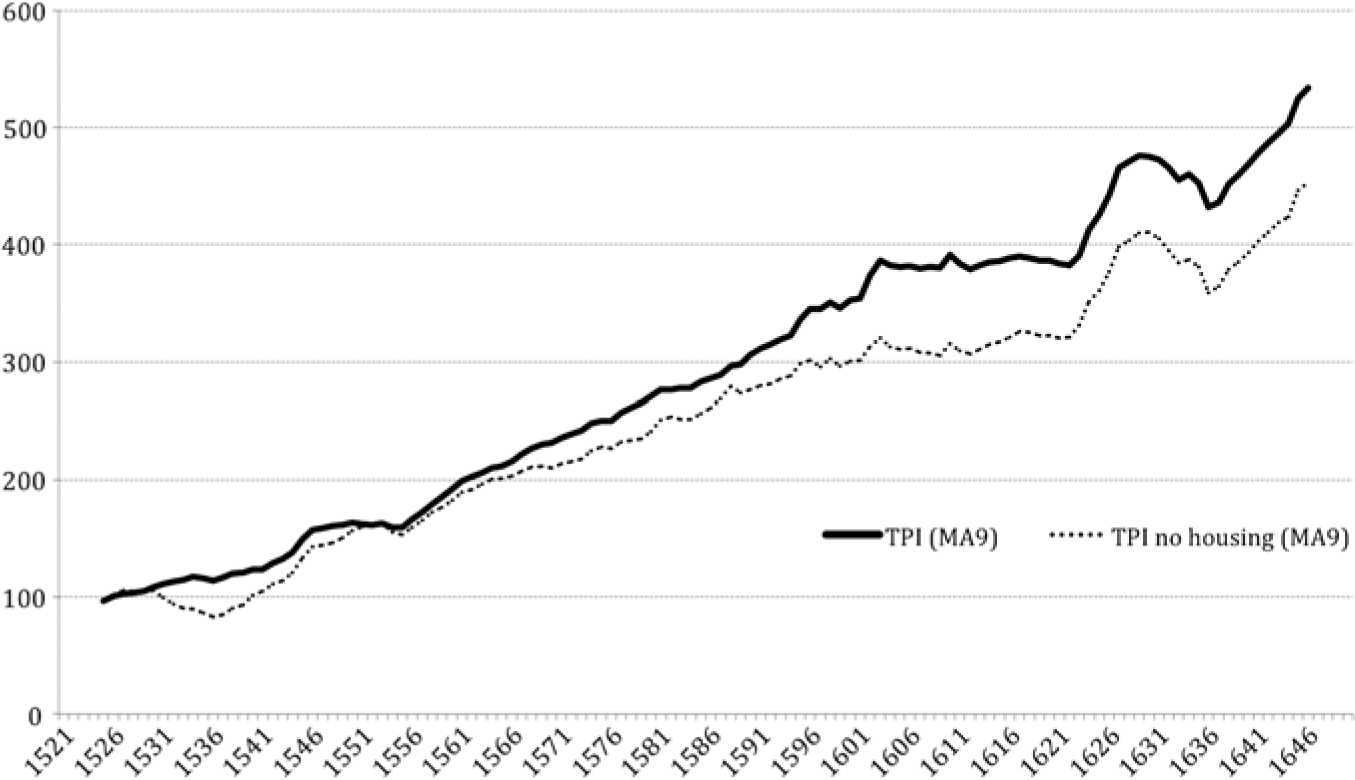
Housing (143 percent), wine (140.8 percent), and, to a lesser extent, food (114.7 percent) were the products whose prices increased the most in sixteenth-century Toledo.Footnote 25 At this point, the influence of housing on the index was noteworthy. In fact, if urban rents were excluded, the Toledan prices would multiply by 3.1 instead of 3.5 between 1521–29 and 1592–1600 (see figure 2).
Toledo Price Index and Toledo Price Index without housing, 1521–1650. Base 100 = 1521–30 average. Nine-year moving averages.
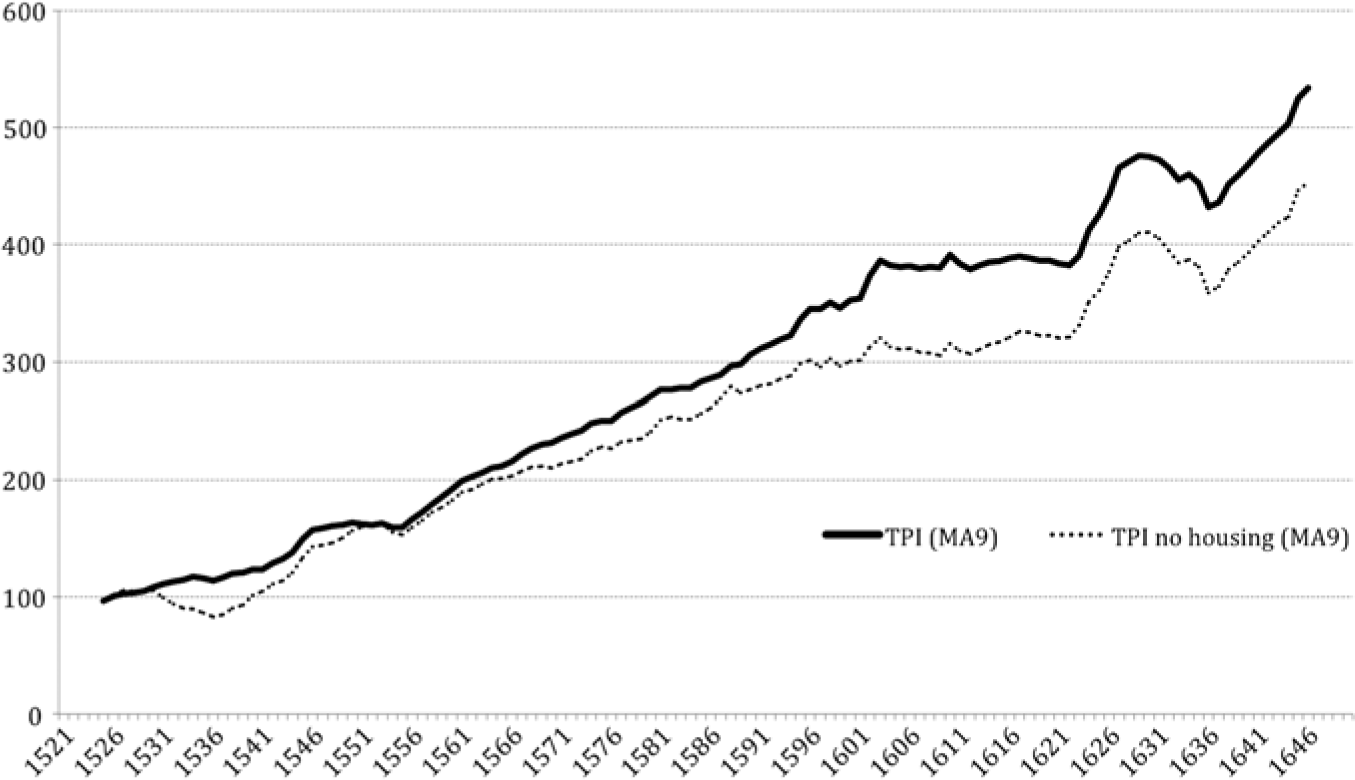
Things changed in the first half of the seventeenth century. The TPI rose by 40 percent between 1601–9 and 1642–50. Clothing and footwear doubled in price (100.8 percent), whereas food and wine values grew by 46 percent and 49.1 percent, respectively. Within the food subcategory, the cost of wheat and olive oil registered their lowest increase (around 33 percent in both cases). Fuels prices barely ascended by 18 percent, while housing was the only item that cheapened in absolute terms (–8.1 percent). Consequently, these two last categories became less expensive with respect to a basic food such as grain. This seems to match the trend followed by relative prices in several modern European cities and regions (Hoffman et al. Reference Hoffman, Jacks, Levin and Lindert2002).
Both the significant fall in urban rent and the decrease in the relative price of wheat and wine would have been caused by the demographic decline of Toledo, especially intense in the first third of the century (Martz Reference Martz1983; Montemayor Reference Montemayor1996). This population loss seems to be evidenced, in turn, by a decrease in the region’s agricultural production (Sebastián Amarilla et al. Reference Sebastián Amarilla, García Montero, Zafra Oteyza and Bernardos Sanz2008), the incidence of some mortality crises (Pérez Moreda Reference Pérez Moreda1980; Pérez Moreda and Reher Reference Pérez Moreda, Reher and Fortea Pérez1997), a drop of competitiveness in the manufacturing sector (Andrés Ucendo and Lanza García Reference Andrés Ucendo, Lanza García, Truchuelo, López Vela and Torres Arce2015), and the emigration to Madrid, once the court was definitely settled in that city in 1606 (Drelichman and González Agudo Reference Drelichman and González Agudo2014; Martz Reference Martz1983; Ringrose Reference Ringrose1973, Reference Ringrose1985).
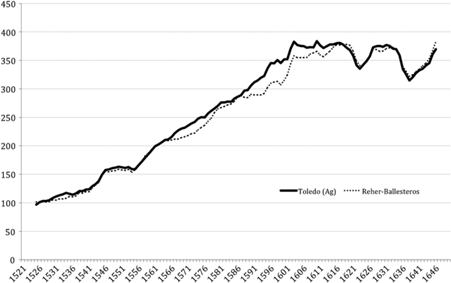
The inclusion of urban rent also seems to be noticeable when contrasting the evolution of the TPI with that of Reher and Ballesteros for New Castile (figure 3), taken from Hamilton (Reference Hamilton1983). Prices, expressed in grams of silver, grew by 282.6 percent in Toledo between 1521–29 and 1642–50, whereas they increased by 277.6 percent in New Castile. The greatest divergence between both indices took place at the end of the sixteenth century.
Toledo Price Index and Reher-Ballesteros Price Index for New Castile, 1521–1650, in grams of silver. Base 100 = 1521–30 average. Nine-year moving averages.

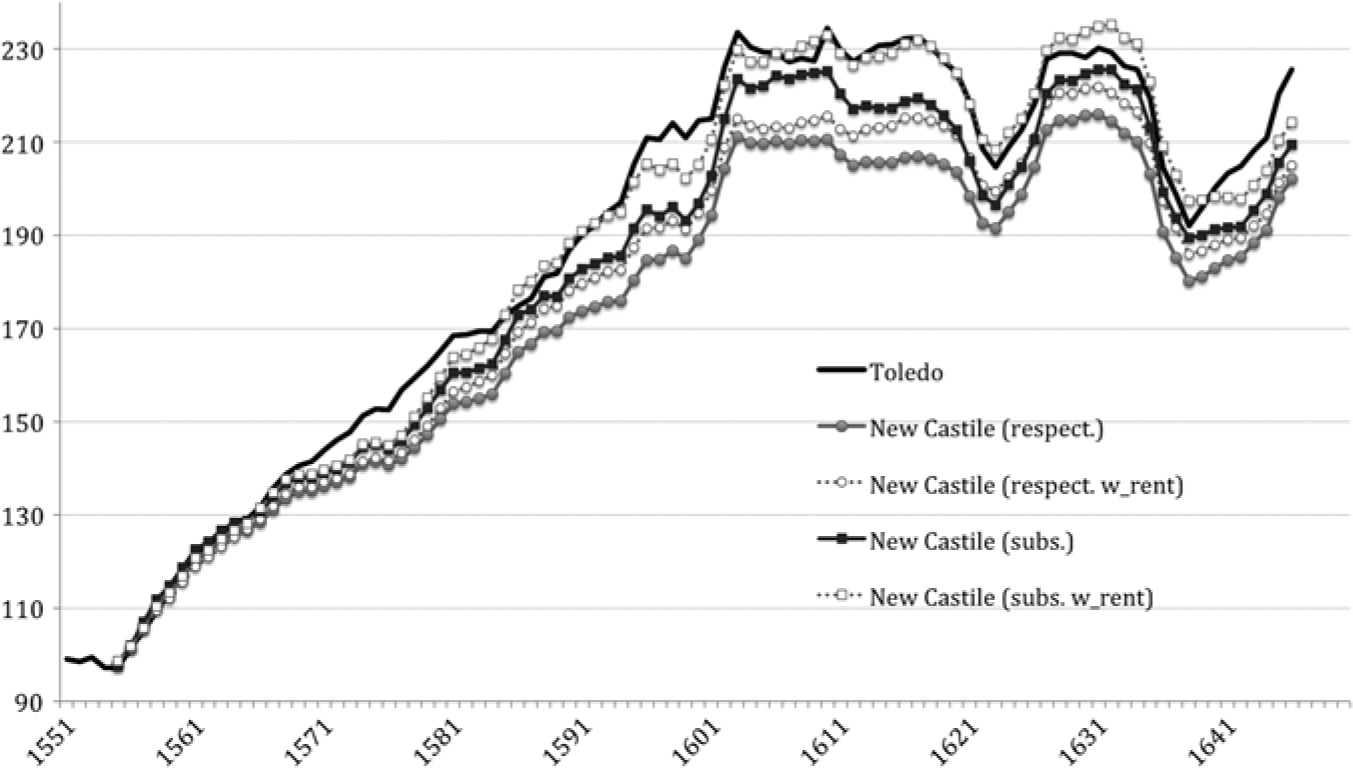
Figure 4 displays the trend of the TPI compared to that of Allen’s for New Castile. To do so, I reconstruct Allen’s respectability and subsistence baskets in this region, and replace Hamilton’s prices for wine, olive oil, linen, housing, charcoal, and yellow wax by the new Toledan quotations.Footnote 26 Between 1551–9 and 1642–50, the rise in prices was significantly higher in Toledo (132 percent) than in New Castile with the respectability basket (106.2 percent, and 107.8 percent when adding the rental cost of housing to the overall index). The growth of the TPI was also greater in comparison to Allen’s replicas with the subsistence basket (by 114.5 percent, and up to 117.2 percent with urban rent). Large gaps remain in the early and middle sections. These are likely the result of Allen’s eliminating several important staples from the consumption basket.
Toledo Price Index and Allen’s Price Indices for New Castile, 1551–1650, in grams of silver. Base 100 = 1551–60 average. Nine-year moving averages.

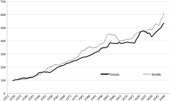
The new index allows for a contrast with that of Seville (SPI), the most recent of the second-generation indices in Spain, which uses a similar methodology and includes urban rent in its consumption baskets.Footnote 27 As figure 5 shows, the growth of the SPI was greater than the TPI between 1521–29 and 1642–50 (525 percent vs. 453 percent). The evolution of both indices was quite similar until the eighties. After that, a divergence in favor of Seville began, coinciding with a period of increasing imports of precious metals from America that reached their peak in the last decade of the century. It is also remarkable, as revealed in figure 5, the slight delay of the Toledan price fluctuations with respect to the Sevillian until the 1640s. This could be explained by the commercial supremacy of Seville, where the American treasure began to circulate. Soon after, it influenced the economy of New Castile, the closest region to Andalusia in trading terms (Hamilton Reference Hamilton1983).
Toledo Price Index and Seville Price Index, 1521–1650. Base 100 = 1521–30 average. R2 = 0.93.

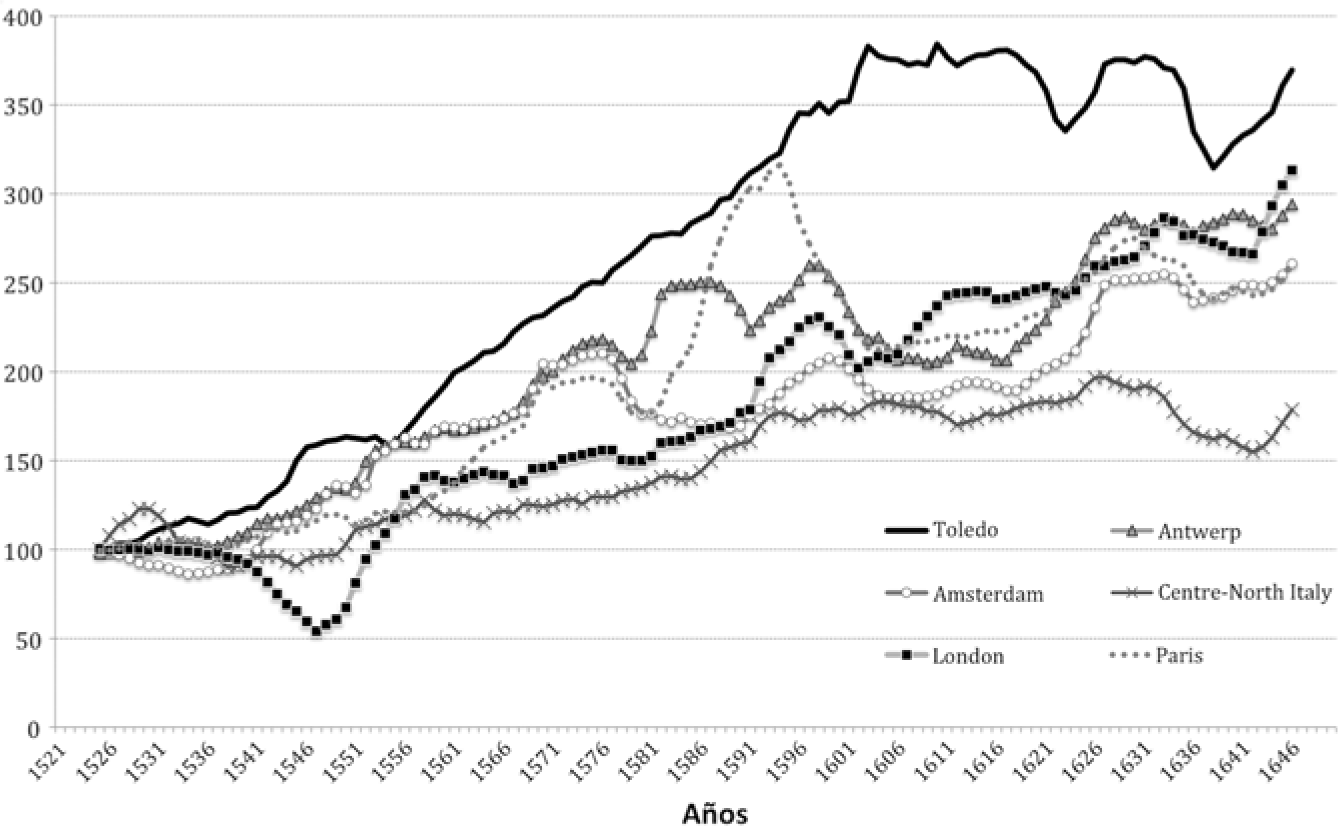
The growth of the Toledan prices was also significant when contrasted with those of some European cities (see figures 6.a and 6.b). Once transformed into grams of silver, both the TPI and Allen’s (Reference Allen2001) replica show higher increases (120.7 percent and 90.4 percent, respectively) than some European cities and regions’ indices between 1551 and 1596 (see figure 6a), such as London (88 percent), Antwerp (53.1 percent), Centre-North Italy (52.3 percent), and Amsterdam (29.6 percent). The only exception is Paris (103.2 percent).
Price indices in several European cities and regions, in grams of silver, 1551–1650. Base 100 = 1551–60 average. Nine-year moving averages.

Price indices in several European cities and regions, in grams of silver, 1521–1650. Base 100 = 1521–30 average. Nine-year moving averages.

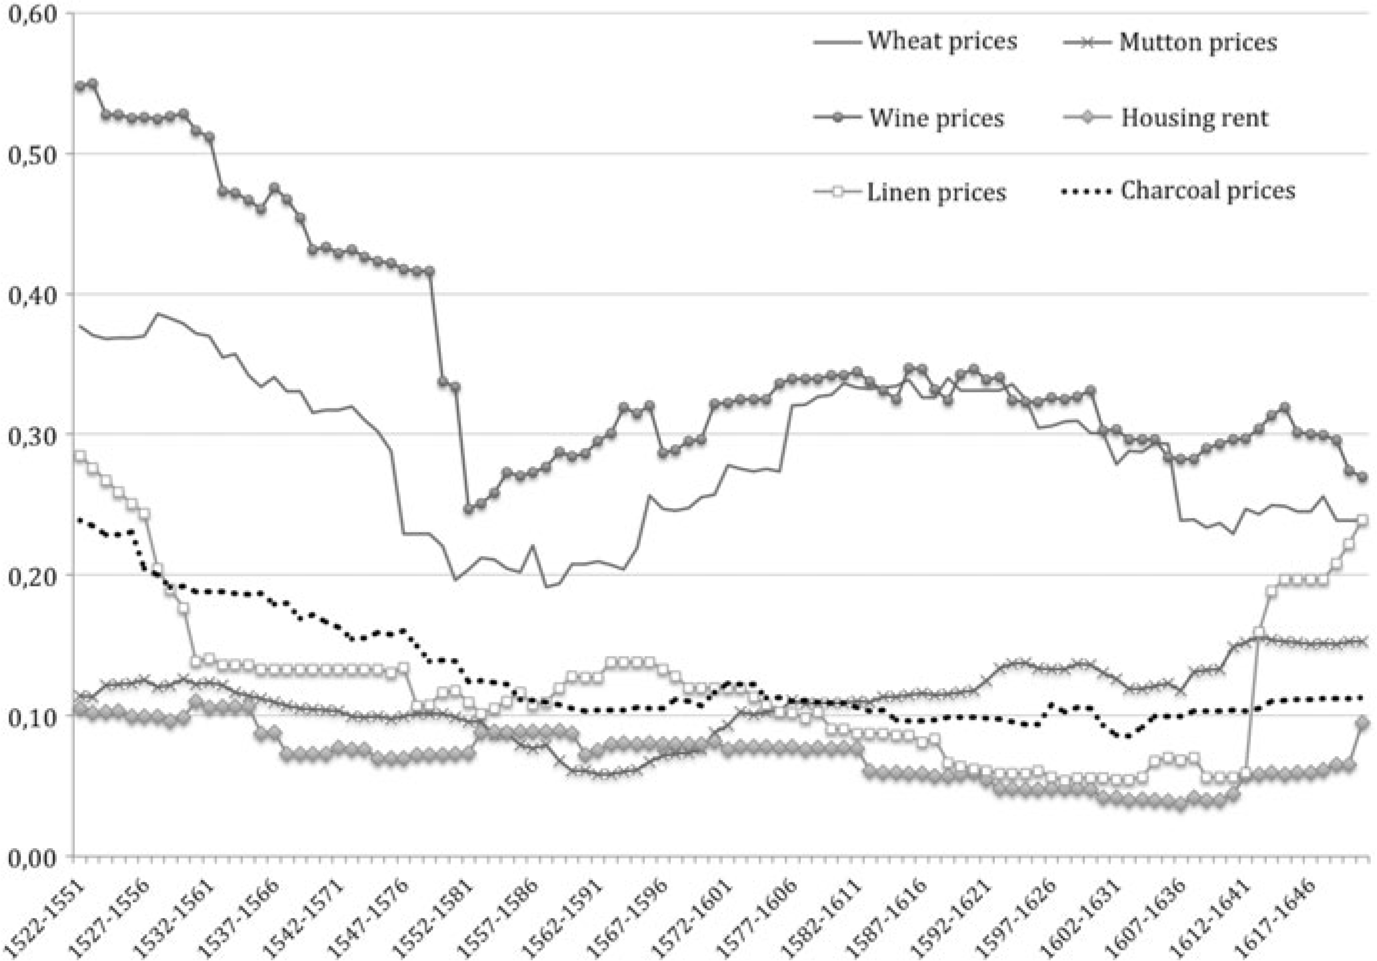
Figures 7 and 8 display the volatility of prices in Toledo.Footnote 28 The moments of greater instability are found at the beginning of the series. Several factors could explain this high level of volatility: (1) a more limited number of products in the consumer basket for 1521–50; (2) poor market integration during this period (Marcos Martín Reference Marcos Martín2000); and (3) the possible disruption of existing commercial traffic following the revolt of the Castilian Comunidades (1520–21). Standard deviation declined since the beginning of the period, recording a minimum value in 1552–81. From then on, fluctuations grew as far as 1581–1610, and fell again until 1610–39. Although instability rose significantly between the 1610s and 1650, it would never reach the maximum levels of the previous century.
Standard deviations of the logarithmic variation rates for the Toledo Price Index, 1521–1650. Base 100 = 1521–0 average. Index numbers and thirty-year moving periods.
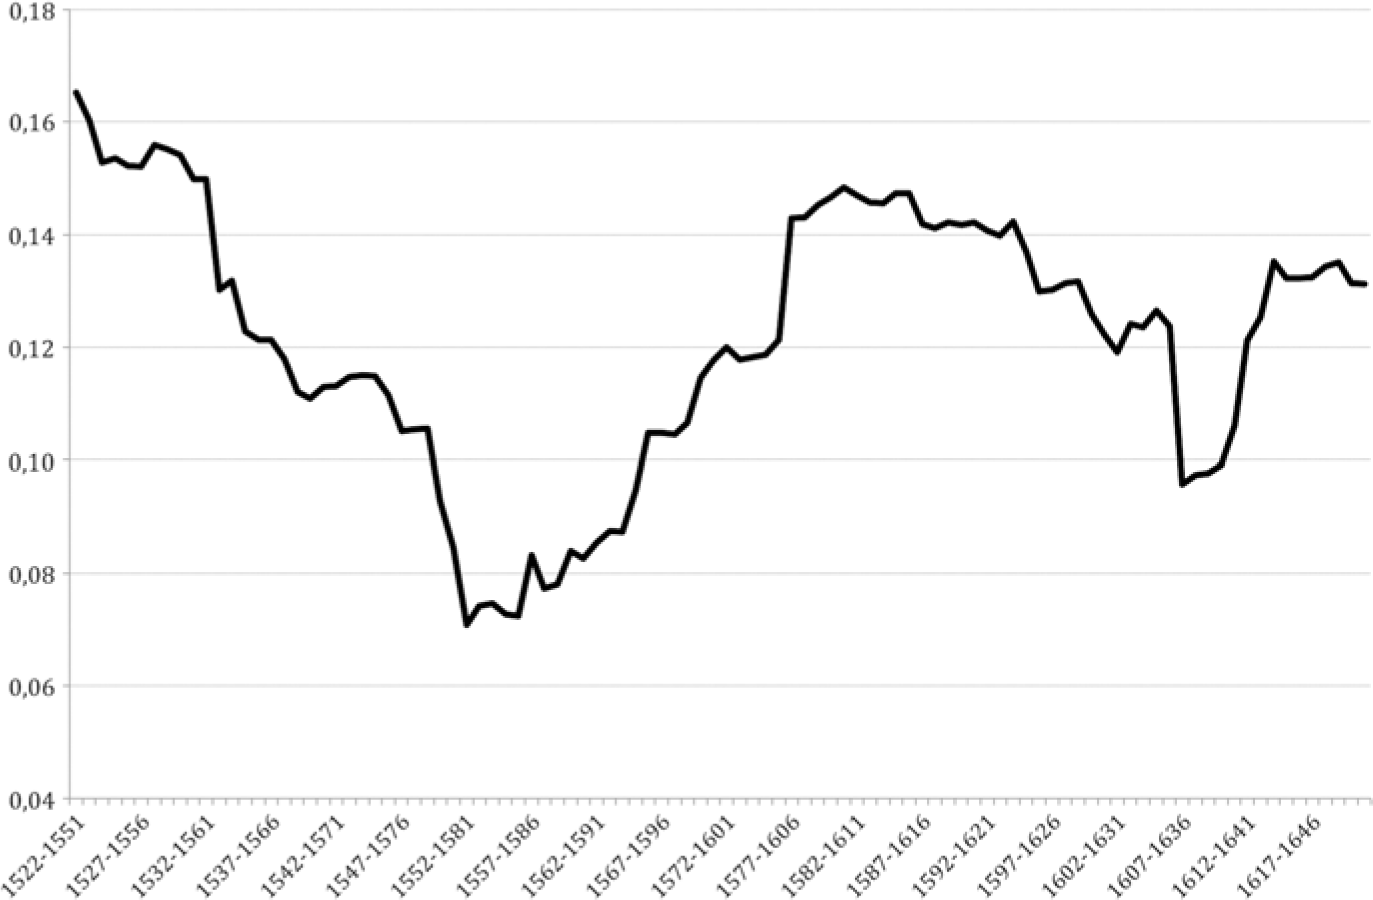
Standard deviations of the logarithmic variation rates for the Toledo Price Index, 1521–1650. Base 100 = 1521–0 average. Index numbers and thirty-year moving periods.

Focusing on the composition of the Toledan baskets, the most variable prices were, by far, those of wine and wheat (see figure 8), whereas housing rent was the most stable component. A declining instability in grain prices, although not necessarily continuing, has also been observed in other European cities (Persson Reference Persson1999). Regarding mutton prices, their volatility was the only one that rose over the period. As for linen prices, they became more variable since the 1610s, after a decreasing tendency. Such sharp movement in textile prices should be interpreted carefully; a possible change in its quality or in its units of measurement should not be discarded.
Lastly, Allen’s welfare ratios for unskilled construction wages have been computed for Toledo.Footnote 29 With the TPI and the new consumption baskets, the average welfare ratio for 1551–1600 is 0.57. This is significantly lower than the one obtained by using Allen’s data (0.71): a difference of 13.5 percent.Footnote 30 Bearing in mind the need for more wage registers in the city and the cautions noted by Drelichman and González Agudo (Reference Drelichman and González Agudo2014) on Allen’s assumptions, these results confirm the fact that a low-income laborer would have barely afforded a subsistence basket during the golden age of Toledo, had he not relied on complementary earnings such as those from alternative activities and/or female and child labor.
Conclusion
The construction of a general price index for Toledo between 1521 and 1650 has been useful to analyze the price trend in one of the most relevant Spanish cities during a period for which literature on living standards is scarce. The new data collected from two different institutions (city council and Cathedral chapter) not only allow for the addition of new items in the consumer baskets but also the coverage of information gaps and the replacement of some “problematic” series from Earl J. Hamilton’s book on the price revolution in Spain. The main contribution in this regard is the inclusion of new prices for of food (olive oil), wine, manufactured products (linen, esparto, hemp, and paper), housing rent, construction materials (bricks and tiles), and fuels and lighting (charcoal and olive oil). The TPI is based on a greater number of price series (from 17 to 26, depending on the period) compared to the preceding indices for New Castile, whose data were mainly taken from Toledan institutions.
The new index provides two key improvements with respect to the so-called second-generation price indices. First is the construction of three different baskets (1521–50, 1551–1600, and 1601–50) that reflect possible variations in the consumption patterns of low-income families. To do so, several primary sources and the European literature on the history of consumption have been considered. Second is the inclusion of housing in the baskets. Rent expenditure represented 7.35 percent and 8.75 percent of the family income in 1520 and 1650, respectively. These shares are not far from those recently calculated by Drelichman and González Agudo on Allen’s indices (9.5 percent on average), and by González Mariscal for Seville (6.8–17.4 percent) in the sixteenth century. However, they are significantly higher than those proposed by Horrell, Allen, or López Losa, with an upper bound of 5 percent for the early modern period.
Prices in Toledo multiplied by 5.5 between 1521–29 and 1642–50. In the sixteenth century, the growth of the Toledan index is slightly higher than that of Reher and Ballesteros for New Castile, once quotations are translated into grams of silver. These differences confirm the importance of including new items in the consumer baskets.
In Toledo, the greatest inflationary pressures took place in the second third of the sixteenth century, coinciding with the economic and demographic rise of the city. Housing, wine, and food were the products whose prices increased the most. During this stage, the influence of housing was remarkable: if urban rents are omitted, the Toledan index multiplies by 3.1 instead of 3.5 between 1521–9 and 1592–1600. The growth in prices, together with a possible decrease in urban real wages in the second half of the sixteenth century, could force low-income families to increase their additional earnings and to readjust their consumption patterns.
The situation changed notably in the first half of the seventeenth century. Prices in Toledo barely rose by 40 percent between 1601–9 and 1642–50. Relative quotations of basic foods such as grain or wine declined with respect to those of more expensive products in caloric terms. In the meantime, housing and fuels cheapened in relation to grain, matching the trend followed in other parts of Europe. The city’s depopulation seems to be, in part, behind these trends, especially during the first third of the century.
Although there was a trend toward stability between 1521 and 1650, the greatest moments of price volatility in Toledo took place during the first half of the sixteenth century. The most volatile quotations corresponded to wheat and wine, while housing was the most stable item.
During this period, some differences can be observed when contrasting the evolution of Toledo with that of different European cities and regions. On the one hand, prices grew less in Toledo than in Seville between 1521–29 and 1642–50. The gap between both cities occurred in a period of increasing imports of precious metals from America, which would peak in the late sixteenth century. On the other hand, the rise in prices during the Toledan golden age was higher than in some other western European cities such as London, Amsterdam, or Antwerp.
Urban growth seems to help explain the price trends from more than a single viewpoint, although the debate on the price revolution requires to be split in two, as suggested by Nadal (Reference Nadal1959): (1) identifying all possible causes and (2) determining their degree of responsibility and interaction. Other than population growth and the arrival of the American treasure, are there any additional causes involved in the price movement? Urbanization inferences in close-by cities seem to exert a substantial grip on the matter. Thus, new insights in such respects must be necessarily given for further research, especially in early modern manufacturing cities such as Toledo.
Finally, the recalculation of welfare ratios with the new TPI suggests that a low-income laborer in Toledo would have barely afforded a subsistence basket during the golden age of the city if he had not relied on the family’s complementary earnings. Seeking to set some basic conditions to allow for comparative analysis is one of the main goals of welfare ratios. Yet, as price-index construction improves for modern Europe, estimating more realistic standards of living at the local level also becomes desirable. Thus, starting from the point that this work has reached, future inquiries will be carried out on both real wages and the contribution of female and child labor in Toledo.
Supplementary material
To view supplementary material for this article, please visit https://doi.org/10.1017/ssh.2019.2.