

1. INTRODUCTION
The empirical question is whether people value facing distinct platforms when they vote. (Przeworski Reference Przeworski2003: 265)
Intuitively it would seem that choice is important for democracy. Sadly, democratic theory tells us little about why this should be the case. In addressing this deficit, Przeworski (Reference Przeworski2003) makes a strong case for the democratic value of choice, on the grounds that it allows as many people as possible to submit their preferences to the public realm. Although this provides an answer to the normative question of whether democrats should value freedom to choose, the empirical question, whether people actually do value facing distinct platforms when they vote, remains wide open. I seek to remedy that situation by systematically addressing the question using cross-national survey data from the Comparative Study of Electoral Systems (CSES). Stated somewhat simplistically then, the question I ask is: Does satisfaction with democracy depend on the choices that are available? More specifically, in this paper I investigate whether people care about the number and/or the substance of the choices that are available to them when they vote.
To begin at the end, the analysis in this paper offers strong support for Przeworski's argument that what voters care about is expressing their preferences – satisfaction with democracy is significantly higher for people who are able to vote for a party that represents their views. Therefore what matters most to voters is the substance of electoral choices. Although the number of choices also matters, the significance of this effect is conditional on being able to vote for a party that represents one's views, or on voting for the winner. In section 3 I discuss the data and analysis that inform these conclusions, and present the results in much greater detail. Before doing so, however, it is worth considering why people should value freedom of choice.
2. THE VALUE OF FREEDOM TO CHOOSE
To briefly summarize the discussion that follows: There are different ways to conceptualize and evaluate the freedom that is offered by sets of choices, which essentially boils down to whether we care about the number or the substance of the options that are available. Amartya Sen argues strongly that these two characteristics cannot be taken to be independent. For its considerable worth, however, Sen's argument still does not provide an answer for how we can choose between the two, if ever we must. Relating the question specifically to democracy, Przeworski makes a normative case for the value of the number of choices, from which it follows that democrats should indeed value having more choices, not just the best choices. Importantly, this normative case is based on the claim that what voters themselves value is the ability to publicly express their preferences. The following section reviews this discussion in greater depth, in order to motivate the empirical question that is the focus of this paper.
2.1 Why should people value freedom of choice?
Freedom of choice can be seen to have both intrinsic and instrumental value. By the latter, freedom of choice is valuable in terms of what it permits to achieve. As Sen (Reference Sen1988) points out, this instrumental role of choice seems fairly obvious. For example, our quality of life must depend in part on how free we are to choose different, potentially better, ways of living. The alternative, that freedom of choice has some intrinsic worth, implies that there is some value to choosing itself, beyond simply the outcome that a choice permits. The two are by no means mutually exclusive, but the notion that choice has intrinsic value certainly seems to require more justification.Footnote 1 Perhaps more importantly though, these contrasting approaches to freedom imply different ways to conceive of and evaluate the freedom that is offered by alternative sets of choices.
2.2 What is it about freedom of choice that individuals value?
The formal literature on evaluating choice sets suggests two rules, cardinality and effective freedom, which imply very different ways to evaluate the extent of freedom offered by alternative choice sets. By the cardinality rule, a larger opportunity set is better than a smaller one. Let X be the universal set, with typical alternatives x, y, z, etc. Then by cardinality you prefer the set {y, z} to {x}, irrespective of how you rank the individual elements, because the former offers more alternatives. In contrast, by the effective freedom rule the set that contains the best element is preferable, no matter how large the set. Therefore if x ∈ X is the element you would choose from the full set X (the ‘best element’), then {x}≻{y, z} because you prefer any set that contains x to any that does not, no matter how large the sets are.
Clearly then, the instrumental approach to freedom of choice sides firmly with effective freedom. If the value of choice equates simply to the value that choice permits to achieve, then cardinality is unimportant. But if there is some intrinsic value to freedom of choice, if choice matters per se, then we need to incorporate cardinality. The problem that follows is whether these two approaches can be reconciled, and unfortunately the answer seems to be that they cannot, at least not with much success. As Przeworski (Reference Przeworski2003) notes, the solutions that have been offered simply suggest that we either lexicographically prefer one or the other, and use the alternative to break ties, which is somewhat unsatisfying.Footnote 2 Therefore the question we need to consider is how we can either effectively combine them, or more discerningly choose between them. For this, the most important insights have come from Sen, who rejects both rules in their pure forms.
Sen (Reference Sen1991) highlights the inherent contradiction between the cardinality and effective freedom rules by considering the special case of unit-sets (sets containing only a single element). He recognizes that intuitively all unit-sets would seem to offer the same amount of freedom (none), which would support the cardinality rule (by cardinality one is indifferent between unit-sets, so {x} ~ {y} for ∀x, y∈X).Footnote 3 But the problem for Sen is that such a straightforward ‘preference-independent’ approach ignores counterfactual choices (what one would have chosen). Thus, if we still take x to be your ‘best element’, Sen argues that you are more free when faced with set {x} than with set {y}. You may still not be free to choose between x and y, but you are free to enjoy your most preferred element. At the same time, however, Sen does not reject the value of cardinality. Rather, he recognizes that people are less free if faced with the choice set {x} than the set {x, y}, even if the preferred option x is available from both. For Sen, although {x} and {x, y} may imply the same value in terms of effective freedom, the fact that set {x} does not allow for freedom to choose means that something is lost.
Thus the intrinsic value of choice is justified on the basis of agency. For Sen, agency, as the exercise of choice, is important because something that is chosen is valued differently from something that is not. Therefore choosing itself has value, because the very existence of choice ‘refines’ what is chosen. Sen illustrates this notion with the example of choosing not to eat when food is available (fasting) as opposed to not eating because one has no food (starving). In both, the actual outcome is the same (not eating), but the element itself (fasting or starving) is quite clearly something different. Therefore, ‘[c]hoosing to do x when other alternatives are available cannot be identified with simply doing x no matter what the alternative possibilities are’ (Sen Reference Sen1988: 290). For Sen then, the intrinsic value of choice enters via the refining effect of choice itself on the value of what is chosen.
Accompanying this notion of ‘refined functioning’ is an axiom which incorporates both cardinality and effective freedom, which Sen terms ‘dominance-set evaluation’ (Sen Reference Sen1985). This axiom states that, in words, if a set A contains the subset A′ with the same number of elements as a set B, and every element of A′ is at least as good as the corresponding element of B, then A is at least as good as B. As a result, the axiom successfully combines the key elements of both cardinality and effective freedom, such that an opportunity set which offers more choices AND enables you to achieve your preferred outcome provides more freedom. For example, if x ≻ y ≻ z, then by dominance-set evaluation, {x, y} ≻ {y, z}, {x, y} ≻ {x}, and {x} ≻ {y}, which is what we want. However, and as Sen himself notes, the requirements of this axiom are very demanding, and its coverage is very limited. Indeed, Przeworski labels it the ‘weak freedom axiom’, because it does not allow for comparison of sets if a single element of B is better than any element of A′ (Przeworski Reference Przeworski2003: 271). This is important for democracy because it means that the axiom says nothing about the relation between {x} and {y, z}.
2.3 But why do we care about the relation between {x} and {y, z}?
The key point from Sen is that the intrinsic value of choice relates to the agency that it enables; choice is valuable because it allows us to cause outcomes, and outcomes that we cause are valued differently from those that we do not. But in the case of voting, individuals do not cause outcomes, because in a mass electorate the outcome will almost certainly be the same whether or not any particular individual participates. In the 2001 Cape Verde presidential elections the winning candidate won by a margin of only 12 votes (out of 153 406), which is just about as close as a national election gets. And still, the outcome would have been the same if any single individual had chosen not to vote.Footnote 4 In the absence of agency, the existence of choice would thus appear to be devalued for democrats. Yet Przeworski argues that, as a voter, choice remains valuable because it allows me to cause my views to enter into the public domain. Although it may not affect the outcome directly, the act of voting enables my preferences to be recognized in the set of collective opportunities, thereby involving me in the political community (Przeworski Reference Przeworski2003: 274–277)
Thus for democrats, there is value in voting as choosing. And hence, if choosing has such normative (and instrinsic) value, democrats should care whether the choice set (the range of platforms put forward in an election) allows as many people as possible to express their preferences. This brings us back to how we evaluate the relation between {x} and {y, z}. To follow Przeworski's argument, in making collective decisions we can think of the median, m, as the optimal outcome, because it ‘minimizes the sum of Euclidian distances over all individuals’ (Przeworski Reference Przeworski2003: 277). So for democrats, m represents the best outcome in terms of effective freedom. But if all parties offered m voters would have no choice. And because not all voters' preferences are represented by m, some voters will not be able to cause their views to enter into the public domain. Thus a larger choice set including m, say {m-k, m, m+k}, which allows for the same effective freedom and increases cardinality, is superior because it enables more voters to express their preferences, and thus to be effectively included in the political community. As long as m is included, therefore, the value of the choice set is increasing in its cardinality. However, the issue of cardinality versus effective freedom returns when the alternatives are {m} and {m-k, m+k} (or, {x} and {y, z}).
Given the democratic value of choice just expounded, we now have a means by which to evaluate the relation between {x} and {y, z}. If we take the value of choice for a democrat to be k, then a democrat with ideal point xi will be indifferent between {xi} and {xi − k, xi + k}. Extending this logic to a population of democrats with some distribution of ideal points, Przeworski shows that if choice is valued in this way, then for democrats, ‘freedom of choice does not require everyone's peak preference to be present among the proposed platforms’. Rather, what democrats should care about is, ‘whether the set of political opportunities allows as many people as possible to exercise their preferred degree of choice.’ (Przeworski Reference Przeworski2003: 278). Note that Przeworski is not claiming that choice is valued in this way. Rather, his point is to establish that freedom of choice is valuable to individuals in a democracy because, although they may not cause the outcome, choice allows for the act of expressing their preferences, which itself is of value. From this, it follows that choice in terms of cardinality should be valued by democrats, because it increases the proportion of individuals who are able to effectively express their preferences.
The empirical question then, which Przeworski very generously leaves for survey researchers to address, is whether voters are themselves ‘democrats’ in this way. That is, whether voters actually do care about the range of electoral choices that is available, or whether they just care about effective freedom. And thus we come to the contribution of this paper.
2.4 The empirical question
By the logic above, effective freedom for individual voters should not be seen in terms of electoral outcomes, because no individual voter causes these. Rather, what I cause as a voter is the public expression of my preferences. So in terms of effective freedom, as a Przeworskian voter what I should care about is being able to vote for a party that represents my preferences. Is this what voters actually do care about? Or, do voters simply care about ‘winning’, about the option they choose being the outcome of the collective choice? At the same time, if I am a Przeworskian democrat then I should also value cardinality as a substitute for effective freedom, such that having a sufficiently broad range of electoral alternatives is equally valuable to me as being able to vote for a party that I feel represents my preferences. Are voters democrats in this sense?
The preceding theoretical discussion therefore provides us with some clear empirical questions to address. We want to know whether voters care about the cardinality of choices available to them in elections, or about whether these choices provide them with effective freedom. What we are interested in then is the relative value that voters place on the size as opposed to the contents of the electoral menu - is satisfaction with the electoral process affected by the number or the substance of electoral options? Moreover, we want to know whether this is actually the kind of achievement that voters care about – do voters care about expressing their preferences (effective freedom), or about winning, or both? And finally, we want to know whether these preferences are conditional. Does the substance of electoral options affect whether individuals care about the numbers of options that is available? And, does winning affect whether, and how, individuals care about choice? Fortunately, cross-national survey data from the CSES offers some answers to these questions.
3. DO VOTERS CARE ABOUT CARDINALITY OR EFFECTIVE FREEDOM?
3.1 Data
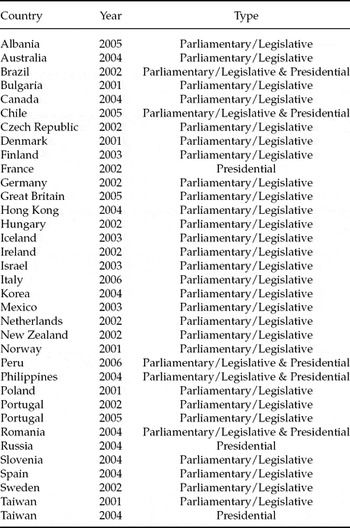
The CSES dataset comprises individual, district, and country-level data for over 50 countries. The individual-level data come from post-election surveys, which include a common module of questions related to the elections. Module 2 provides data from 40 surveys carried out in 38 countries between 2001 and 2006. These data therefore represent a powerful resource with which to investigate whether voters care about the number or the substance of electoral choices.Footnote 5
The dependent variable for the following analysis is generated by a straightforward question about satisfaction with democracy.Footnote 6 From this I create a dummy variable, coded 1 if the respondent is either very satisfied or fairly satisfied with democracy, and 0 otherwise. The question that is being asked therefore is what factors affect the probability that a respondent is satisfied with democracy.Footnote 7 The independent variables of interest are measures of the substance and the number of choices available to voters. Effective freedom is captured with an indicator of whether the respondent feels there is a party that represents her views. This allows us to explore whether satisfaction is higher when a preferred option is available.Footnote 8
As a measure of cardinality I use respondents' location of different parties on a left-right scale to quantify the number of distinct choices available to the respondent. Respondents were asked to place up to ten named parties on a left-right scale, from 0 to 10.Footnote 9 The cardinality variable is a count of the number of different points on this left-right scale at which the respondent places at least one party.Footnote 10 By counting all the parties located on one point as a single option, this variable intentionally incorporates similarities among the parties in an election, so as to quantify the number of distinct platforms that people face when they vote. In order to assess whether voters care about winning, I include an indicator for whether or not the respondent voted for a party that entered government after the election (winner). I also include an indicator for whether the respondent abstained from voting (abstainer), so as not to conflate these people with those who voted for a party that did not win. In line with the empirical literature on satisfaction with democracy, I include individual-level measures for income and education, which might affect satisfaction with democracy. I also include basic demographic controls for age and gender.Footnote 11
3.2 Do voters care about the number or the substance of choices?
First, let us consider how satisfaction with democracy is affected by the number and substance of electoral choices. Of those who answered the question about satisfaction with democracy (93% of all respondents), 56% said that they were either very satisfied or fairly satisfied with the democratic process. Breaking this data down, it is possible to gain a quick intuition about the relative importance of cardinality and effective freedom by looking at some summary statistics. For simplicity I create a dummy variable (choice) by dichotomizing the cardinality variable into those respondents who perceive only a single distinct party platform, and those who perceive more than one. This divides the respondents into voters who feel they have multiple distinct party platforms to choose from as opposed to those who feel they have no real choice at all.
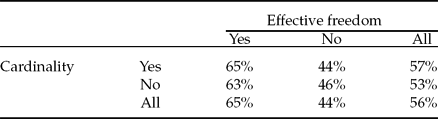
Table 1 presents summary statistics for levels of democratic satisfaction for respondents with and without cardinality and effective freedom. So, for example, of those respondents who perceived there to be more than one distinct party platform and who felt there was a party that represented their views, 65% were satisfied with democracy. What is most clear from Table 1 is that voters care much more about effective freedom than they do about cardinality. Respondents are about 20 percentage points more likely to be satisfied with democracy if they feel there is a party that represents their views. In contrast, having choice seems to matter very little for satisfaction with democracy. As such, these respondents appear to be Przeworskian voters – the fact that it matters to them that a party represents their views is fully compatible with the idea that what voters care about is being able to effectively express their preferences when they vote (I will return to this later).
Summary statistics of per cent satisfied with democracy, by cardinality and effective freedom.
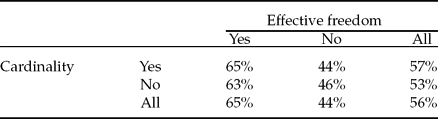
Note: Table 1 shows the percentage of respondents satisfied with democracy, by whether or not they have Cardinality and Effective Freedom. Cardinality = No if the respondent perceives only a single distinct party platform, Yes if she perceives more than one. Effective Freedom = Yes if the respondent feels there is a party that represents her views, No if not.
Table 1 also offers insight into how voters view the relation between {x} and {y, z}. Of respondents who can vote for a party that represents their views but who don't feel they have any real choice (who effectively face the choice set {x}), 63% are satisfied. Of those who have cardinality without effective freedom (so who face {y, z}), only 44% are satisfied. From this first glance at the data then, it would seem that {x} ≻ {y, z}.
This glance also suggests that the effect of cardinality may be conditional on effective freedom; of respondents who feel that a party represents their views, those who perceive there to be at least some choice between distinct party platforms are on average 2 percentage points more likely to be satisfied with democracy than those who feel they have no choice at all. Although this difference is slight, a 2-sample test of proportions gives confidence that the difference is statistically greater than zero, at the 1% level. By contrast, of respondents who do not feel that a party represents their views, those who believe that they have a choice between distinct party platforms actually seem less likely to be satisfied with democracy than those who perceive no choice, although this difference is not statistically significant (a 2-sample test of proportions shows that we cannot be confident that this difference is less than zero, at the standard 5% level). Therefore, this suggests that {x, y} ≻ {x} ≻ {y}≽{y, z}. If this is indeed the case, cardinality may in fact not be a substitute for effective freedom, because in the absence of effective freedom, cardinality may not matter.
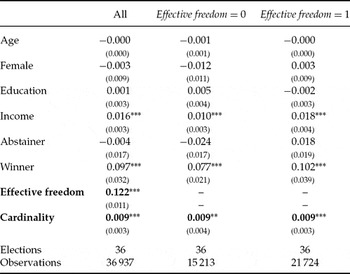
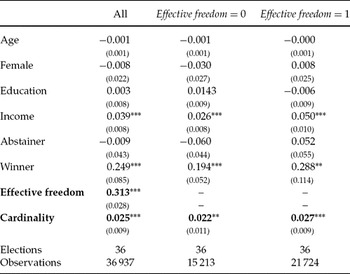
Estimating a probit model gives a much fuller and more precise picture of the relationship between choice and satisfaction with democracy. To do so, I regress the binary Satisfaction with Democracy variable against the key variables of interest, whether or not there is a party that represents the respondent's views (Effective Freedom), and the number of distinct party platforms that the respondent perceived (Cardinality). I also include basic demographic controls (for age, gender, level of education, and income), and the dummy variables Winner and Abstainer.Footnote 12 All regressions include election fixed effects, and standard errors are clustered by election.Footnote 13 Given the suggestion from Table 1 that the impact of cardinality may be conditional on effective freedom, I estimate the model first for all voters, and then separately for those who feel that a party represents their views and for those who do not. Results are presented in Table 2.Footnote 14
Probit models of satisfaction with democracy – marginal effects.

Note: Standard errors in parentheses. *p < 0.10; **p < 0.05; ***p < 0.01. The dependent variable is satisfaction with democracy. All models include election fixed effects, with standard errors clustered by election.
The results in column 1 show that effective freedom and cardinality both relate to a greater likelihood of individuals being satisfied with democracy. With regards to effective freedom the impact is substantial. A respondent is more than 12 percentage points more likely to be satisfied with democracy in the presence of a party that represents her views. Certainly then, there seems to be some truth in Przeworski's intuition about voters – people do care about being able to vote for a party that represents their views. In addition, it appears that voters may also be Przeworskian ‘democrats’, in the sense that they also care about the cardinality of choices on offer – the likelihood of a respondent being satisfied with democracy increases by slightly less than 1 percentage point for each distinct party platform that she perceives. Although not huge, this effect is statistically significant at the 1% level. On this evidence then, it would appear that voters care about both cardinality and effective freedom.
Of course, these elements of choice are not the only factors that affect satisfaction with democracy. Individuals with a higher income are (perhaps unsurprisingly) more likely to be satisfied with the way democracy works in their country. And, in line with the existing empirical literature, people who voted for a party that subsequently entered the government are also much more likely to be satisfied with democracy. As Przeworski suggests then, people whose preferred alternative is not the outcome of the collective choice are more likely to be dissatisfied with the electoral process, a point we will return to shortly. Even controlling for these factors, however, it is clear that people care a great deal about both the number and nature of the choices available to them when they vote. Effective freedom, in terms of being able to vote for a party that represents your views such that you can cause your preferences to enter the public domain, has a significant impact on satisfaction with democracy. And, as well as this, people also care about the range of electoral choices that are on offer.
The results presented in Table 1 suggested that the effect of cardinality may be conditional on effective freedom, such that a respondent's satisfaction is only influenced by the number of distinct electoral options available if she felt that one of those options represented her views. Statistical analysis allows me to investigate this possibility more rigorously. I do this by stratifying the sample according to the Effective Freedom variable, and then estimating separate probit models for respondents who do feel that a party represents their views, and for those who do not. The results in columns 2 and 3 of Table 2 show that doing so provides no evidence of such conditionality. The effect of cardinality is of precisely the same magnitude (0.9%), and significant at the 5% level at least, irrespective of whether respondents felt that a party represented their views. These results therefore suggest that cardinality may indeed be a substitute for effective freedom; on this evidence it seems possible that having a sufficiently broad range of electoral alternatives could be equally valuable as being able to vote for a party that represents one's preferences.
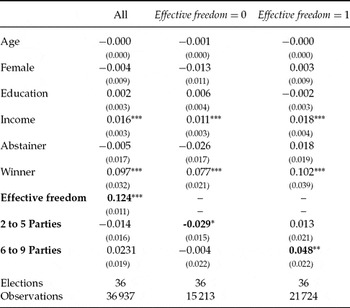
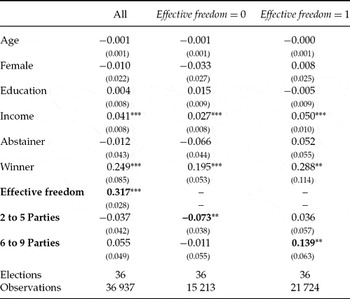
It is necessary, however, to take note of a potential problem with the cardinality variable as it has been used thus far. Entering the number of choices as an ordinal variable as I have been doing assumes that the effect of cardinality is linear, and therefore ignores any possible heterogeneity in the effect across the range of the cardinality variable. One way to investigate this heterogeneity is to divide the cardinality variable into categories and use dummy variables to estimate the effect of different numbers of distinct party platforms.Footnote 15 Therefore Table 3 presents marginal effects from probit models in which the cardinality variable has been replaced with dummy variables for the categories 2 to 5 parties and 6 to 9 parties. The omitted baseline category is having only one distinct party platform.
Probit models of satisfaction with democracy – marginal effects.

Note: Standard errors in parentheses. *p < 0.10; **p < 0.05; ***p < 0.01. The dependent variable is satisfaction with democracy. All models include election fixed effects, with standard errors clustered by election.
The results in the first column of Table 3 show that when the model is estimated for all respondents together, the dummy variables are not statistically significant (it is worth noting that the Effective Freedom variable is unaffected). However, the fact that the signs of the effects for the category dummies point in opposite directions is intriguing, and begs further investigation. The results in columns 2 and 3 justify this additional exploration, and suggest that when viewed in this way the effects of cardinality are indeed conditional on effective freedom. For respondents who were able to vote for a party that represents their views, increasing the amount of choice from only one to between six and nine distinct platforms has a positive and significant effect on satisfaction with democracy (the probability of being satisfied with democracy increases by about 5 percentage points). In the presence of effective freedom, greater cardinality is appreciated. (Interestingly though, while still positive the effect is not significant if the increase in cardinality is smaller.)
In stark contrast, for respondents who feel that no party represents their views, increasing cardinality actually reduces democratic satisfaction. For these respondents, being faced with between two and five distinct party platforms as opposed to only one relates to a drop of about 3 percentage points in the probability of being satisfied with democracy, although this effect is only significant at the 10% level. (Again it is interesting to note that this effect is only significant for one of the category dummies.) These results suggest that rather than being indifferent to cardinality in the absence of effective freedom, as was the suggestion from the results in Table 1, when there is no party that represents one's views, having a range of options to choose from may actually be resented.
Why is this the case? One possibility is that the effect is a psychological one, whereby being offered agency without the possibility of getting what one actually wants is even more frustrating than having no agency whatsoever. Another possibility is that the different categories reflect something about the nature of political competition. It is possible that the average distribution of party positions relates to the different categories in some way, or that they affect the consensual nature of political decision making.Footnote 16 Whatever the answer, it is far from intuitive, and demands further consideration. What cannot be ignored is that when a more nuanced approach to cardinality is employed, the effects of this aspect of choice are conditional on effective freedom; the value of the number of available choices depends on the nature of those choices, such that a sufficiently broad range of options is in fact no substitute for a party that represents one's preferences.
3.3 Is it really just taking part that matters?
People may be dissatisfied with the electoral process for two distinct reasons, either because their most preferred alternative is not the outcome of the collective choice or because they are denied a chance to vote for what they most want . . . Not being able to vote for one's favorite option, however, is a deeper source of deprivation. (Przeworski Reference Przeworski2003: 277).
Up to now we have focused on how satisfaction with democracy is affected by the number and substance of electoral choices. But the results presented above show that Przeworski's intuition is correct - people also care about winning. Looking at the results in Tables 2 and 3, voting for the winner increases the probability of being satisfied with democracy by about 10 percentage points, which is almost as much as the effect of being able to vote for a party that represents one's views. This evidence supports Przeworski's claim; not being able to vote for one's preferred option does seem to be a deeper source of deprivation than not having one's preferred option be the outcome of the collective choice, albeit marginally so. As with effective freedom and cardinality, however, it is possible that these preferences are conditional. Not only may the number and substance of choices affect the value of winning, but winning may also affect how respondents value choice. Therefore, although the theoretical justification for considering how democratic satisfaction is affected by winning may be less compelling, it is important to investigate the impact of winning if we are to more fully understand how people value choice.
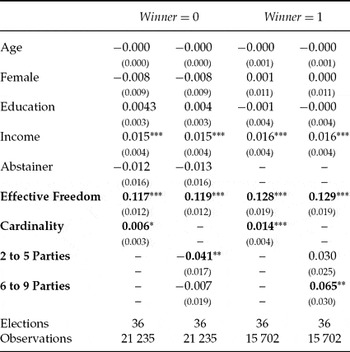
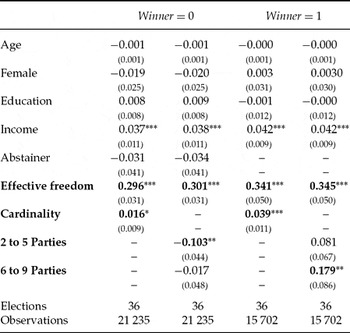
Let us start by looking at how winning conditions the importance of cardinality. Table 4 presents the marginal effects from the probit model of satisfaction with democracy, this time stratified by whether or not respondents voted for the winner. The conclusion is clear: winning changes the value of choice. As before, effective freedom, in terms of being able to vote for a party that represents one's views, is always important – the effect is independently strong and significant for all respondents. It is worth noting here that winning does seem to condition the impact of effective freedom slightly, with the effect of perceiving that a party represents one's views being about 1 percentage point larger for winners, perhaps because they have just been able to vote a party that represents their views into power, and thus have the added satisfaction of knowing that their views are now shared by the government.
Probit models of satisfaction with democracy, by winner – marginal effects.

Note: Standard errors in parentheses. *p < 0.10; **p < 0.05; ***p < 0.01. The dependent variable is satisfaction with democracy. All models include election fixed effects, with standard errors clustered by election.
However, the differences with regards to the effect of cardinality are much more stark. When we use the ordinal cardinality variable, for respondents who voted for the winner the probability of being satisfied with democracy increases by 1.5 percentage points with every additional distinct party platform from which the respondent can choose. In contrast, for those who did not vote for the winner, the effect is less than half the size, and is only significant at the 10% level. Unlike effective freedom, winning does indeed condition the effect of cardinality, in that a broader range of choices appears to be something of a luxury good that is only really appreciated if one voted for a party that entered government.
However, when the cardinality variable is broken into categories the effect of conditioning the number of available choices on whether or not respondents voted for the winner looks very similar to when they are conditioned on Effective Freedom. This time though, the effects are even larger. Respondents who voted for the winner are almost 7 percentage points more likely to be satisfied with democracy if the range of distinct party platforms increases from only one to between six and nine. For respondents who voted for a losing party, however, increasing the number of available options from one to between two and five reduces the likelihood of democratic satisfaction by more than 4 percentage points (although increasing it further has no significant effect). These differences are all significant at the 5% level.Footnote 17
Why should winning alter the value of cardinality in this way? The results add further weight to the idea that cardinality is valued as a type of luxury good, appreciated only on the condition that something else has also been achieved, be it voting for the winner, or being able to vote for a party that represents one's views. Of course, we are still left with the question of why more choice has a negative effect on democratic satisfaction for losers, and why this effect is only significant when increasing the range up to five parties, but not between six and nine. Likewise, it remains unclear quite why the winners' premium from greater choice only kicks in when the range of options increases beyond five parties. Some leverage over these questions might be gained by looking at the flip-side to this conditionality, that cardinality alters the value of winning.
From Tables 2 and 3 we have already seen that the value of winning is larger if the respondent was able to vote for a party that reflects her views, albeit only marginally (roughly 2.5 percentage points). Similarly, we saw in Table 4 that the value of feeling that a party represents one's views is greater if one voted for the winner (by about 1 percentage point). Therefore it would seem that the values of winning and effective freedom are mutually reinforcing – both increase satisfaction with democracy, and each even more so in the presence of the other. It is better to have voted for the winning party if that party also represents your views, and it is likewise better to have a party that represents your views if that party also won (asuming of course that one votes for the party that represents one's views, if such a party exists). Table 5 presents results which suggest that the effects of winning and effective freedom are also conditional on cardinality.
Probit models of satisfaction with democracy, by cardinality – marginal effects.

Note: Standard errors in parentheses. *p < 0.10; **p < 0.05; ***p < 0.01. The dependent variable is satisfaction with democracy. All models include election fixed effects, with standard errors clustered by election.
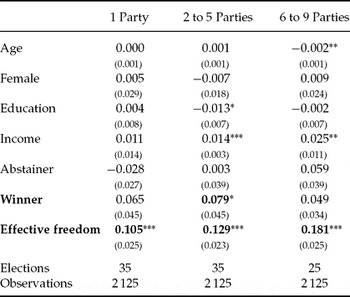
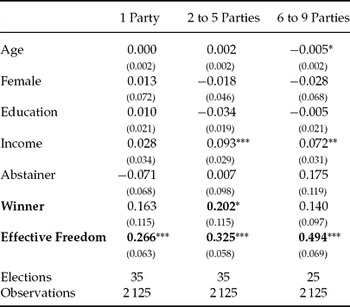
The results in Table 5 are from probit estimations of satisfaction with democracy, with the sample stratified by the number of distinct party platforms perceived by the respondent. The total sample sizes for those who perceived between 2 and 5 parties, and between 6 and 9 parties, were much larger than that for those who perceived only a single distinct party platform. Therefore in order to ensure that the results are comparable across strata, the estimations are based on a random sample of 2125 respondents from each strata (equal to the total number of respondents who perceived only a single party platform). The first thing to note is that the effect of voting for the winner is not robust to the reduction of the sample size. With these reduced samples, winning is only significant for those who perceive between two and five distinct party platforms, and then only weakly so.
In contrast, Effective Freedom always matters. Irrespective of the range of options available, having a party that represents one's views always significantly and substantially increases the probability of being satisfied with democracy. Interestingly though, although effective freedom always matters in this way, its effect is increasing in the number of choices that are available. For a respondent who perceives only one distinct party platform, feeling that a party represents her views increases the probability of her being satisfied with democracy by 10.5 percentage points. For respondents who perceive between two and five distinct platforms, and between six and nine platforms, the effect is 12.9 and 18.1 percentage points, respectively.
Therefore effective freedom, in the sense of being able to vote for a party that represents one's views, has an even bigger effect on satisfaction with democracy when there are more distinct options from which one can choose. This finding is somewhat surprising, and why this is the case should certainly be the subject of further research. Whatever the reason, it adds further support to the view that voters are not ‘democrats’ in the Przeworskian sense – cardinality does not appear to be a substitute for effective freedom. If it were, we would expect this conditional relationship to run in the inverse direction (or not to exist at all), such that the effect of effective freedom should matter less when voters have a larger number of options to choose from, not more.
It is worthwhile remembering that empirically the absence of cardinality does not mean that there were no alternative parties to choose between, but rather that the respondent did not perceive any differences between the platforms of the parties that were contesting the elections. Therefore when all of the parties seem essentially the same, such that the same platform will be implemented irrespective of who wins, less satisfaction is gained by being able to vote for a party that represents one's views. Perhaps then Sen's notion of refined functioning is appropriate after all, in that being able to vote for a party that represents your views means something different when there are real alternatives that could have been chosen instead. If this is the case, the value of cardinality may indeed operate through the impact of agency, by refining the value of what one is able to choose. Clearly, further research is necessary if we are to fully explain these findings.
4. CONCLUSION
This paper was motivated by the question of whether people care about freedom to choose in democracy. The simple answer is yes. But the analysis in the paper allows us to go beyond this simple answer, and to begin to say what it is about freedom to choose that people care about. In short, what matters to voters is that they can choose a party that represents their views, perhaps because doing so enables them to express their preferences, and to have them entered into the public realm. People who are unable to do so are much more likely to be dissatisfied with the democratic process. Therefore what matters is the substance of the electoral alternatives that are available. Although the number of choices also matters, its significance is conditional on being able to vote for a party that represents one's views. People who are able to express their preferences in this way are more likely to be satisfied with democracy if they face more distinct platforms when they vote. In the absence of a representative party, however, the number of choices has no such positive effect. In fact, from the evidence in this paper it seems that without effective freedom, greater cardinality may actually reduce satisfaction with democracy. Therefore, it seems that people do value cardinality, but only in the presence of effective freedom.
Effective freedom is not the only form of achievement that people care about in elections. People also care about winning, in terms of voting for a party that entered the government, although this effect is less robust. And, as with effective freedom, if one voted for the winner, greater cardinality of choice is appreciated. But if one did not vote for the winner, having more options actually appears to be detrimental to democratic satisfaction. However, being able to effectively express one's preference by voting for a party that represents one's interests is always a more important determinant of satisfaction with democracy. In summary then, the value of cardinality is conditional on achievement, whether we think of it as winning or effective freedom. Therefore in terms of cardinality, choice is a luxury good. The more essential democratic value of freedom to choose comes from enabling people to express their preferences, to enter their voices into the public realm.
This analysis poses more questions than it answers. Why does the number of electoral choices only matter to voters who are able to vote for what they want? Why do voters care more about being able to vote for a party that represents their views when they are faced with a larger number of distinct party platforms? Does this really mean that voters are not ‘democrats’, in the Przeworskian sense? Why does voting for the winner condition the value of cardinality? And why, if people cannot vote for a party that represents their interests or did not vote for the winner, might cardinality have a negative effect on satisfaction with democracy? These questions should all be the subjects of further research. Moreover, the analysis in this paper says nothing about the range of electoral options beyond its size; it may be that the distribution of platforms also matters to voters, and further research should investigate this possibility. These questions aside, however, this paper provides an important answer – people do value facing distinct platforms when they vote, but only if one of those platforms effectively represents their views, or if they voted for the winner.
APPENDIX
Probit models of satisfaction with democracy – coefficients.

Note: Standard errors in parentheses. *p < 0.10; **p < 0.05; ***p < 0.01. The dependent variable is satisfaction with democracy. All models include election fixed effects, with standard errors clustered by election.
Probit models of satisfaction with democracy – coefficients.

Note: Standard errors in parentheses. *p < 0.10; **p < 0.05; ***p < 0.01. The dependent variable is satisfaction with democracy. All models include election fixed effects, with standard errors clustered by election.
Probit models of satisfaction with democracy, by winner – coefficients.

Note: Standard errors in parentheses. *p < 0.10; **p < 0.05; ***p < 0.01. The dependent variable is satisfaction with democracy. All models include election fixed effects, with standard errors clustered by election.
Probit models of satisfaction with democracy, by cardinality – coefficients.

Note: Standard errors in parentheses. *p < 0.10; **p < 0.05; ***p < 0.01. The dependent variable is satisfaction with democracy. All models include election fixed effects, with standard errors clustered by election.
Elections included in the analysis.