

1. INTRODUCTION
This article explores the use of music information retrieval (MIR) methods (Casey, Veltkamp, Goto, Leman, Rhodes and Slaney Reference Casey, Veltkamp, Goto, Leman, Rhodes and Slaney2008) in analysing a large database of historical electronic art music. The attraction of such methods is the inexhaustible and objective application of audio analysis. The initial choice of software tool and musical representation, however, plays a determining role in the usefulness of information gleaned from such a study, as often noted by computational musicologists (Marsden and Pople Reference Marsden and Pople1992; Selfridge-Field Reference Selfridge-Field1993; Wiggins, Miranda, Smaill and Harris Reference Wiggins, Miranda, Smaill and Harris1993; Clarke and Cook Reference Clarke and Cook2004). Nonetheless, the chance to work across a much larger corpus of audio than a human musicologist would find comfortable, and, with this corpus, to do so with respect to pieces which are annotated by their year of devising, provides a powerful research challenge.
It is particularly apposite for electronic music, to turn computational tools back on machine-led music; yet the primacy of listening in much studio composition (Landy Reference Landy2007; Manning Reference Manning2013) remains a touch point for this work, and it stands or falls by the machine listening apparatus deployed. To that end, such a study can play a part in cross-validation of the feature extraction and machine learning algorithms applied. After tackling the content of the electronic music corpus (section 2), and the nature of the audio feature extraction utilised (section 3), the investigation moves to year-by-year trends revealed in the audio data (section 4), and inter-year comparison (section 5). Section 6 is based on year prediction, and visualisation of the overall corpus, through machine learning techniques. At the close of the article in section 7, a discussion sets musicological work led by machine analysis in the context of wider analytical research.
2. MAKE-UP OF THE UBUWEB EM CORPUS
The UbuWeb website provides a powerful resource for research and teaching, in its coverage of experimental music and sound art recordings. Even though holding quite obscure materials, it has been the subject of copyright disputes, and has moved host country in an attempt to alleviate such issues. Amongst other electronic music resources including articles and patents, a corpus of historical electronic music, attributed in its digitisation to Caio Barros, remains available online at the time of writing (www.ubu.com/sound/electronic.html).
The corpus consists of 476 MP3 audio files. The total duration is around two days’ worth of audio, taking 7.47GB of space. As UbuWeb themselves note on the source webpage, the database is not perfect in its coverage; indeed, ‘It’s a clearly flawed selection: there’s [sic] few women and almost no one working outside of the Western tradition.’ The music represented is mainly US or European electronic art music, overlapping to a degree with the pieces mentioned in a source text such as Paul Griffith’s A Guide to Electronic Music (Griffiths Reference Griffiths1979), itself rather predisposed to male composers. There is no representation of the substantial output of popular music using electronics, nor indeed of much experimental improvisation or other electronica, but mainly classic ‘textbook’ electroacoustic tape pieces and mixed music. For a few works, the timbre is predominantly that of acoustic instrumental music with occasional electronic interventions; the corpus is not pure electronic music alone. A definite bias towards French composers is apparent, including multiple works of such figures as Pierre Henry and Philippe Manoury. Inclusion or exclusion of certain works in the corpus presents immediate issues of the selection bias of a curator: as an example that may or may not provoke the reader, Stockhausen’s works appear, including all the 1950s electronic works, but the coverage of the 1960s is reduced, missing classics such as Mikrophonie I (1964), Telemusik (1966) and Hymnen (1966–7), though Mixtur (1964) and Kurzwellen (in three versions, one from 1968 and two of Kurzwellen mit Beethoven from 1970) are present.
The year of composition of works extends from 1937 to 2000, with a large gap from 1940 to 1947, and no representatives for 1938, 1973 or 1976! Figure 1 provides a histogram by year of coverage, where the year data from the filenames has been cleaned up. For example, many works in the UbuWeb corpus have a date presented as a range; in some cases this is the year of composition and the year of first performance, in others such as Kontakte it corresponds to a period when the composer was working on a piece; the correction is to the year of completed composition, so 1960 for Kontakte. Note however that the years of composition of works in this corpus is by no means as skewed as the popular music corpus in the Million Song Dataset (Bertin-Mahieux, Ellis, Whitman and Lamere Reference Bertin-Mahieux, Ellis, Whitman and Lamere2011), which is highly biased to the last decade of coverage (see Figure 3 in Bertin-Mahieux et al. Reference Bertin-Mahieux, Ellis, Whitman and Lamere2011; of songs from 1922 to 2011, the clear peak is around 2006).
Year of composition of works in the UbuWeb electronic music corpus

One factor which still skews results as depicted here is that the corpus presents multi-movement works as separate files. This is desirable for audio analysis, in that different movements may perhaps be expected to explore different timbral areas, and the file separation avoids them being aggregated together in summary statistics. However, there are also ambiguities: the UbuWeb corpus gathers the 1948 Schaffer works as ‘5-Etudes-de-Bruits’ which, given how often Chemins de fer is presented in isolation (for example, in undergraduate teaching!), may not correspond to music consumption patterns, though it does mirror the original radio broadcast (Another example is the set ‘Etude-aux-Objets’). The data set also includes duplicate works, with alternative realisations, such as Pousseur’s Scambi (1957) appearing in two versions, or Varèse’s Déserts (1954) in three, and the two versions of Kontakte with and without the piano and percussion instrumental parts. Examining the track listing reveals that 290 audio files are part of 38 multi-movement sets – that is, 61 per cent of the corpus files (however, the multi-movement files only account for 33 per cent of the total time duration of the audio). Figure 2 presents years of compositions where multi-movement and duplicate works are aggregated into single years. Figure 2 presents a slightly flatter visualisation of the coverage in the corpus, though the uneven representation of years is still evident, including gaps in the 1970s that cannot be made up just by aggregating movements of multi-movement works.
Year of composition of works in the UbuWeb electronic music corpus, taking multi-movement and multi-realisation files into account
One further apparent disadvantage of this corpus is the fact that the audio is provided as stereo MP3s, with around half at 256 kilobits per second and half at 320 kilobits per second rate. Use of MP3 format is pragmatic for the distribution of the music from the server, but raises hackles for audio purists. Double-blind experiments have shown the inability of subjects to discriminate MP3s and uncompressed CD quality audio files across multiple music genres at rates of 256 kbps or 320 kbps (and also to not distinguish these two rates), though lower rates of 192 kbps and below are problematic (Pras, Zimmerman, Levitin and Guastavino Reference Pras, Zimmerman, Levitin and Guastavino2009). Listening through the corpus reveals that the essential character of the electronic music works are preserved; since we would expect human analysts to be able to discriminate and productively examine the works on the basis of the MP3s, so a computer must ultimately be able to deal with these listening conditions (even if the MP3 are deemed less than ideal).
Although stereo reduction is imposed in some cases, this is common practice in much examination of electronic music anyway, given the difficulty of obtaining multitrack parts for most classic historic works. For analysis, the spatial component is discarded, and the left and right channels combined as a single mono source (the summation here assumes there are no major phase cancellation issues in such a procedure). Although space is an important component of electronic art music (Manning Reference Manning2013; Harrison and Wilson Reference Harrison and Wilson2010), timbre is another such device, and the tools of MIR are well equipped to tackle timbral information in this corpus; spatial information is omitted from this current study.
Regarding durations of works, Figure 3 presents findings over the corpus across all individual files, with data points plotted for year of a piece on the x axis and its duration on the y. Figure 4 provides a single total duration for multi-movement works. The longest single file work is Xenakis’ Persepolis (1971, 55 minutes) but the combined work with the largest total duration is Philippe Manoury’s Zeitlauf for choir, instrumental ensemble and electronics (1982, 67 minutes). Counting multi-movement works by their total duration, the average duration of works is 14.8 minutes, with a standard deviation of 11.8; using separate movements as separate durations, the average is 7 minutes with a standard deviation of 7.4 (the duration distribution is of course positive/right skewed away from zero, so the calculations here reflect the existence of much longer durations than the mean). Since the repertoire is exclusively art music rather than popular music, the three-minute radio-friendly pop single is not represented, and longer works are unsurprising. There is an arch shape over the whole duration distribution, which points to smaller studies in earlier years (with some longer multi-movement works composed of short individual movements) and a reduction in the scale of works in more recent decades. The former is attributable to the technological challenge of producing early electronic music, taking many person-hours per minute of audio, with more limited compositional resources available. Speculating, the latter may be the victim of the increased number of active composers and the reduced time-per-composer available in festivals and recordings, though it may also be a quirk of selection bias in the original formation of the UbuWeb collection. The total corpus duration is 2.3 days of audio.
Duration of works in the UbuWeb electronic music corpus
Duration of works in the UbuWeb electronic music corpus, combining multi-movement works into single total durations
3. FEATURE EXTRACTION OVER THE CORPUS
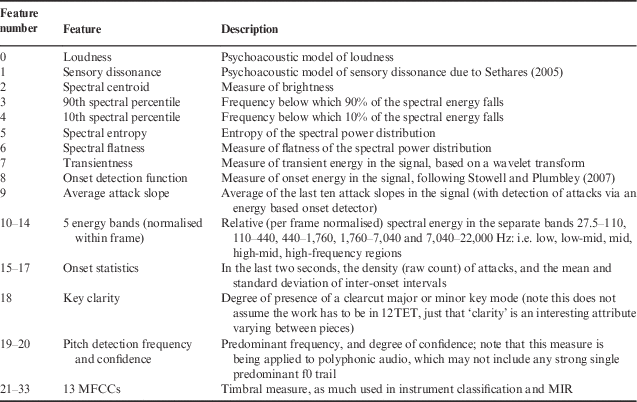
Once the corpus is established, computational audio analysis is applied to every audio file. Table 1 gives a list of audio features extracted; these features were selected because they are potentially illuminating in their musical relevance. Whilst biased towards measures of timbral content, there are some rhythmic measures and basic pitch detection. Whilst more could potentially be extracted (Casey et al. Reference Casey, Veltkamp, Goto, Leman, Rhodes and Slaney2008) there are pragmatic limits; we need to keep the dimensionality of the feature space manageable both in terms of calculation time, to avoid intractable machine learning (see section 6), and to work within the limits of what is available to current generation MIR systems.
Features extracted
Feature extraction calculation proceeds at around 20x real time, with a further brief delay for conversion from MP3 to wav using the lame command line utility (as used in the original encoding of the corpus). So multiple days of audio take a few hours to process. Normalisation of features is necessary to be able to compare values on a similar scale; we first found maxima and minima of features across the whole corpus, and subsequently normalised all feature values within the range [0,1]. Computational audio analysis and subsequent machine learning investigation used the SCMIR SuperCollider Music Information Retrieval library (Collins Reference Collins2011); source code for the feature extraction and subsequent investigation is provided to accompany this article (http://composerprogrammer.com/code/ubuwebarticledata.zip), and the open source nature of SuperCollider makes all the feature extraction algorithms themselves available to researchers to check and reproduce results.
The raw features are extracted at a frame rate of approximately 43 per second (corresponding to an FFT hop size of 1,024 with 44.1KHz sampling rate). These feature values were further aggregated in ‘texture windows’; per-frame feature vectors were reduced to single mean, standard deviation, maximum and minimum values for a piece. Further, time series of feature vectors were derived, applying means, standard deviations, maximums and minimums within one-second windows with a hop size of a quarter of a second. This kind of reduction is necessary to keep comparisons between pieces tractable, though there is always the danger that taking statistical descriptors like means or maxima loses individual information on the distribution and progression of feature values in a work. That both single summary vectors and time series of texture windows were kept allays this concern somewhat, and allows comparison of single statistical summary values versus time series.
Now these derived features have been obtained, further investigation can look at the changing values of individual or combined features within and between pieces over history.
4. YEAR-BY-YEAR TRENDS
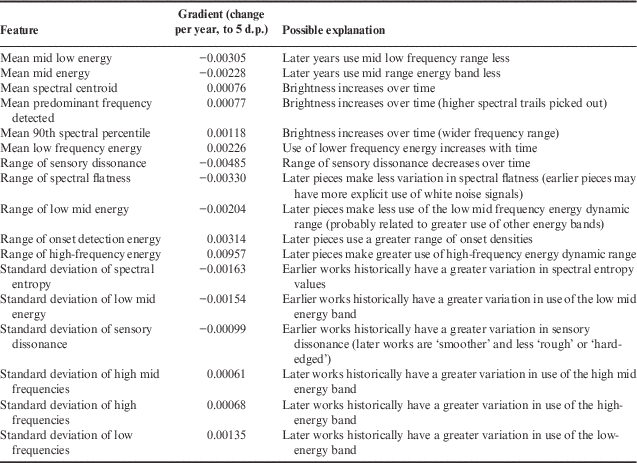
The summary mean, standard deviation and range (maximum–minimum) of feature values for each piece were plotted against year. A line was fitted to each curve – that is, for each of the thirty-four features for each of mean, standard deviation and range. On initial examination, it appeared that there were no obvious trends in the data; for instance, loudness values did not indicate an influence in the 1990s for these art music pieces of a corresponding loudness to in popular music recording (Katz Reference Katz2007)! On closer examination of the curves fitted, larger positive or negative gradients were found as in Table 2.
Trends in feature values over years, by largest and smallest gradients of fitted lines
The primary trend here is the more restricted use of the whole spectral range in earlier works; it is clear that earlier recordings have a more restricted spectral compass, especially using more of the lower mid band. The reduced frequency range is clear from listening and checking spectrograms of 1950s tape works (or especially early musique concrète pre-1951 created using records), though studio recording quality quickly improved after the first wave of work. Reduced high-frequency content and low frequencies necessarily implies more energy in the middle. However, there were no corresponding clear trends evident for dynamic range as such; later works are brighter and have more sub-bass, making more use of low- and high-frequency bands, but variation in spectral entropy even reduces over historical time (this may be linked again to usage of sudden wide-band noise gestures in earlier works, when the technology to produce such gestures was new, was amongst a more limited set of compositional options, and before such gestures became too clichéd). Aligned with the reduction in the range of spectral flatness, this may indicate more explicit use of wide-band noise blasts in earlier works, as exhibited in a work like Pousseur’s Scambi (1957). The table has a few more teasing indications, such as the greater contrast in onset density within later pieces. Figure 5 plots mean spectral centroid and 90th spectral percentile energy for all pieces, with the two fitted line segments superimposed.
Variation over the years in the corpus of the mean across a piece of two features. Spectral centroid is plotted with solid dots for each piece and the fitted line by a solid line; the 90th percentile is plotted with crosses for each piece and a dashed line for the fitted line.
Following Serrà et al.’s study of popular music over time (Serrà, Corral, Boguñá, Haro and Arcos Reference Serrà, Corral, Boguñá, Haro and Arcos2012; see also Raffel and Ellis Reference Raffel and Ellis2013) the per piece mean feature values were aggregated across pieces within five year ranges (so a value for 1955 would be derived from pieces within 1953–1957), which also helps to circumvent the uneven sample size representing each year. For this purpose, we missed out the two early outlier works in the corpus and concentrated on the years 1950–1998 (allowing two years either side, 1948–2000 influence the results). The most obvious trends for the features (as seen from fitted line gradients) were again the increase with years in the use of the low-frequency register with corresponding decrease in the low mid, a pick up in brightness (indicated by the 90th spectral percentile) and an increase in onset density indicating ‘busier’ schedules of event attacks in works later in time (the latter two are plotted in Figure 6).
Variation of mean features within five-year windows from 1950 to 1998, with fitted lines showing the trend. The mean onset density (attacks per two seconds) is plotted with a solid line; the 90th percentile is plotted with a dashed line
5. SIMILARITY MATRICES FOR INTER-YEAR COMPARISON
Having obtained feature values representing each year, it is then possible to compare every year with every other to form a chronological similarity matrix. To accomplish this, the SCMIR facility to create similarity matrices was employed. Figure 7 is the result; the feature values used for each year were those from the last part of the previous section, where averages are taken over all pieces within five-year windows around a given year.
Similarity matrix comparing the years 1950–1998 (the contrast in the image has been increased to make it more visually obvious; original values were used for the peak picking in the main text). The year on the x axis is compared to the year on the y; the matrix is symmetric since the distance measure (the Euclidean distance here) between the feature vector for year x and that for year y is itself symmetric.
One clear aspect of this matrix is the band showing how the period 1976–1979 is generally different to other years in the corpus (the black band leading out horizontally and vertically showing the relation of these years to all others). This may appear to be an artefact of the lack of representatives for 1976; though the five-year window also dampens out that effect, the 1970s have a reduced number of works overall (see Figure 1). In searching for actual works that may stand out here, Xenakis’ La Légende d’Eer (1978) and Chowning’s Stria (1977) might be proposed as sufficiently different from everything else in the corpus to account for this effect, though Xenakis’ Gendy3 and other Chowning works are also present in other years.
Given a similarity matrix, it is possible to look for larger than normal transitions from one year to the next. The standard MIR method uses convolution with a chequerboard kernel along the matrix diagonal (Casey et al. Reference Casey, Veltkamp, Goto, Leman, Rhodes and Slaney2008) to look for larger changes from one self-similar area to a new and different self-similar area (you can see this in Figure 7 as the chequerboard like patterns along the maximally self-similar bottom left to top-right diagonal). A novelty curve can be created showing the changes over time from year to year, and then peak picked for particularly prominent years of change. Running this, the years of greatest change were 1952, 1972, 1973, 1979, 1980 and 1981; on examination of the matrix in Figure 7 and the novelty curve, these reduce to 1952, 1972 and 1980. Whereas there is a strong historical reason to explain 1952 as an interesting transition point given the establishing of elektronisches Musik after previous experiments in musique concrète, 1972 and 1980 appear more mysterious. The year 1972 is only represented by two works in the corpus, one of which is Chowning’s Turenas, which might be said to form a major innovation (not withstanding Risset’s 1969 Mutations, which more modestly employed the FM algorithm, and is in the UbuWeb corpus).
Similarity matrices can be constructed in many ways depending on the actual distance measure used; they can illustrate distances between works as well as between groups of works, though this article prioritises summary data for particular years (or blocks of years). It is possible to use within-piece time-varying data to compare years if we train up particular models on the behaviour of pieces, one model for each year. These models can then predict the data from another year as a measure of distance; if the model finds it straightforward to predict another year’s data, the years may be said to be ‘close together’. The network of distances between the year models forms a similarity matrix.
This time-series modelling was carried out, over the years 1950–1998, using the same method as (Collins Reference Collins2013). The steps are:
1. Create a vector quantisation of feature vectors via a clustering model (dropping them from 34 dimensional vectors to single symbols). In this case, a k-Means clusterer is developed on randomly chosen representative feature vectors, 100 per piece in the corpus (to keep the calculation tractable), with 20 cluster centres forming the 20 symbols. Data for each year (gathered from pieces ±2 years of the centre year) is converted to a stream of symbols based on the cluster centres assigned to every feature vector.
2. For each year, train a prediction by partial match Markov model (Pearce and Wiggins Reference Pearce and Wiggins2004) on the symbol sequence of that year’s data
3. Form a similarity matrix where the distance (A,B) is the symmetric cross likelihood: the score for the model for year A’s prediction of the data for year B is combined with the model for year B’s prediction of the data for year A and the models’ self-scores (A predict’s A’s training data, model B predicts data B) (Virtanen and Helén Reference Virtanen and Helén2007)
Figure 8 plots results, which again show a banding around the years 1973–1980 placing them in contrast to other years in the corpus. The amount of (post k-Means symbolic) data representing each decade is not massively different, though it is least for the 1970s and expanded for the 1980s (1950s: 674,764 symbols; 1960s: 727,708; 1970s: 556,061; 1980s: 1,203,307; 1990s: 641,821). Novelty curve analysis pointed to the years 1955, 1968, 1972 and 1993 as possible transition points; no further speculation is undertaken at this point except to corroborate the appearance of 1972, though the reader can observe that different numerical methods may lead to different years being highlighted (parameters of the peak picking and the window for the novelty curve generation also play a part).
Similarity matrix from symbolic model predictions comparing the years 1950–1998
6. MACHINE LEARNING
It can be further illuminating to apply machine learning algorithms to the corpus data. Given annotated years, or some other derived label such as the decade of composition, a supervised machine-learning task would be to train a predictor which can predict the year of composition. Where this proves to be a difficult task, it may provide evidence that the feature extraction is not sufficiently discriminatory, or if we are willing to trust that the feature extraction is basically effective, that the task is inherently difficult (and that there is a strong musical overlap across years).
Unsupervised algorithms can assist in seeing how the data falls ‘naturally’, at least according to the algorithm, without prior knowledge of date labels. One problem is that the feature extraction presented here places works within a 34-dimensional space; in order to visualise and interpret results, some kind of dimension reduction (herein to two dimensions) must be applied to facilitate plotting.
We now explore the former supervised task by training classifiers and the latter by multi-dimensional scaling (MDS). Calculation used a combination of SuperCollider implementations for the former, and python (from the sklearn package) for the latter; all source code, including for plotting, accompanies this article. There are many more algorithms that could have been deployed (for instance the unsupervised task could be approached with a self-organising map, the supervised with a support vector machine or many other well-known algorithms), so this section is merely a taster of possibilities.
6.1. Year prediction
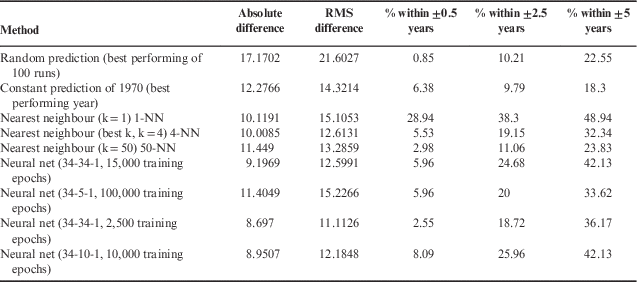
We can attempt to predict the year of the works in the corpus using supervised machine learning. Half the corpus (randomly selected) was used as a training set, and assessment of the quality of prediction was carried out on a test set of the remaining half. In the paper which introduced the Million Song Dataset corpus (of popular music), the authors attempted a similar year prediction task (Bertin-Mahieux et al. Reference Bertin-Mahieux, Ellis, Whitman and Lamere2011). As well as the success metrics used in that paper, consisting of average absolute difference and root mean square difference of the predicted versus actual year, we report the percentage correct within ±0.5 (1 year), ±2.5 (5 year) and ±5 (decade) bands.
A number of prediction methods were compared, including a random prediction (uniform choice from 1937 to 2000 per prediction), constant prediction (all years from 1937 to 2000 were attempted), the k-Nearest Neighbours (k-NN) algorithm (as per the Bertin-Mahieux et al. Reference Bertin-Mahieux, Ellis, Whitman and Lamere2011 paper; the k best matches to the feature vector in the training set are used to predict the year for the test example), and a neural net (specified by number of inputs – number of hidden units – number of output units, and for different numbers of epochs of training). Table 3 lists the results.
Performance on the year prediction task for the UbuWeb corpus (half the corpus (randomly selected) was used for training, half for the testing, leading to these results)
In contrast to Bertin-Mahieux et al. (Reference Bertin-Mahieux, Ellis, Whitman and Lamere2011) the 1-NN classifier performed better than the 50-NN; it is good to see that there is some local regularity of feature vectors allowing the closest vector to predict the year, pointing to some consistency of sound world from year to year over composers and studios. Averaging the 50 nearest years, however, especially given the smaller size of the corpus, is ineffective; a search across all k from 1 to 50 found the best performing (at least in terms of the difference scores) for k=4, though the best percentages were for k=1. Indeed, the 1-NN method outperforms in percentages the best found neural net, though the neural nets had much better difference scores when they didn’t over-fit the training set. That the classifiers do not perform above 50 per cent accuracy even as to the decade further indicates the heterogeneity of the corpus. Nonetheless, the 1-NN results, and the performance far above chance in general, point to some relation between detail captured and summarised with audio features and different years of composition.
It is also possible to attempt a simpler and easier task, to predict the ‘era’ of a piece. In this case, we consider two time spans: before 1972, and 1972 and afterwards (motivated by the appearance of 1972 as a possible important boundary in the corpus from earlier sections of this article). This two-class classification problem can be solved at 50 per cent accuracy by chance, and a constant guess of always predicting a piece originates before 1972 is 55.32 per cent (since 55.32 per cent of pieces have dates preceding 1972). 1-NN performs at 71.06 per cent (the best k=1 again), and a neural net was quickly trained to operate at 79.15 per cent effectiveness (34–34–1, 500 epochs training; more epochs tended to inhibit generalisation). These results are again indicative that there is evolution over time in the timbral nature of pieces sufficient to partially discriminate different eras, though the feature extraction (or the fundamental task itself) remains unable to discriminate the chronological origin of pieces given two options, at 80 per cent or greater effectiveness. Though a human study may be interesting on this task, any human expert would be expected to recognise a priori many works from the corpus, and the machine analysis here provides a more objective take on the problem, whilst pointing to problems of its own in the discriminatory power or otherwise of the feature extraction employed.
6.2. Multi-dimensional scaling to plot piece and year proximities
Multi-dimensional scaling (MDS) allows a low dimensional plot to be made from a similarity matrix – that is, from an exhaustive set of distances between objects, as famously used in perceptual studies in sound timbre (Risset and Wessel Reference Risset and Wessel1999). Since similarity matrices are exactly what were created in section 5, it is straightforward to explore MDS; the python module sklearn was used to run MDS and matplotlib to plot figures once SuperCollider had generated the distance matrices and output them as csv files.
Figure 9 plots by-year data where each year was represented by a mean feature vector and a dissimilarity distance matrix formed by taking Euclidean distances. Whilst some years naturally separate, such as the early 1950s, the overall separation is not that clean, pointing to the problem of representation by a statistical mean alone. Figure 10, however, uses the similarity matrix formed from the predictive models (as per the time-series modelling procedure in Section 5). The MDS algorithm naturally recovers, to some degree, the sequence of years, though there are interesting foldings in the path of successive years that bring, for example, 1972 closer to 1978 than 1973. The clarity of this result though over Figure 9 points to the improved modelling via time series rather than a single summary value.
MDS-derived visualisation from mean feature vectors representing the years 1950–1998
MDS-derived visualisation from time-series models representing the years 1950–1998
Figures 11 and 12 move on to plot MDS carried out on a similarity matrix over feature vector means for all pieces in the corpus. The pieces are labelled by their year of composition and the unique UbuWeb filename tag. Because of the 476 points, the plots are dense; Figure 12 zooms in on the high-density area of Figure 11. Aural checks point to why this kind of analysis is potentially interesting – the proximity, for instance, of 1937 01-01 (Messiaen’s Oraison) and 1975 24-07 (Parmegiani’s 7th movement of De Natura Sonorum) on the left top side of Figure 11 shows a kinship of sustained and modulated synthesised tones that might not have been immediately considered by an analyst – nonetheless, the reader who wishes to will quickly find more problematic correspondences. Such issues again point to issues in the original feature extraction not matching the detailed listening capability of the human analyst.
MDS-derived visualisation across all 476 pieces in the UbuWeb corpus, via the similarity matrix over the mean feature vector
MDS-derived visualisation across all 476 pieces in the UbuWeb corpus, via the similarity matrix over the mean feature vector, zoomed in on the high-density area
7. DISCUSSION
Trusting computer-automated audio analysis means accepting that the feature extraction provides musical description that is psychologically relevant to human listeners and, indeed, captures a musical analyst’s aural experience. It is a leap to claim understanding on the part of the computer to any comparable degree to a human listener. Technical development and psychological validation of machine listening technology constitute an ongoing research field, and this article has pointed at a number of places to underlying discontent with the feature extraction utilised. Though there is gathering interest amongst electronic music scholars in automated methods for analysis (Park, Li and Wu Reference Park, Li and Wu2009; Klien, Grill and Flexer Reference Klien, Grill and Flexer2012), the current study shows the mixed results available with current-generation machine listening, whatever the benefits of objective reproducible research and tireless analysis. A too preliminary conclusion that, for example, electronic art music history is rather homogeneous may only point to the lack of discriminatory power of the feature extraction methodology; fortunately, even current-generation tools point to some variation over time. Though suggestive, trends over time as presented herein are indications for further study, and not definitive discoveries.
The UbuWeb corpus has issues as a resource that go beyond the methods of analysis, though at least it is publicly available! It is well known that problems with meta-data are common in creating larger corpuses. Errors in the formation of a data set have an impact on MIR studies, as the work of Bob Sturm on the Tzanetakis data set used in genre-recognition evaluation has ably demonstrated (Sturm Reference Sturm2012). With the UbuWeb corpus, problems include dates in filenames, the status of multi-movement works, and the coverage of the original selection. In working with the corpus, further quirks found include a three-minute spoken radio concert introduction (Presentation du concert de bruits), the long round of applause at the close of Cage’s Williams Mix, a 12-second silent track accompanying Berio’s Chants parallèles, further silence in an accompanying track to James Dashow’s Mnemonics for violin and computer and two minutes of the last movement of Stockhausen’s Mixtur, a different filename labelling on the last nine tracks of the corpus (61_01 to 61_09) and Chowning’s Phone appearing twice!
The UbuWeb corpus cannot claim, therefore, to be the most carefully controlled and representative gathering of electronic music works (the original creation of the collection did not bear in mind the automatic analysis it has been subjected to here). Despite its flaws, analysis here has pointed to some interesting facets of the development of electronic art music, and scholars of electronic music may continue to find much of use in the corpus, hopefully including the code and results gained in the present study.
Future work will, however, also seek to build a more carefully representative corpus or corpora, better controlled for such factors as gender balance, year of composition, coverage of electronic music styles (especially beyond pure art music), and limiting the influence of acoustic instrument works with only a small electronic component. The treatment of multi-movement works will remain a concern in any new corpus study, since it would deny an extensive critical literature to bar a longer work such as Kontakte. If research questions concern differences between works as a whole, or between composers, or between years, particular aggregation of movements and pieces can be conducted at the analysis software stage as long as the database itself is appropriately marked up (the meta-data accompanying audio must indicate the nature of groupings of individual audio files within a multi-movement form). In certain cases, an extract, a few movements or a single movement might be claimed representative of a longer multi-section work, though any unity of conception of long and multi-movement works would stand in danger of being lost. Further, the current study has sidestepped the extensive issues of spatial sound, by treating timbre as primary and all sources as mono (through channel-summed stereo). Addressing spatial movement will require new analysis machinery, at the very least, extraction of per-channel features and then the means to track perceptually relevant movement within the spatial field taking multiple and all channels into account. That different spatialisation set-ups are assumed by different works is a major challenge for future research.
All of this points to how much there remains to do in working with larger data sets of electronic music. Ultimately, we might hope to create tools which can in some sense ‘save the human analyst’ from listening through massive collections of audio, addressing specific musicological research questions, and which we can trust as our proxies. Machine-led audio analysis has the potential to exceed, at least in objectivity and continuous vigour, the human analyst. Yet the human analyst will only trust those processes that have been thoroughly vetted and validated; the present study is but a starting point in the kind of critically aware work with computational tools that must be undertaken to approach this. There may or may not be a fully trustworthy replacement, but seeking the computerised musicologist is an undertaking that teaches us a huge amount about the processes and limits of analysis itself and the biases of the human scholar, provides an immensely productive research challenge in machine listening and computer music, and gives a unique handle on large corpora including historical development in electronic music that would not be possible by other means.