Introduction
The fourth edition of the Diagnostic and Statistical Manual (DSM-IV) distinguishes between three main classes of phobias: specific phobia; social phobia; agoraphobia (APA, 1994). The latter two are often referred to as complex phobias. In specific phobias, the fear is limited to one or more well-defined classes of objects or situations; e.g. certain animals, aspects of the natural environment (height, storms), specific situations (lifts, planes) or blood/injuries. Social phobia is characterized by a phobic response to one or more social situations, while agoraphobia is defined by fear of places or situations from which escape may be difficult or embarrassing (APA, 1994).
Phobias are among the most common mental disorders (Magee et al. Reference Magee, Eaton, Wittchen, McGonagle and Kessler1996; Kringlen et al. Reference Kringlen, Torgersen and Cramer2001; Kessler et al. Reference Kessler, Chiu, Jin, Ruscio, Shear and Walters2006). They can severely impair functioning (Essau et al. Reference Essau, Conradt and Petermann2000; Stein & Kean, Reference Stein and Kean2000) and an increasing number of fears are associated with greater disability (Stinson et al. Reference Stinson, Dawson, Chou, Smith, Goldstein, Ruan and Grant2007) and adverse life outcomes (Stein et al. Reference Stein, Torgrud and Walker2000). In addition to personal suffering, phobias are also associated with a substantial economic burden to society (Greenberg et al. Reference Greenberg, Sisitsky, Kessler, Finkelstein, Berndt, Davidson, Ballenger and Fyer1999).
Phobias are highly co-morbid (Magee et al. Reference Magee, Eaton, Wittchen, McGonagle and Kessler1996). In a large community sample, Curtis et al. (Reference Curtis, Magee, Eaton, Wittchen and Kessler1998) found that nearly 76% of individuals with a lifetime DSM-III-R simple phobia reported one or more other co-occurring simple phobias (Curtis et al. Reference Curtis, Magee, Eaton, Wittchen and Kessler1998). A substantial co-morbidity between simple and complex phobias was also observed, with the frequency of co-occurrence strongly associated with the number of specific fears.
Understanding the factors underlying this co-morbidity can provide insight into the aetiology of the disorders and inform classification and treatment. Multivariate twin studies can be used to investigate the extent to which a limited number of common genetic or environmental liability factors influencing multiple disorders (Neale & Kendler, Reference Neale and Kendler1995; Krueger & Markon, Reference Krueger and Markon2006).
Phobias aggregate in families (Fyer et al. Reference Fyer, Mannuzza, Chapman, Martin and Klein1995; Stein et al. Reference Stein, Chartier, Hazen, Kozak, Tancer, Lander, Furer, Chubaty and Walker1998) and the results of twin studies largely suggest that this familiality is due to a moderate additive genetic effect, accounting for 20–40% of the variance (Hettema et al. Reference Hettema, Neale and Kendler2001; Merikangas & Low, Reference Merikangas and Low2005). While heritability of individual phobias and irrational fears has been estimated in a number of twin studies, only a few studies have investigated the aetiology of their extensive co-morbidity (Kendler et al. Reference Kendler, Neale, Kessler, Heath and Eaves1992, Reference Kendler, Myers, Prescott and Neale2001) and several important issues have not yet been resolved. The pattern of co-morbidity between the phobias suggests that multiple genetic and environmental factors might be involved. Most genetic epidemiological studies on phobias have, however, not directly addressed this question, but at least one study has found evidence that the genetic factors underlying the co-occurrence of specific and complex phobias may be distinct (Hettema et al. Reference Hettema, Prescott, Myers, Neale and Kendler2005). The extent to which all the specific phobias share genetic and environmental risk factors is also not known. Furthermore, no multivariate twin study that includes all DSM-IV phobias in a female sample has been published.
In this study, we use data from a population-based Norwegian twin study to assess the structure of genetic and environmental liability factors and their relative contributions in the co-occurrence of all DSM-IV phobias in young adult women. By applying models that include multiple liability factors, we investigate whether one or more common genetic and environmental sources are necessary to explain the pattern of co-morbidity.
Method
Sample
Participants in the twin study were ascertained from the Norwegian Institute of Public Health Twin Panel (NIPHTP). The twins were identified through the Medical Birth Registry, established 1 January 1967, which receives mandatory notification of all births in Norway. The NIPHTP is described in detail elsewhere (Harris et al. Reference Harris, Magnus and Tambs2002). A questionnaire study of all Norwegian twins born 1967–1979 was conducted in 1998. Altogether, 8045 twins (response rate 63%) responded after one reminder. The sample included 3334 complete pairs (55%). Data for this report come from an interview study of Axis I and Axis II mental disorders. All complete pairs from the questionnaire study in which both twins had agreed to further contact, 3153 pairs, were invited. An additional 68 pairs were drawn directly from the NIPHTP sample. Informed consent was obtained from all participants after a complete description of the study.
Zygosity was determined by the genotyping of 24 microsatellite markers in all but 385 pairs, for whom zygosity was determined from questionnaire information. Estimated misclassification rate in the entire sample, based on comparison between questionnaire information and results from DNA analyses, was 0.7%.
At least one study has found evidence for sex differences in the heritability of phobias (Kendler et al. Reference Kendler, Jacobson, Myers and Prescott2002). Due to low numbers, we did not have statistical power to resolve the sources of familial resemblance in male twin pairs or to investigate sex differences. Furthermore, the prevalence of phobias was lower in males and our sample contained a considerably smaller sample of male twins. Therefore, we could not conduct independent twin analyses on males and based our analyses solely on female twins. The final sample consisted of 710 complete twin pairs, 446 female monozygotic (MZ) and 264 female dizygotic (DZ), and 10 single responders. Age when interviewed was 19–36 years, mean=28.1.
Measures
DSM-IV Axis I disorders were assessed using a computerized version of the Composite International Diagnostic Interview (CIDI) (Wittchen & Pfister, Reference Wittchen and Pfister1997). The interviews took place between June 1999 and May 2004 and were conducted face to face, except for 169 interviews (11.8%) that for practical reasons had to be done over the telephone. The majority of the 28 interviewers were psychology students in their final training or experienced psychiatric nurses. All received a standardized training programme by teachers certified by the World Health Organization, passed a user licence test for the CIDI and were supervised during the data collection period. Each twin in a pair was interviewed by different interviewers who were blind to the results of the co-twin.
Due to the low prevalence of situational phobia, situational and environmental phobias were merged into a single variable, leaving us with five phobias for analysis: animal phobia; environmental/situational phobia; blood phobia; agoraphobia (with and without panic); social phobia. In addition to assigning full DSM-IV diagnoses, the computerized CIDI interview also assigns subthreshold diagnoses in cases where all but one of the criteria of the full disorder are met. In order to increase statistical power, subthreshold scores were included in the twin analyses. The variables analysed were coded as 0 (no diagnosis), 1 (subthreshold phobia diagnosis) and 2 (full phobia diagnosis). Multiple threshold models were used to test the assumption that these scores represent different points of severity on a single continuum.
Statistical analyses
To assess co-morbidity, odds ratios (OR) and polychoric correlations between the phobias were calculated. Polychoric correlation is a measure of covariation better suited for ordinal data than Pearson correlation and involves estimating the correlation in an assumed bivariate normal distribution underlying the observed scores (Olsson, Reference Olsson1979).
The classical twin model partitions the variance of the observed variable into effects stemming from three latent sources: additive genetic effects (A); shared or common environment (C); non-shared or individual environment (E). Many underlying genes are assumed to contribute to complex and heterogeneous phenotypes, such as mental disorders. If each of the underlying genetic loci contributes a small amount to the phenotype, and this amount is independent of the effects of other loci, then the genetic effect is said to be additive. Because MZ twins are genetically identical, and DZ twins on average share half their genes, the presence of additive genetic effects would tend to make MZ twins correlate twice as highly as DZ twins. Shared environmental effects are defined as those environmental sources that make people exposed to them more similar and such effects would contribute equally to the similarity of MZ and DZ co-twins. A and C can account for the covariance between twins, but there will still be residual variance in the observed phenotypes. This variance is attributed to environmental influences that are unique to each twin. Because all the variance in the observed phenotype has to be accounted for by the model, the variance stemming from measurement error will constitute part of the E effect. The univariate twin model can be extended to include multiple phenotypes, where the covariance between them is partitioned in a similar way to their individual variances. Many different multivariate twin models have been developed, but two of the most commonly used are the independent pathway (IP) and common pathway (CP) models. The main difference between them is that influence common to the disorders in the IP model operates directly through A, C and E factors loading on all phenotypes, whereas in the CP model the common influence is modelled as operating through a latent and unobserved phenotype or factor. This latent factor can be thought of as a risk factor that predisposes to more than one phobia and whose variance is determined by specific A, C and E factors. Since they all operate through the latent phenotype, the pattern of influence of common A, C and E is equal across the observed phenotypes. In contrast, under the IP model, the pattern of covariance explained by common A, C and E can vary.
An important question when selecting multivariate twin models concerns the number of latent variables to include. Often multivariate twin models a priori assume that a single latent variable can account for the covariance between the phenotypes. However, the more heterogeneous the phenotypes, the more problematic it becomes to force the model to attribute all genetic or environmental covariance to a single underlying source. With five observed phenotypes we have enough data to include two latent common factors but, as always, the more parameters included, the greater the risk of over-fitting. To assess the likelihood that more than one common factor underlies the pattern of co-occurrence, confirmatory factor analyses were carried out in MPLUS (Muthén, Reference Muthén2007). The IP model is perhaps the most commonly used multivariate model in twin studies, both of phobia as well as psychopathology in general. However, the two-factor CP model, which is nested under the two-factor IP model, is more parsimonious and has 14 fewer parameters as well as two additional constraints. These 16 degrees of freedom relative to the IP model makes it less prone to over-fitting. To select the best full reference model, we therefore fitted both a two-factor IP and CP model.
Running all possible submodels of the full model, where different permutations of the 31 non-threshold parameters are dropped, may also result in over-fitting to the data and we therefore restricted the number of submodels tested to those where a large number of parameters (all A, all C or the entire second common factor) were dropped.
All genetic models were fitted by means of maximum likelihood (ML) in Mx (Neale, Reference Neale2003). ML analyses of raw ordinal data do not directly provide an overall test of goodness-of-fit, but relative fits of nested submodels against the full model can be compared using the χ2 test (Δχ2df). Models with fewer parameters are preferable if they do not result in a significantly worse fit. An alternative method that combines parsimony and explanatory power is Akaike's Information Criterion (AIC), calculated as Δχ2 – 2Δdf (Akaike, Reference Akaike1987). However, AIC used alone to determine the ‘best’ model could yield incorrect results and both twin correlation and estimates from the full model should be taken into consideration when the results are interpreted (Sullivan & Eaves, Reference Sullivan and Eaves2002).
Results
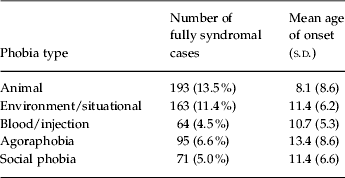
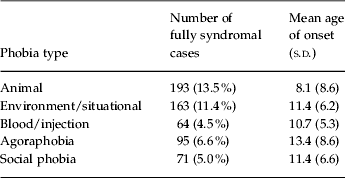
Lifetime prevalence for the five phobias range from 5.0% (social phobia) to 13.5% (animal phobia), as shown in Table 1.
Fully syndromal phobia cases in female monozygotic or dizygotic twins (total sample 1430)
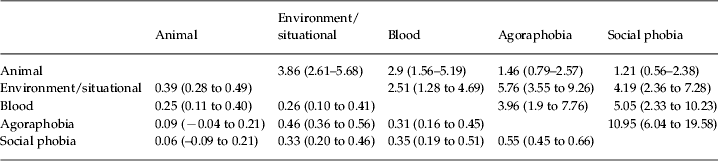
Co-occurrence of the phobia subtypes is listed in Table 2 as both ORs between categorical diagnoses and polychoric correlations including subthreshold measures.
Odds ratios of fully syndromal phobia diagnoses are above the diagonal, polychoric correlations of scores including subthreshold values are below
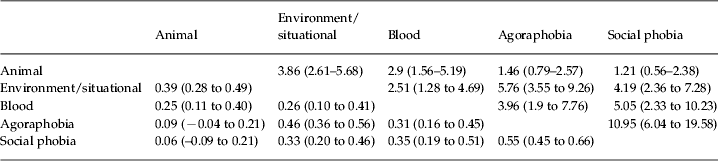
95% confidence intervals are shown in parentheses.
Substantial co-morbidity was observed, with most of the ORs found to be in the range 3–5. Animal phobia had a substantially lower degree of co-occurrence with the complex phobias compared with either of the other specific phobias and neither of these ORs was statistically significant. Co-morbidity between social phobia and agoraphobia was considerably higher than between any other pair of disorders [OR 10.95 (95% CI 6.04–19.58)].
Confirmatory phenotypic factor analyses indicated that a model with two common latent variables was substantially better able to account for the pattern of correlation between the phobias than a model with only one latent factor [χ52=32.076, p<0.001, root mean square error of approximation (RMSEA)=0.055, v. χ12=1.663, p=0.197, RMSEA=0.019]. Two common factors were therefore included in our full twin models.
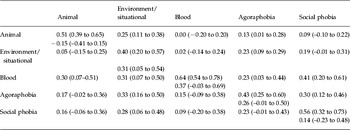
Table 3 displays the polychoric twin correlations with 95% confidence intervals.
Twin correlations for animal phobia, environmental and situational phobia, blood phobia, agoraphobia and social phobia

95% confidence intervals are shown in parentheses.
Monozygotic twin correlations are shown below the diagonal; dizygotic twin correlations are shown above the diagonal.
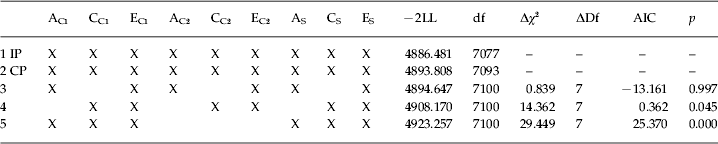
Fit statistics for the biometric models are given in Table 4. The full IP model (model 1) necessarily attains a lower –2LL value, as it has more parameters than the CP model (model 2). However, the difference in –2LL is only 7.327, which is not significant on 16 degrees of freedom and gives the CP model a substantially lower AIC (−24.673). This indicates that the two-factor CP model is the most parsimonious and submodels (models 3, 4, 5) are therefore all CP models, with fit-statistics given relative to model 2.
Multivariate model-fitting results for the five phobias
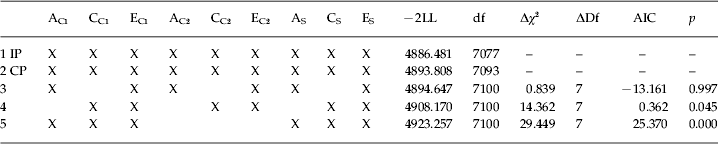
A, Additive genetic effect; C, shared or common environment; E, non-shared or individual environment; df, degrees of freedom; AIC, Akaike's Information Criterion; IP, independent pathway; CP, common pathway; subscripts C1 and C2, the first and second latent common factor, respectively; subscript S, influences specific to this disorder.
Fit statistics for models 3–5 are given relative to model 2 (two-factor CP model).
In model 3, all common environmental parameters (C) were dropped. This AE model fits very well, as indicated by a low AIC value. Dropping all additive genetic effects (model 4) resulted in a much poorer fit, with a substantial increase in AIC. A single-factor model (model 5) fits significantly worse than a two-factor model and could be rejected (Δχ82=29.449, p<0.001). A two-factor CP AE model was therefore found to be the best fitting model.
The relative contributions of specific and common A and E to the variances of the different phobias under the best fitting model are shown in Table 5. The estimated genetic influence on the phobias ranges from 43% to 63%.
Total variance accounted for by additive genetic factors (A) and unique environment (E) for the different phobias in the best fitting model, as well as the variance accounted for by each of the underlying common (C1, C2) and specific (S) factors

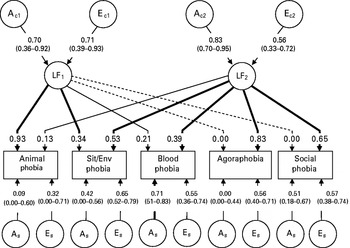
Parameter estimates under the best fitting model are shown in Fig. 1. The first common factor (influenced by AC1 and EC1) loaded almost exclusively on animal phobia, with only a modest loading on situational/environmental and blood phobia. The second factor had the highest loading on agoraphobia (0.83) and social phobia (0.65), but also loaded moderately on the specific phobias, with the exception of animal phobia.
Parameter estimates for the best fitting twin model. LF1 and LF2 refer to the two latent factors common to all phobia types. To determine the amount of variance explained by the factors, path coefficients must be squared. Common paths over 0.3 and the largest specific genetic loading are marked with bold lines, while dashed lines indicate no association. 95% confidence intervals are shown in parentheses. A, additive genetic effects; E, non-shared or individual environment; subscripts C1 and C2, the first and second latent common factor, respectively; subscript S, influences specific to this disorder; Sit/Env, situational/environment.

Disorder specific genetic effects (As) were particularly evident for blood phobia, where it accounted for 81% of the genetic and 51% of the total variance. To a lesser extent, specific genetic influences were also found for environmental/situational and social phobia, where it accounted for 40% and 47% of the genetic and 17%, and 26% of the total variance respectively.
The amount of variance explained by the latent factors can be estimated by squaring the path coefficients. Genetic factors accounted for 49% of the variance of the first latent factor and 69% of the second factor.
Discussion
While phobias are consistently found to be among the most prevalent mental disorders, rates vary considerably between studies. The prevalence in our sample is well within the range reported in major epidemiological surveys (Alonso et al. Reference Alonso, Angermeyer, Bernert, Bruffaerts, Brugha, Bryson, de Girolamo, de Graaf, Demyttenaere, Gasquet, Haro, Katz, Kessler, Kovess, Lepine, Ormel, Polidori, Russo, Vilagut, Almansa, Arbabzadeh-Bouchez, Autonell, Bernal, Buist-Bouwman, Codony, Domingo-Salvany, Ferrer, Joo, Martinez-Alonso, Matschinger, Mazzi, Morgan, Morosini, Palacin, Romera, Taub and Vollebergh2004; Kessler et al. Reference Kessler, Berglund, Demler, Jin and Walters2005, Reference Kessler, Chiu, Jin, Ruscio, Shear and Walters2006).
In accordance with previous studies (Magee et al. Reference Magee, Eaton, Wittchen, McGonagle and Kessler1996), lifetime co-morbidity between the different phobias was high. A considerably higher co-morbidity was observed between the complex phobias than between either of the complex phobias and the specific phobias (Merikangas & Angst, Reference Merikangas and Angst1995; Kendler et al. Reference Kendler, Myers, Prescott and Neale2001; Ruscio et al. Reference Ruscio, Brown, Chiu, Sareen, Stein and Kessler2008). Animal phobia distinguishes itself by a low level of co-occurrence with the other phobias, and especially with the complex phobias, with which the associations were not statistically significant.
We draw three main conclusions from the multivariate twin analyses. First, all phobias were found to be moderately to highly heritable. Although there was some indication of shared environmental influences in the full model, this could be discarded with hardly any loss in fit. This is in agreement with the result of Kendler et al. (Reference Kendler, Neale, Kessler, Heath and Eaves1992), who found no C on a set of four phobias in a sample of 2163 female twins.
In the best fitting model, heritabilities for the five phobia subtypes range from 43% to 63%. These heritability estimates are somewhat higher than what has been reported in most previous twin studies, where heritability typically ranges between 20% and 40% (Kendler et al. Reference Kendler, Neale, Kessler, Heath and Eaves1992, Reference Kendler, Jacobson, Myers and Prescott2002; Skre et al. Reference Skre, Onstad, Torgersen, Lygren and Kringlen2000; Hettema et al. Reference Hettema, Neale and Kendler2001; Distel et al. Reference Distel, Vink, Willemsen, Middeldorp, Merckelbach and Boomsma2008). One possible explanation for this could be that phobias might have been more reliably assessed in our study due to the relatively young age of our sample. Increased reliability will deflate estimates of non-shared environment and thereby increase heritability.
Second, the pattern of co-occurrence could best be accounted for by two common liability factors, both of which were highly heritable. The first liability factor accounted for nearly all the variance in animal phobia, but also had modest loadings on the two other specific phobias. It influenced neither social phobia nor agoraphobia. The second common liability factor loaded most heavily on the complex phobias, but had modest loading also on situational/environmental and blood phobia and a weak influence on animal phobia. This suggests that the genetic risk factors underlying animal phobia are, to a large extent, disorder specific. This is in accordance with the results of a study by Bienvenu et al. (Reference Bienvenu, Hettema, Neale, Prescott and Kendler2007), where all genetic risk for agoraphobia and social phobia was shared with the personality traits of neuroticism and extroversion, but animal phobia shared only 16% of the genetic risk with these personality traits, suggesting that genetic risk factors for complex phobias and animal phobia are largely distinct. Although our second common factor loads most heavily on agoraphobia and social phobia, it also accounts for co-morbidity between the specific and complex phobias. The common risk factors are therefore more general than what was found by Hettema et al. (Reference Hettema, Prescott, Myers, Neale and Kendler2005), who in a multivariate twin study of anxiety disorders found virtually no overlap between the genetic factors underlying the simple and complex phobias. Unfortunately, most other multivariate twin analyses of phobias have only used models that included one common liability factor. More research is therefore needed to determine whether distinct genetic and environmental factors really underlie specific and complex phobias. We also found little evidence to support the hypothesis that heritability was higher for complex than simple phobias, as was suggested in the first multivariate twin studies on phobia (Kendler et al. Reference Kendler, Neale, Kessler, Heath and Eaves1992).
An empirically based hierarchical model for the co-morbidity between common mental disorders (Krueger, Reference Krueger1999; Krueger & Markon, Reference Krueger and Markon2006) has been proposed. In this meta-structure, which has been replicated in several samples (Vollebergh et al. Reference Vollebergh, Iedema, Bijl, de Graaf, Smit and Ormel2001), co-morbidity between Axis I disorders are accounted for by two correlated factors, labelled externalizing and internalizing. The internalizing factor in turn influences two subfactors, anxious-misery and fear, the latter of which includes the phobias as well as panic disorder. Kendler et al. (Reference Kendler, Prescott, Myers and Neale2003) found evidence that the subdivision of the internalizing factor is largely due to genetic influences. Previous studies have, however, grouped all simple phobias in one variable. Our results indicate that when specific phobias are analysed as separate entities alongside the complex phobias, two rather than one common factor best accounts for the observed co-morbidity. This suggests that the genetic architecture of common psychiatric disorders may be more complex than previously thought.
Third, not all the genetic influences on phobias could be explained by the two common factors. While specific genetic influences were estimated for both environmental/situational phobia and social phobia, by far the strongest indication of a specific genetic influence was found for blood phobia, where >80% of the genetic variance was disorder specific. This is noticeable, given that blood phobia distinguishes itself so strongly from the other phobias in the physiological response it elicits. Unlike other phobias, blood phobia is characterized by a sudden drop in heart rate and blood pressure, often resulting in fainting (Page, Reference Page1994). However, while specific genetic influences on blood phobia may be plausible, very little specific genetic effects were found in a previous multivariate analysis of phobia in a large sample of male twins (Kendler et al. Reference Kendler, Myers, Prescott and Neale2001). In fact, in this sample, blood phobia was the disorder loading most heavily on the common genetic factor. This could be due both to possible sex differences in heritability for phobias in general (Kendler et al. Reference Kendler, Jacobson, Myers and Prescott2002) and specific sex-related characteristics hypothesized for blood phobia (Bracha et al. Reference Bracha, Bienvenu and Eaton2007). Future studies with larger samples are needed to clarify this issue.
Limitations
The results should be considered in the context of the following limitations. All participants were young female Norwegian twins in a fairly narrow age range and the results may therefore not generalize to males or to other cultural or ethnic groups. While specific and social phobias usually have an age of onset in the early teens, agoraphobia typically has a later age of onset. As we are studying lifetime diagnoses in young individuals, one or both may not have developed the disorder at the time of interview.
Although the majority of the diagnoses were fully syndromal, we included some subthreshold phobia diagnoses in the twin analysis to increase statistical power. Multiple threshold tests indicate that both categories represent different points of severity on a single continuum and this should therefore not influence the results.
Despite a relatively large population-based sample, our statistical power was limited. While we found little evidence of shared environmental effects even in our full model, our power to detect C effects of small magnitude is low.
Substantial attrition was observed in this sample from the birth registry through three waves of contact. We report detailed analyses of the predictors of non-response across waves elsewhere (Tambs et al. Reference Kendler, Prescott, Myers and Neale2009). Briefly, cooperation was strongly predicted by female sex, monozygosity and higher educational status, but not by symptoms of psychiatric disorders. A series of analyses did not show any evidence of changes in the genetic and environmental covariance structure due to recruitment bias for a broad range of mental health indicators in the second questionnaire. While we cannot be certain that our sample was representative with regard to psychopathology, these findings suggest that a substantial bias is unlikely.
Acknowledgements
The work was supported by grant MH-068643 (PI Kendler) and MH-65322 (PI Neale) from the National Institutes of Health. The twin program of research at the Norwegian Institute of Public Health is supported by grants from The Norwegian Research Council, The Norwegian Foundation for Health and Rehabilitation and by the European Commission under the program ‘Quality of Life and Management of the Living Resources’ of 5th Framework Program (no. QLG2-CT-2002-01254). Genotyping on the twins was performed at the Starr Genotyping Resource Centre at the Rockefeller University. We are very grateful to the twins for their participation.
Declaration of Interest
None.